| Param | Original file | Final file |
|---|---|---|
| Filename | modeM0/AS1G07_024T01_9000001206_08636cztM0_level2.evt | modeM0/AS1G07_024T01_9000001206_08636cztM0_level2_quad_clean.evt |
| Size (bytes) | 440,294,400 | 119,171,520 |
| Size | 419.9 MB | 113.7 MB |
| Events in quadrant A | 2,922,431 | 793,539 |
| Events in quadrant B | 3,210,944 | 809,616 |
| Events in quadrant C | 3,192,605 | 790,779 |
| Events in quadrant D | 3,563,139 | 758,919 |
| Mode M0 | |||
|---|---|---|---|
| Quadrant | BADHDUFLAG | Total packets | Discarded packets |
| A | 0 | 13391 | 4 |
| B | 0 | 14052 | 1 |
| C | 0 | 14127 | 1 |
| D | 0 | 15327 | 1 |
| Mode M9 | |||
|---|---|---|---|
| Quadrant | BADHDUFLAG | Total packets | Discarded packets |
| A | 0 | 11 | 0 |
| B | 0 | 11 | 0 |
| C | 0 | 11 | 0 |
| D | 0 | 11 | 0 |
| Mode SS | |||
|---|---|---|---|
| Quadrant | BADHDUFLAG | Total packets | Discarded packets |
| A | 0 | 130 | 0 |
| B | 0 | 130 | 0 |
| C | 0 | 130 | 0 |
| D | 0 | 130 | 0 |
| Quadrant | Total seconds | Saturated seconds | Saturation percentage |
|---|---|---|---|
| A | 6556 | 30 | 0.457596% |
| B | 6557 | 44 | 0.671039% |
| C | 6557 | 114 | 1.738600% |
| D | 6557 | 144 | 2.196126% |
Noise dominated data is calculated using 1-second bins in cleaned event files. If a bin has >2000 counts, and if more than 50% of those come from <1% of pixels, then it is considered to be noise-dominated and hence unusable.
| Quadrant | # 1 sec bins | Bins with >0 counts | Bins with >2000 counts | High rate bins dominated by noise | Noise dominated (total time) | Noise dominated (detector-on time) | Marked lightcurve |
|---|---|---|---|---|---|---|---|
| A | 7587 | 6557 | 1 | 1 | 0.01% | 0.02% | 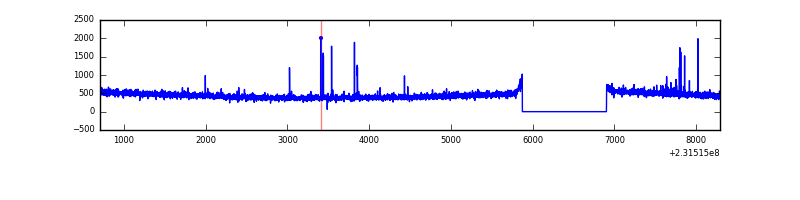 |
| B | 7587 | 6557 | 15 | 15 | 0.20% | 0.23% | 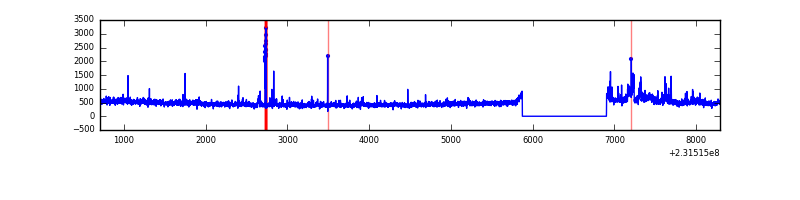 |
| C | 7587 | 6557 | 78 | 78 | 1.03% | 1.19% | 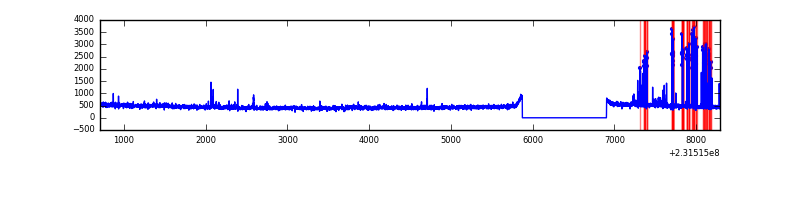 |
| D | 7587 | 6557 | 103 | 103 | 1.36% | 1.57% |  |
Top three noisy pixels from each quadrant. If the there are fewer than three noisy pixels in the level2.evt file, extra rows are filled as -1
| Pixel properties | Quadrant properties | ||||||
|---|---|---|---|---|---|---|---|
| Quadrant | DetID | PixID | Counts | Sigma | Mean | Median | Sigma |
| A | 5 | 16 | 21760 | 138.54 | 749 | 732 | 151.8 |
| A | 15 | 174 | 14659 | 91.75 | 749 | 732 | 151.8 |
| A | 12 | 194 | 6952 | 40.98 | 749 | 732 | 151.8 |
| B | 0 | 168 | 55145 | 380.28 | 757 | 740 | 143.1 |
| B | 15 | 255 | 51061 | 351.74 | 757 | 740 | 143.1 |
| B | 4 | 80 | 37099 | 254.14 | 757 | 740 | 143.1 |
| C | 8 | 208 | 295154 | 1743.17 | 731 | 734 | 168.9 |
| C | 14 | 67 | 39381 | 228.82 | 731 | 734 | 168.9 |
| C | 13 | 61 | 5724 | 29.54 | 731 | 734 | 168.9 |
| D | 1 | 52 | 496849 | 2738.72 | 732 | 710 | 181.2 |
| D | 2 | 14 | 117928 | 647.05 | 732 | 710 | 181.2 |
| D | 9 | 64 | 48637 | 264.56 | 732 | 710 | 181.2 |
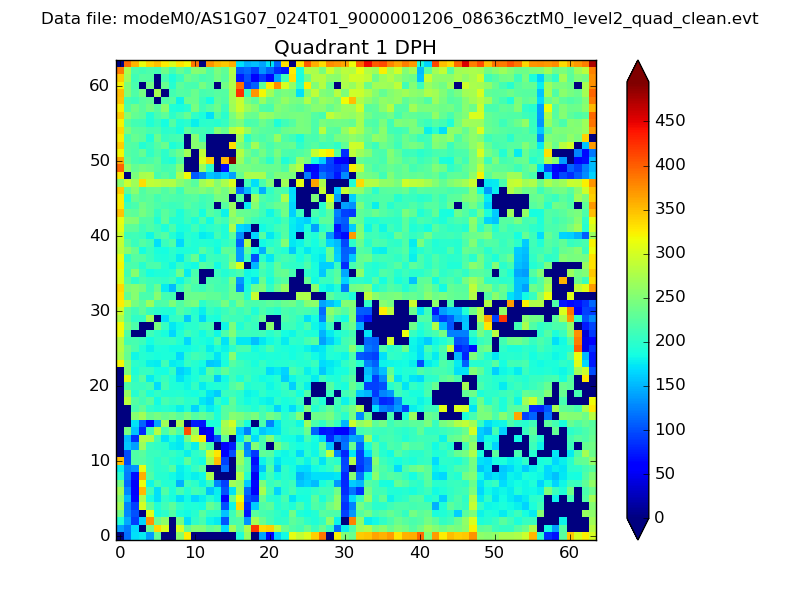
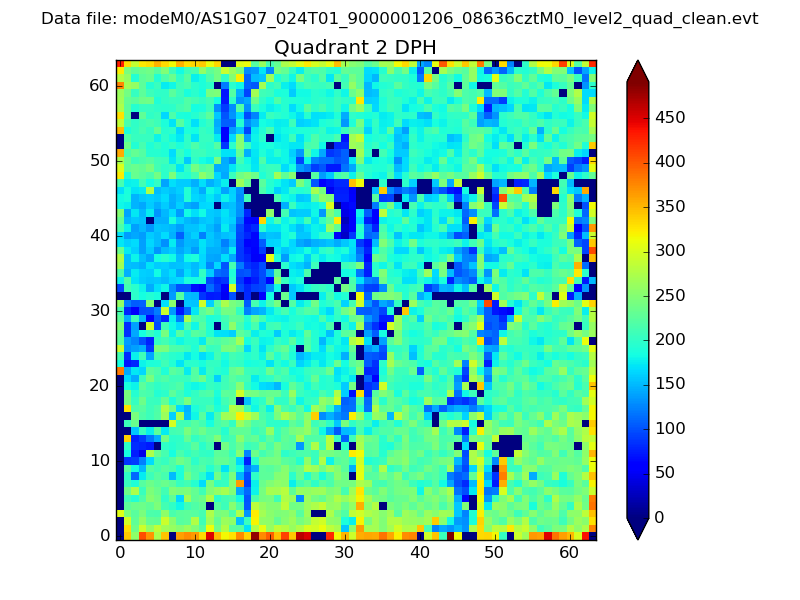
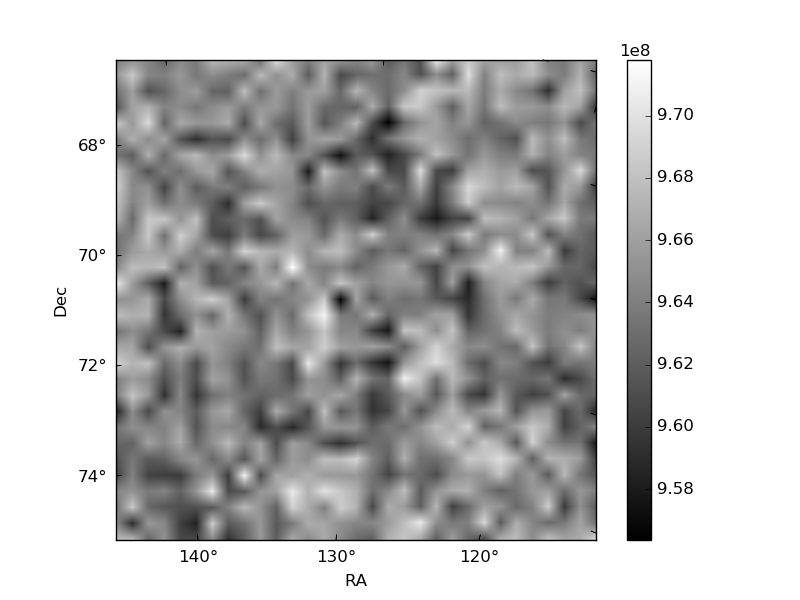
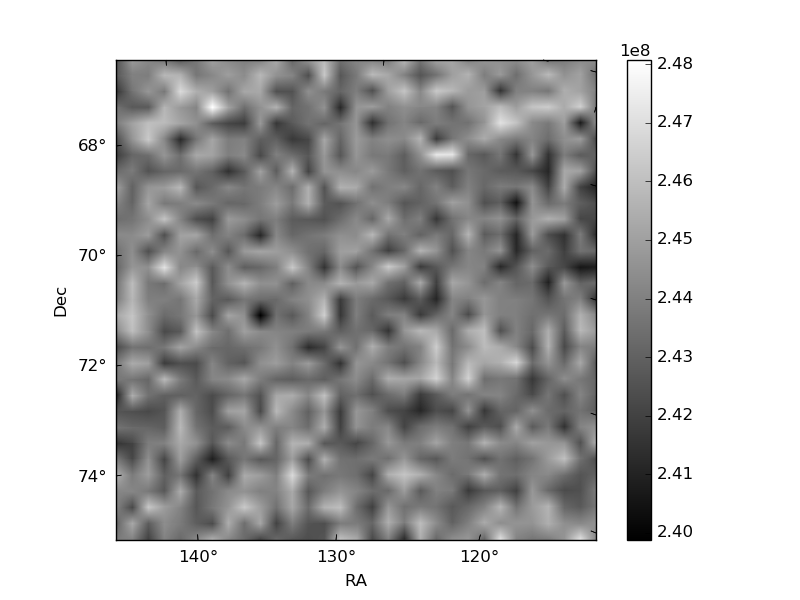
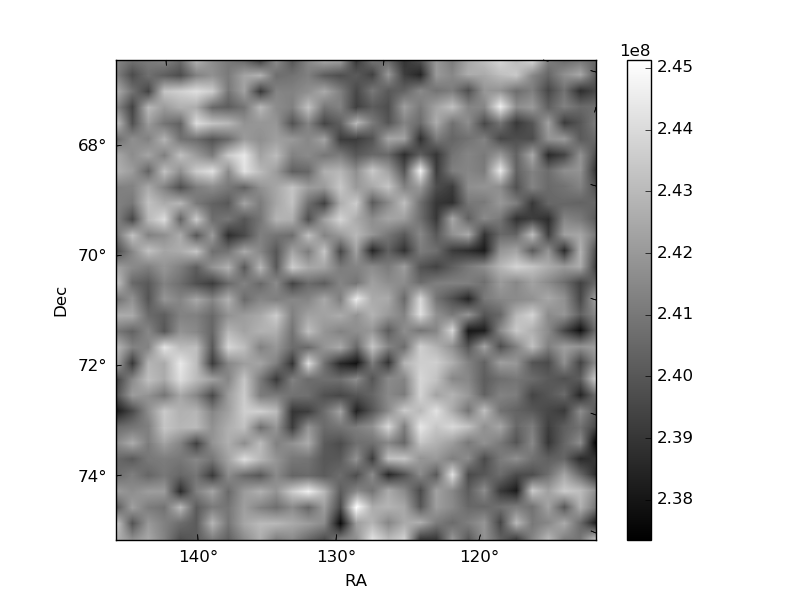
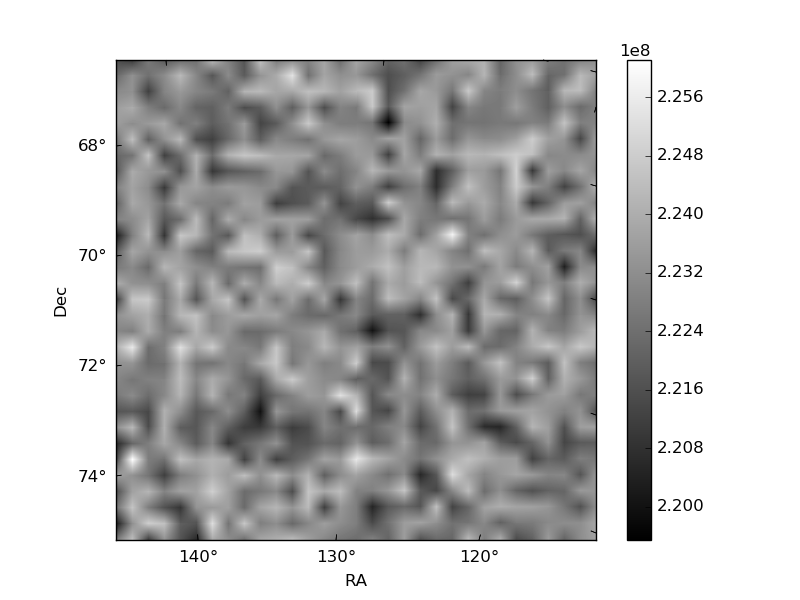
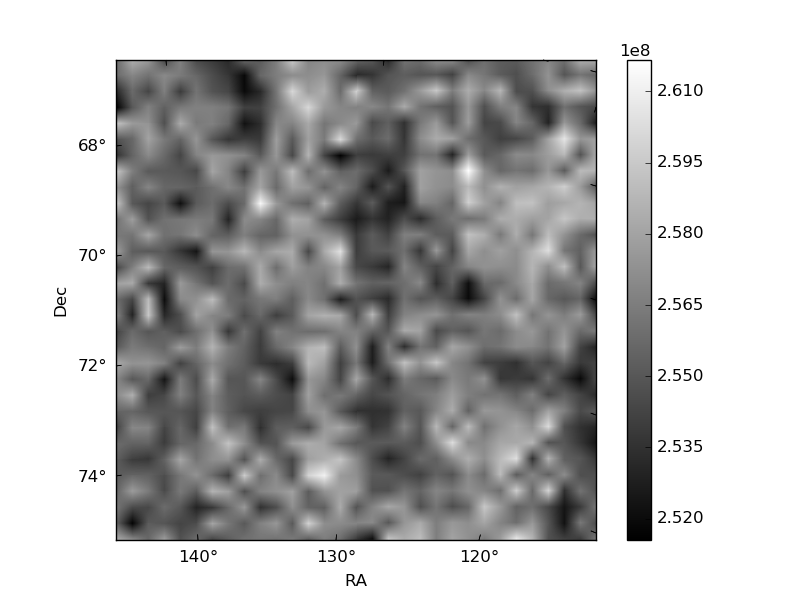
Histogram calculated using DETX and DETY for each event in the final _common_clean file
| Quadrant A | 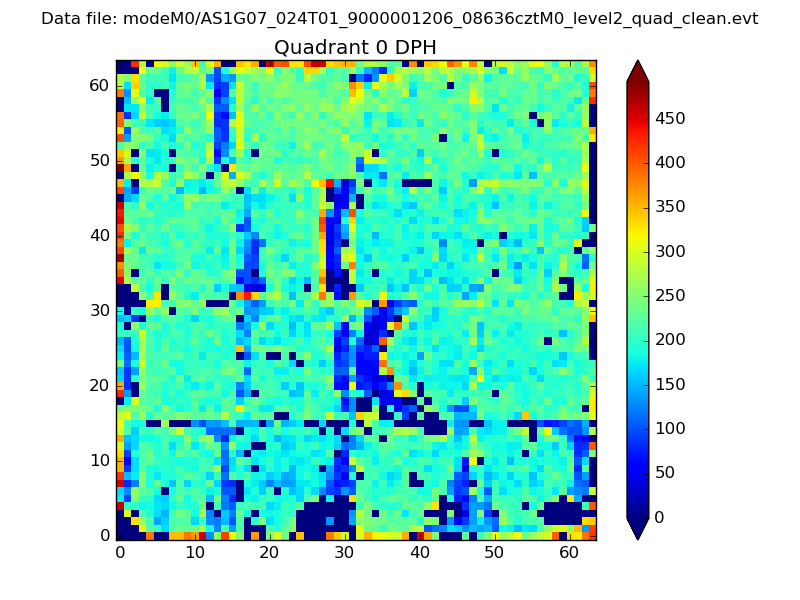 |
 |
Quadrant B |
|---|---|---|---|
| Quadrant D | 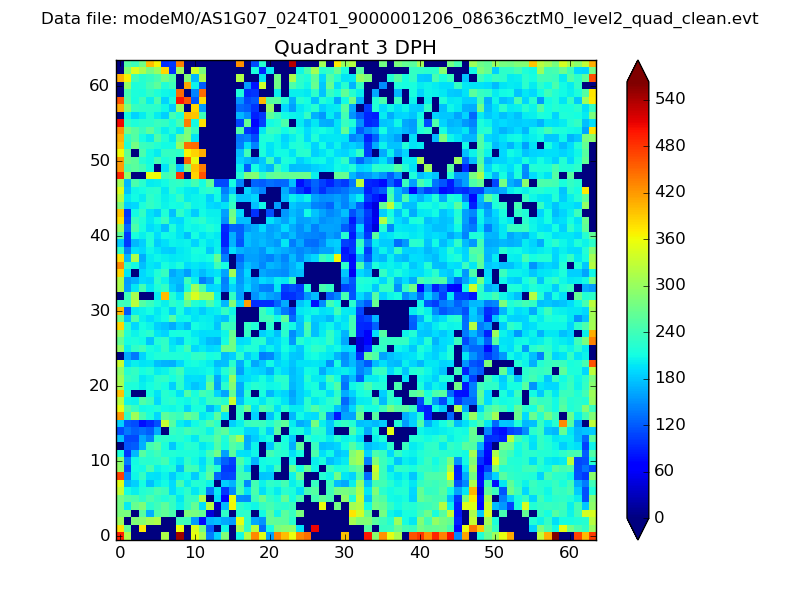 |
 |
Quadrant C |
| Plot type | Count rate plots | Images |
|---|---|---|
| Comparison with Poisson distribution Blue bars denote a histogram of data divided into 1 sec bins. Red curve is a Poisson curve with rate = median count rate of data. |
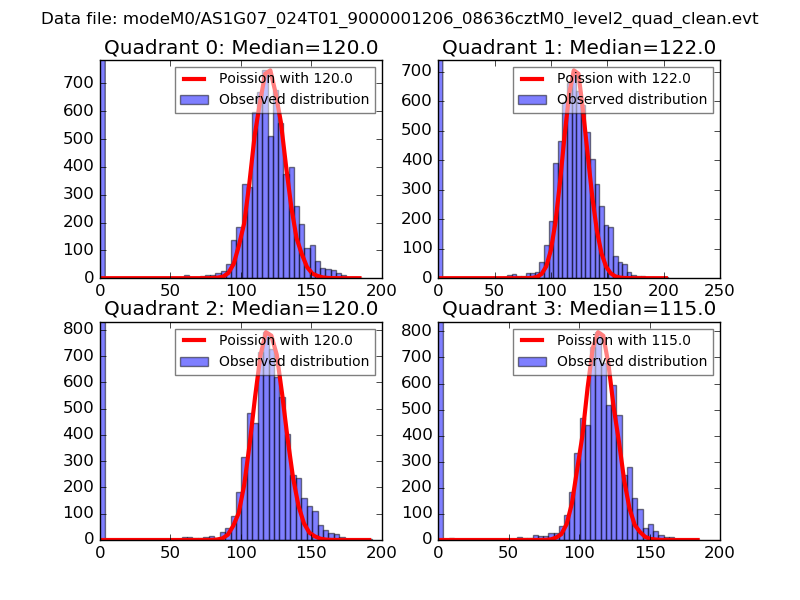 |
 |
| Quadrant-wise count rates Data is divided into 100 sec bins |
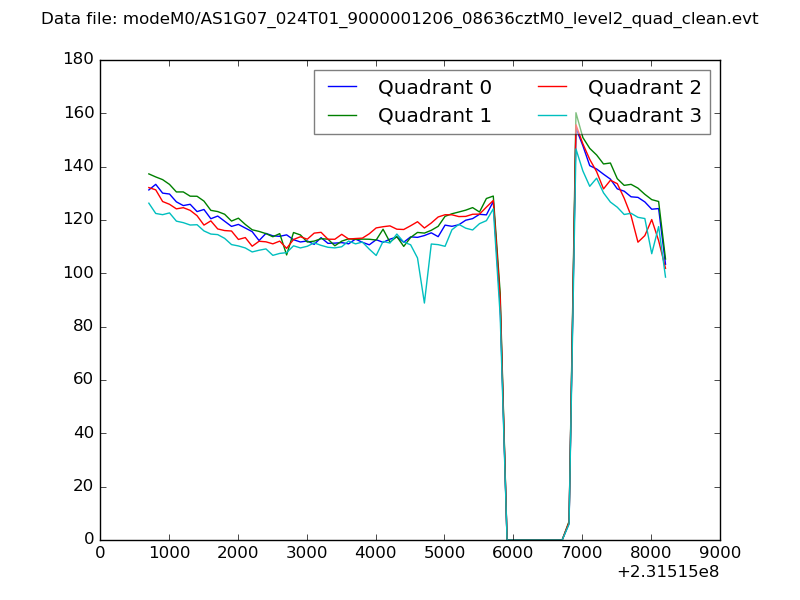 |
|
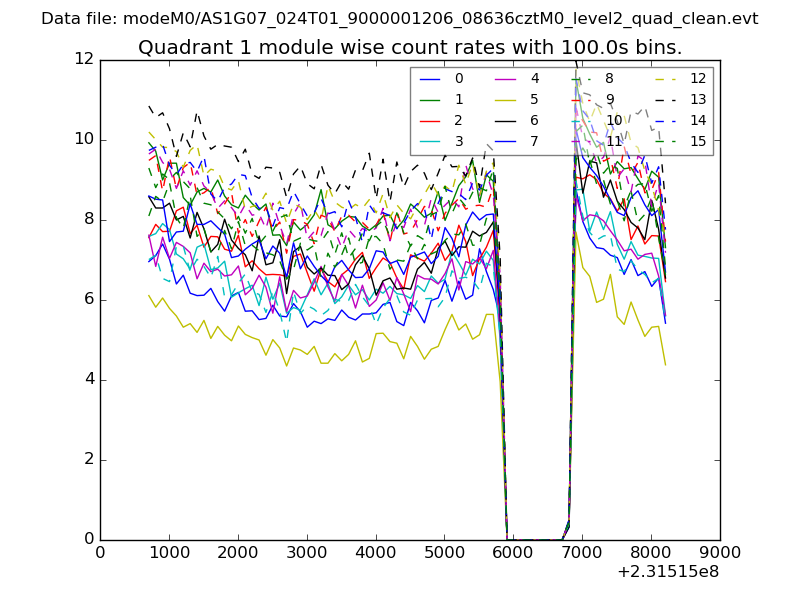
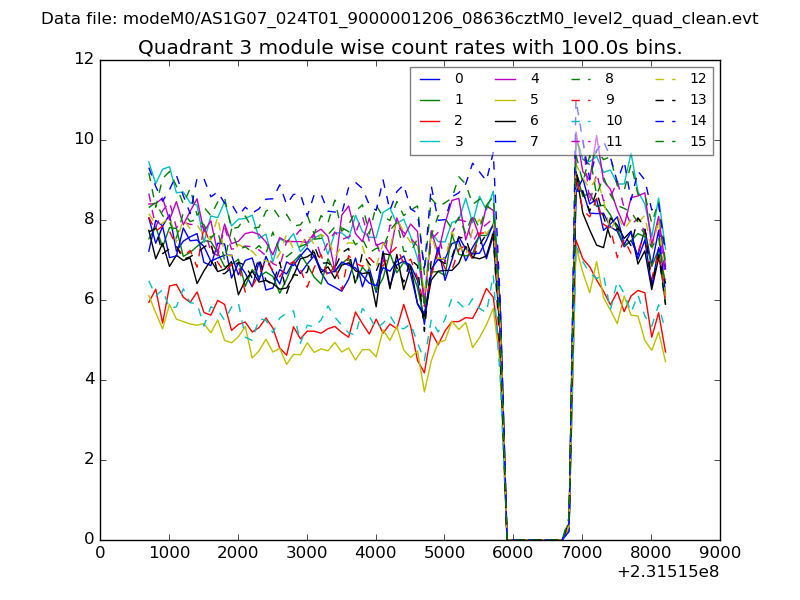
| Module-wise count rates for Quadrant A Data is divided into 100 sec bins |
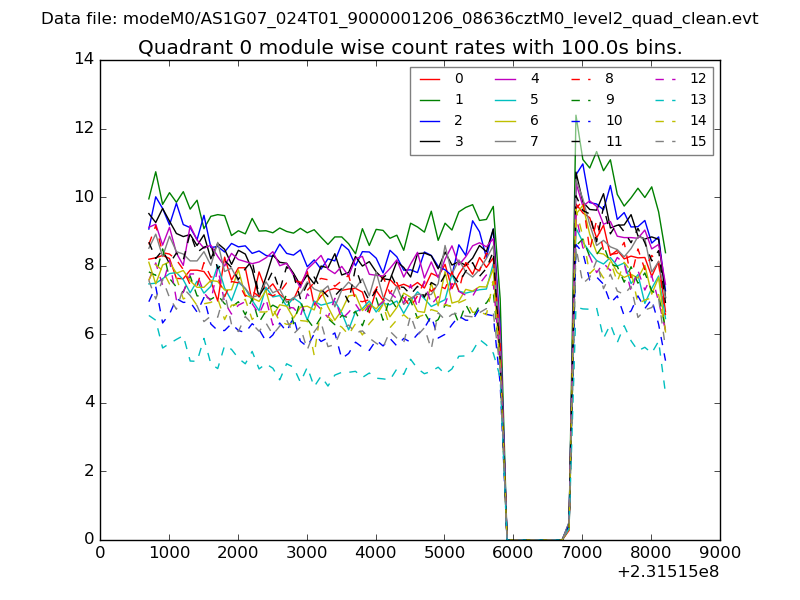 |
 |
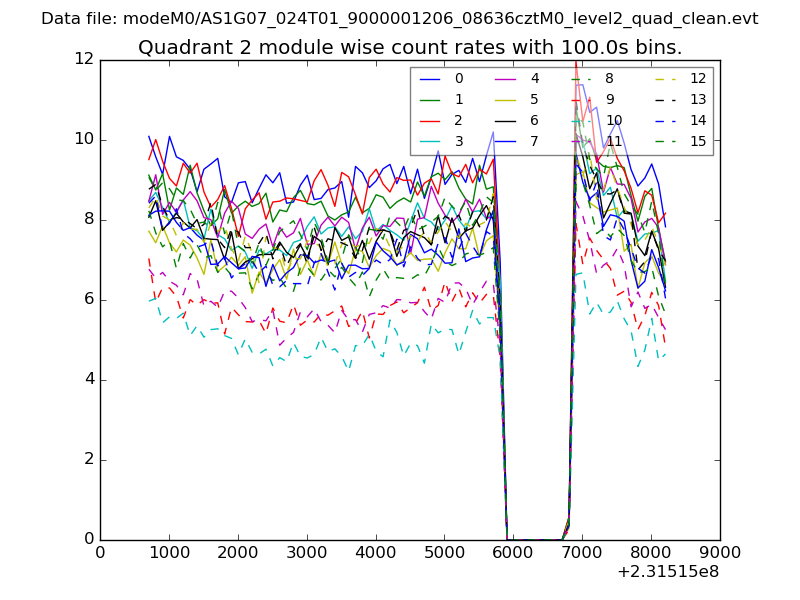
| Module-wise count rates for Quadrant B Data is divided into 100 sec bins |
 |
 |
| Module-wise count rates for Quadrant C Data is divided into 100 sec bins |
 |
 |
| Module-wise count rates for Quadrant D Data is divided into 100 sec bins |
 |
 |
| Parameter | Plot |
|---|---|
| CZT HV Monitor | 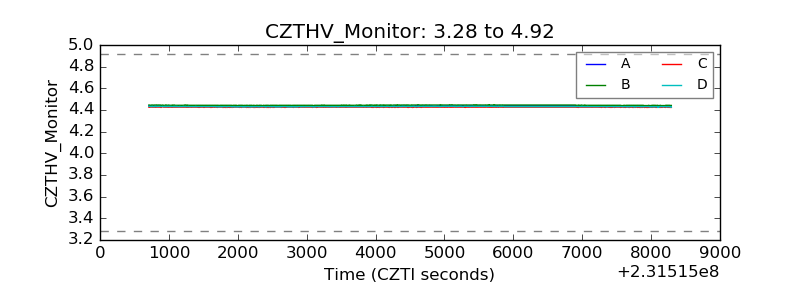 |
| D_VDD | 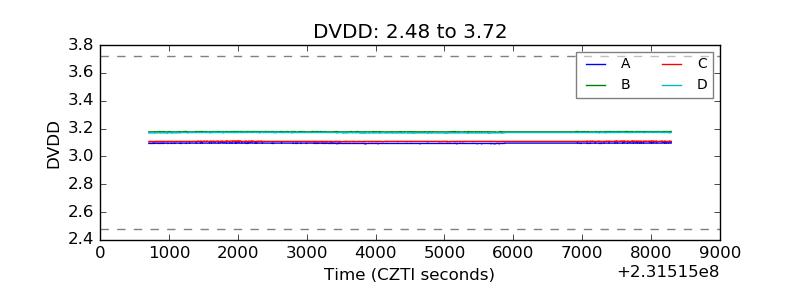 |
| Temperature 1 | 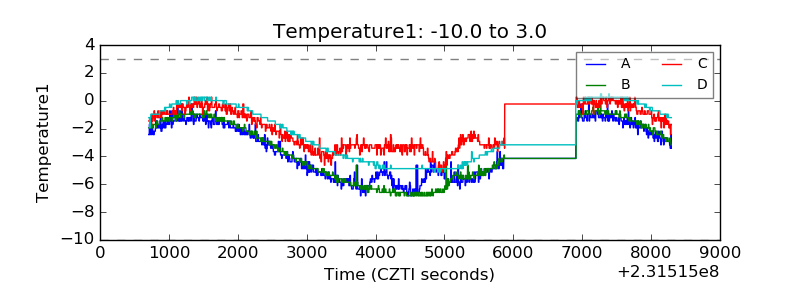 |
| Veto HV Monitor | 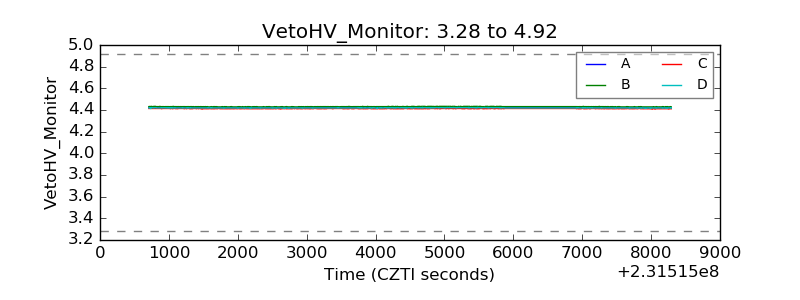 |
| Veto LLD | 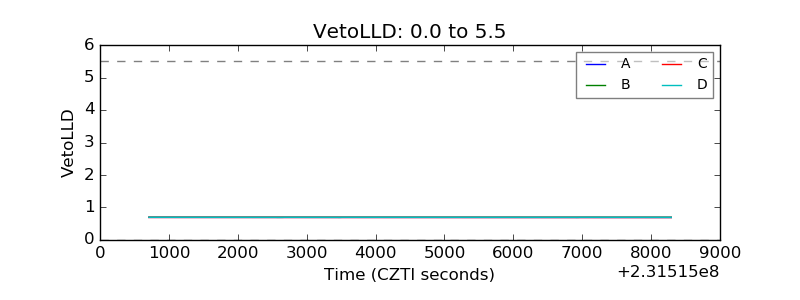 |
| Alpha Counter | 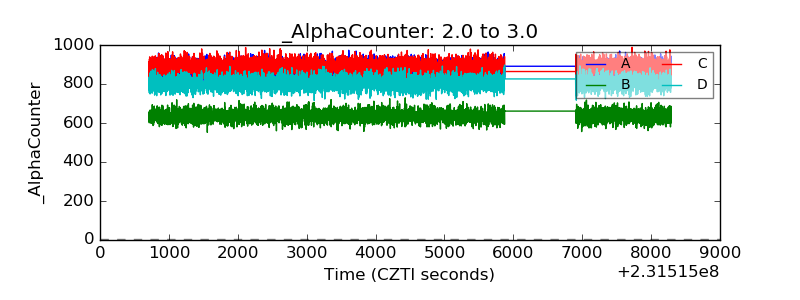 |
| _CPM_Rate | 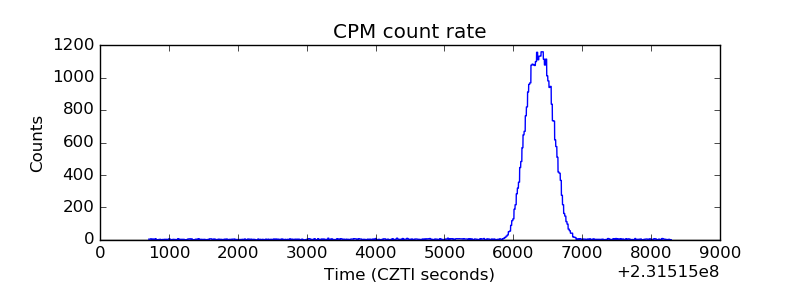 |
| CZT Counter | 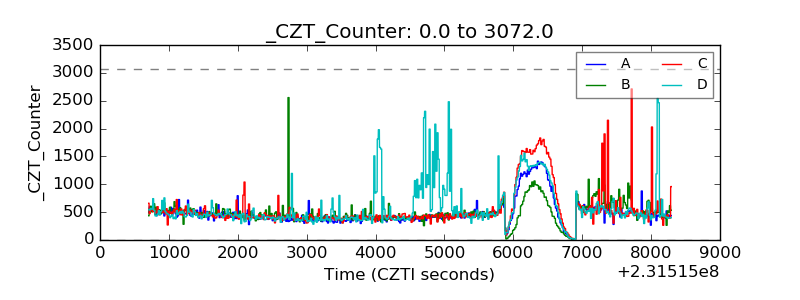 |
| +2.5 Volts monitor |  |
| +5 Volts monitor |  |
| _ROLL_ROT | 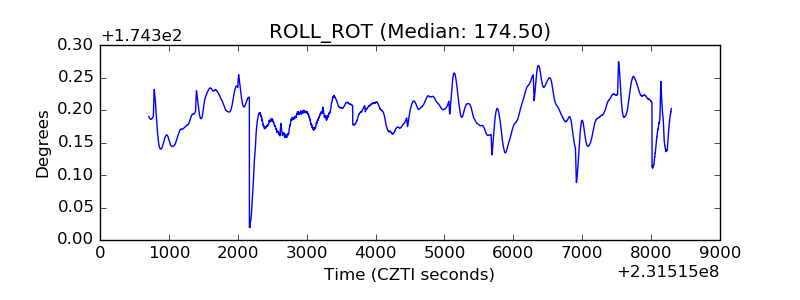 |
| _Roll_DEC | 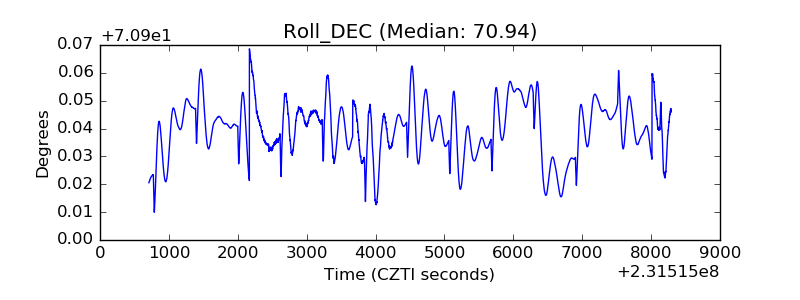 |
| _Roll_RA | 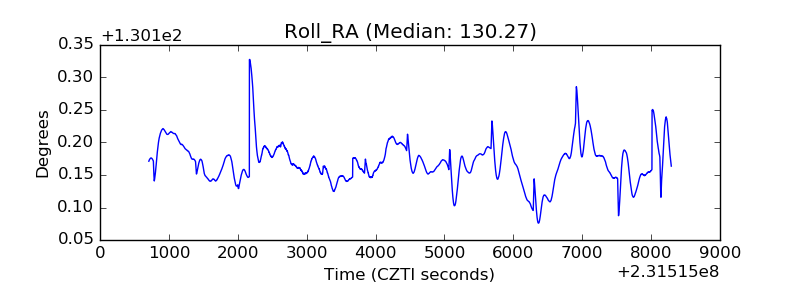 |
| Veto Counter | 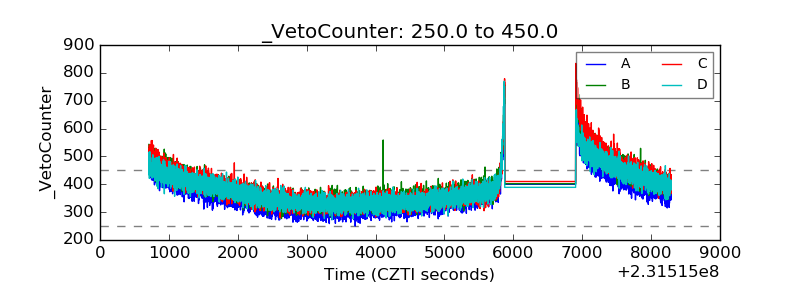 |