| Param | Original file | Final file |
|---|---|---|
| Filename | modeM0/AS1G07_024T01_9000001206_08638cztM0_level2.evt | modeM0/AS1G07_024T01_9000001206_08638cztM0_level2_quad_clean.evt |
| Size (bytes) | 450,702,720 | 121,219,200 |
| Size | 429.8 MB | 115.6 MB |
| Events in quadrant A | 2,920,521 | 809,805 |
| Events in quadrant B | 3,670,500 | 815,758 |
| Events in quadrant C | 3,283,252 | 816,906 |
| Events in quadrant D | 3,338,275 | 780,479 |
| Mode M0 | |||
|---|---|---|---|
| Quadrant | BADHDUFLAG | Total packets | Discarded packets |
| A | 0 | 13280 | 3 |
| B | 0 | 15409 | 2 |
| C | 0 | 14231 | 2 |
| D | 0 | 14562 | 2 |
| Mode M9 | |||
|---|---|---|---|
| Quadrant | BADHDUFLAG | Total packets | Discarded packets |
| A | 0 | 12 | 0 |
| B | 0 | 12 | 0 |
| C | 0 | 12 | 0 |
| D | 0 | 13 | 0 |
| Mode SS | |||
|---|---|---|---|
| Quadrant | BADHDUFLAG | Total packets | Discarded packets |
| A | 0 | 130 | 0 |
| B | 0 | 130 | 0 |
| C | 0 | 130 | 0 |
| D | 0 | 130 | 0 |
| Quadrant | Total seconds | Saturated seconds | Saturation percentage |
|---|---|---|---|
| A | 6427 | 39 | 0.606815% |
| B | 6427 | 211 | 3.283025% |
| C | 6427 | 143 | 2.224988% |
| D | 6427 | 136 | 2.116073% |
Noise dominated data is calculated using 1-second bins in cleaned event files. If a bin has >2000 counts, and if more than 50% of those come from <1% of pixels, then it is considered to be noise-dominated and hence unusable.
| Quadrant | # 1 sec bins | Bins with >0 counts | Bins with >2000 counts | High rate bins dominated by noise | Noise dominated (total time) | Noise dominated (detector-on time) | Marked lightcurve |
|---|---|---|---|---|---|---|---|
| A | 7577 | 6428 | 1 | 1 | 0.01% | 0.02% | 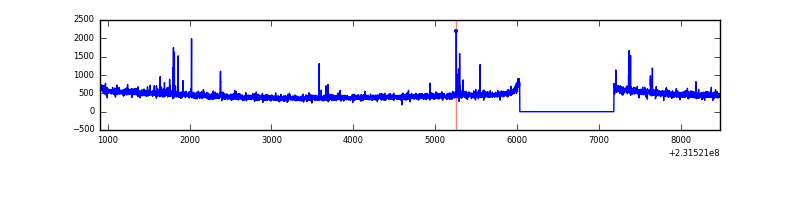 |
| B | 7577 | 6427 | 175 | 175 | 2.31% | 2.72% | 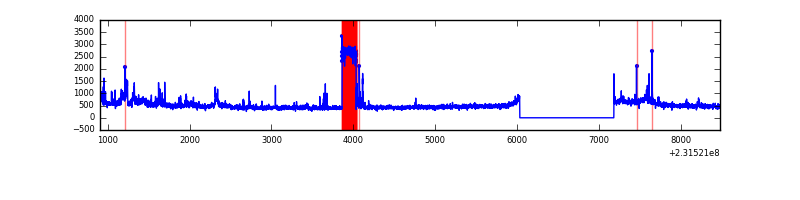 |
| C | 7577 | 6427 | 96 | 96 | 1.27% | 1.49% | 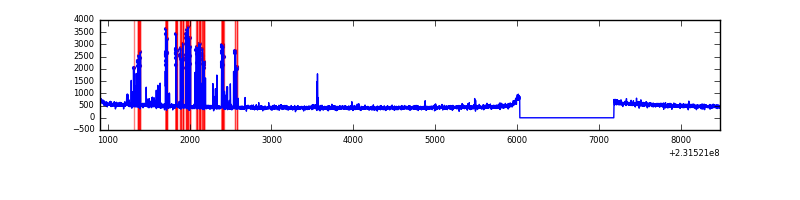 |
| D | 7577 | 6427 | 93 | 93 | 1.23% | 1.45% | 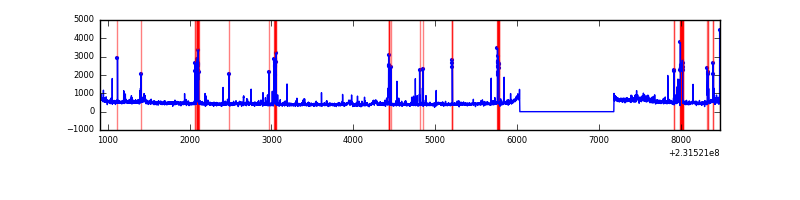 |
Top three noisy pixels from each quadrant. If the there are fewer than three noisy pixels in the level2.evt file, extra rows are filled as -1
| Pixel properties | Quadrant properties | ||||||
|---|---|---|---|---|---|---|---|
| Quadrant | DetID | PixID | Counts | Sigma | Mean | Median | Sigma |
| A | 5 | 16 | 29302 | 189.24 | 745 | 730 | 151.0 |
| A | 13 | 248 | 13223 | 82.74 | 745 | 730 | 151.0 |
| A | 15 | 174 | 10541 | 64.98 | 745 | 730 | 151.0 |
| B | 0 | 228 | 490494 | 3469.07 | 746 | 729 | 141.2 |
| B | 0 | 168 | 80759 | 566.86 | 746 | 729 | 141.2 |
| B | 15 | 255 | 67961 | 476.21 | 746 | 729 | 141.2 |
| C | 8 | 208 | 396317 | 2335.24 | 736 | 739 | 169.4 |
| C | 14 | 67 | 7606 | 40.54 | 736 | 739 | 169.4 |
| C | 13 | 61 | 5797 | 29.86 | 736 | 739 | 169.4 |
| D | 9 | 64 | 151141 | 837.3 | 733 | 708 | 179.7 |
| D | 7 | 71 | 75990 | 419.01 | 733 | 708 | 179.7 |
| D | 2 | 16 | 71809 | 395.74 | 733 | 708 | 179.7 |
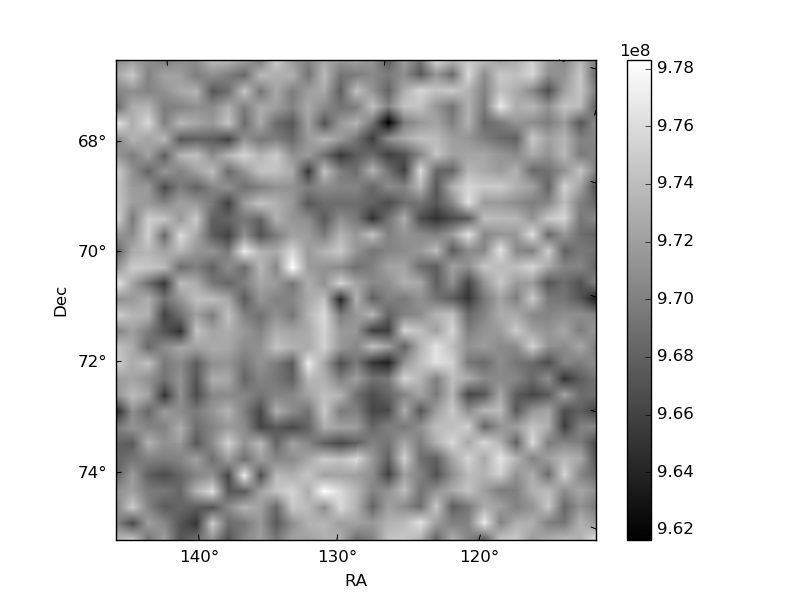
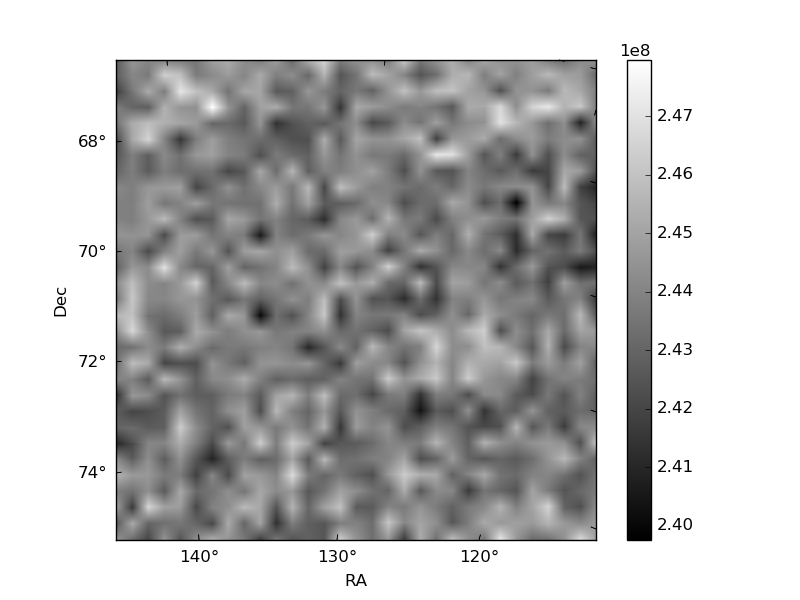
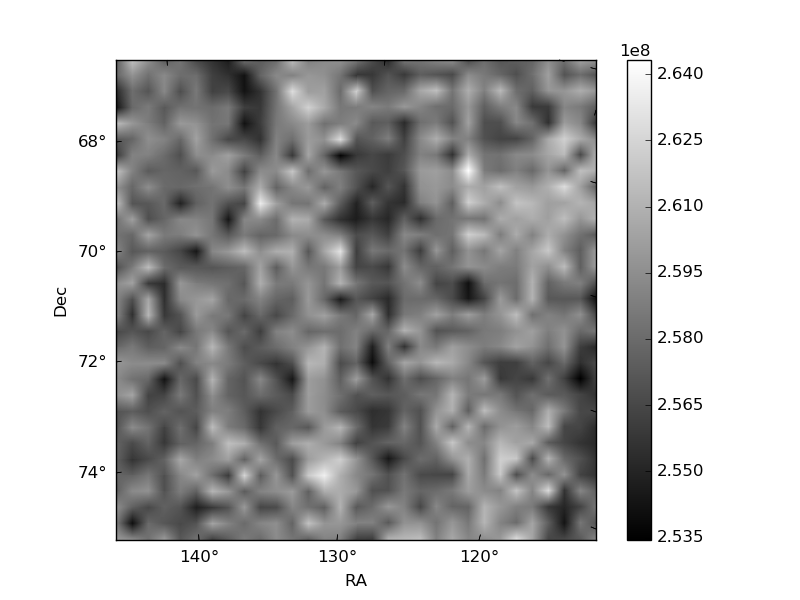
Histogram calculated using DETX and DETY for each event in the final _common_clean file
| Quadrant A | 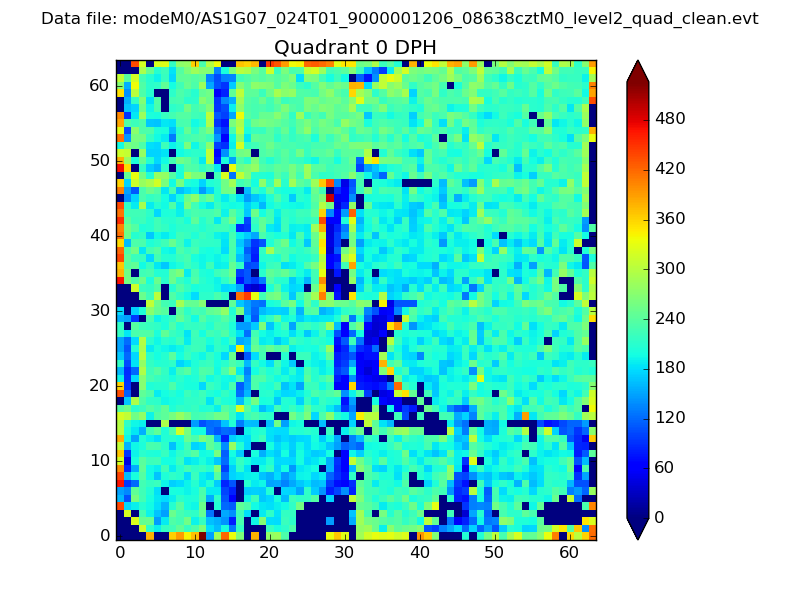 |
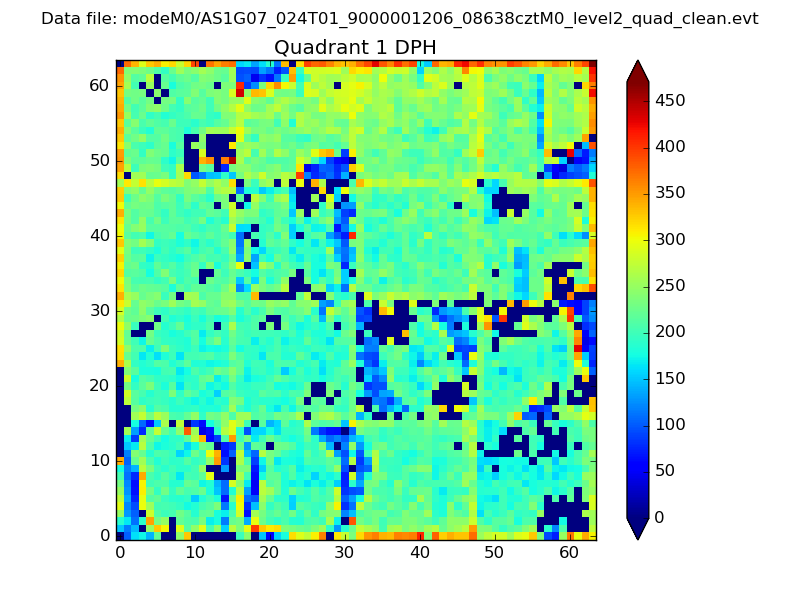 |
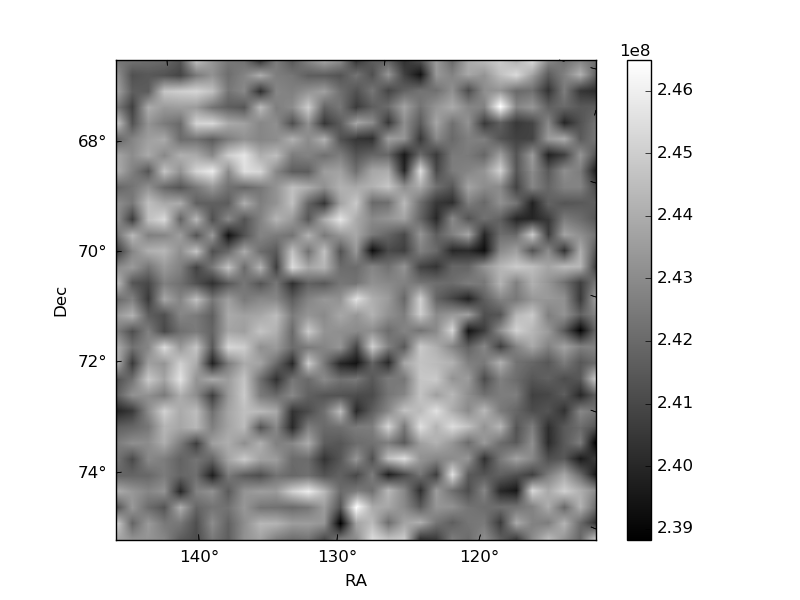
Quadrant B |
|---|---|---|---|
| Quadrant D | 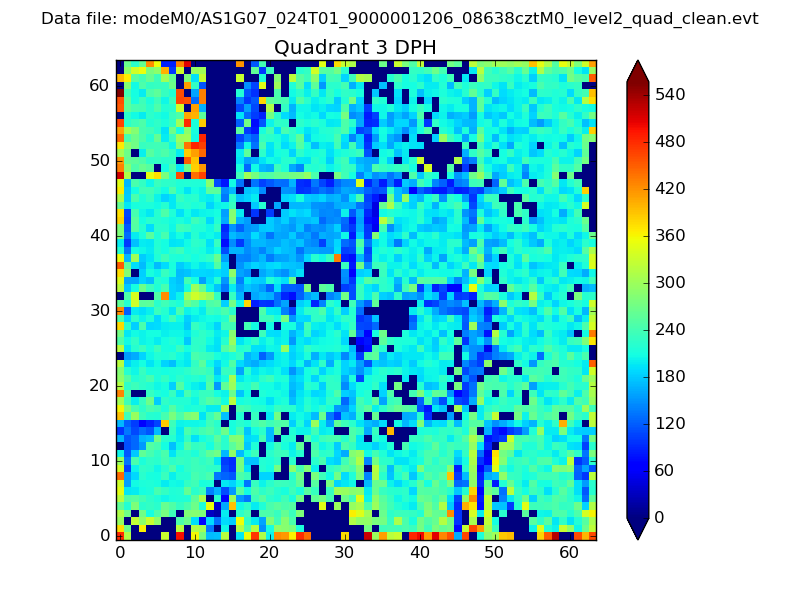 |
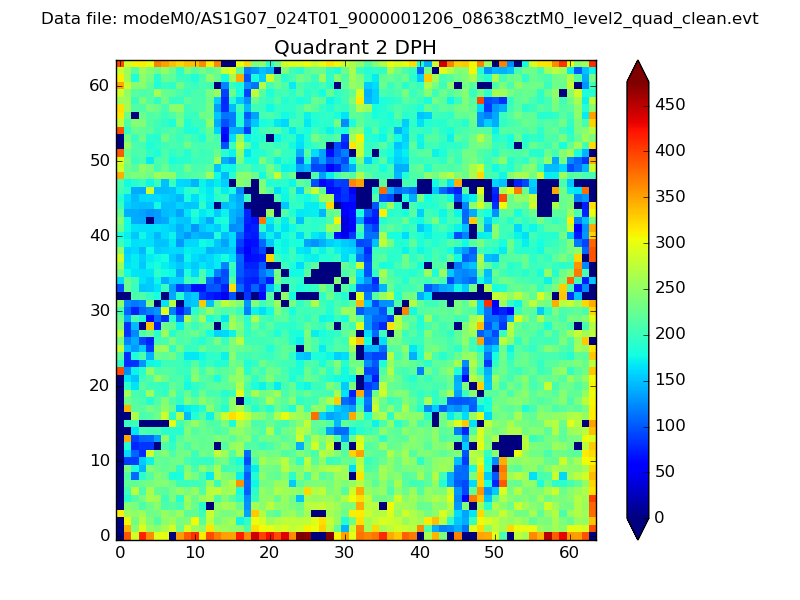 |
Quadrant C |
| Plot type | Count rate plots | Images |
|---|---|---|
| Comparison with Poisson distribution Blue bars denote a histogram of data divided into 1 sec bins. Red curve is a Poisson curve with rate = median count rate of data. |
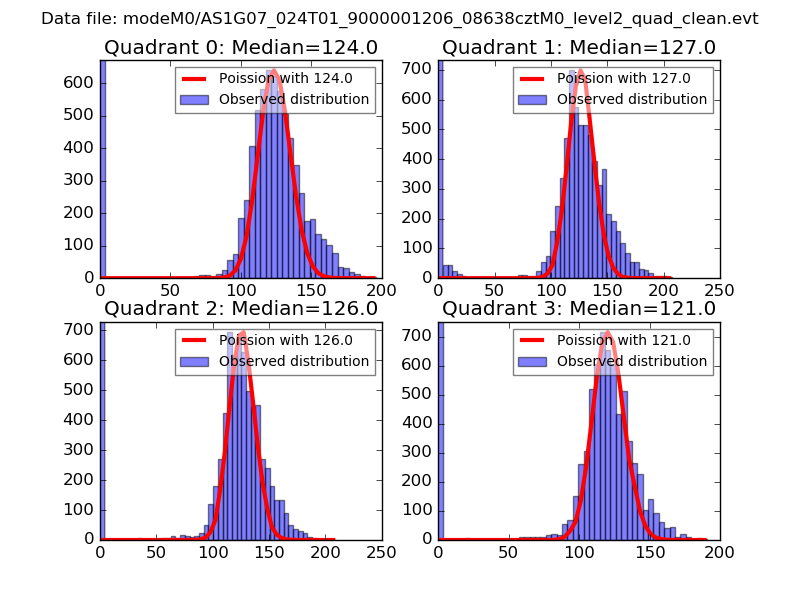 |
 |
| Quadrant-wise count rates Data is divided into 100 sec bins |
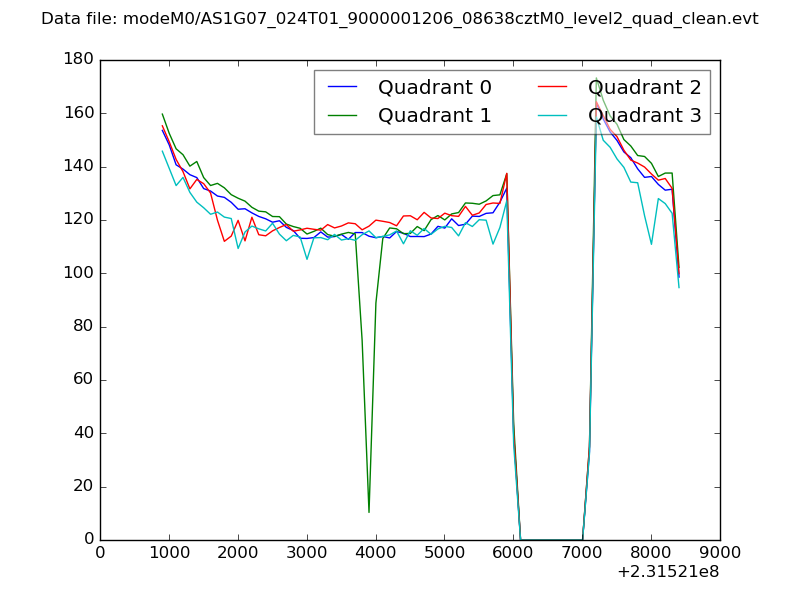 |
|
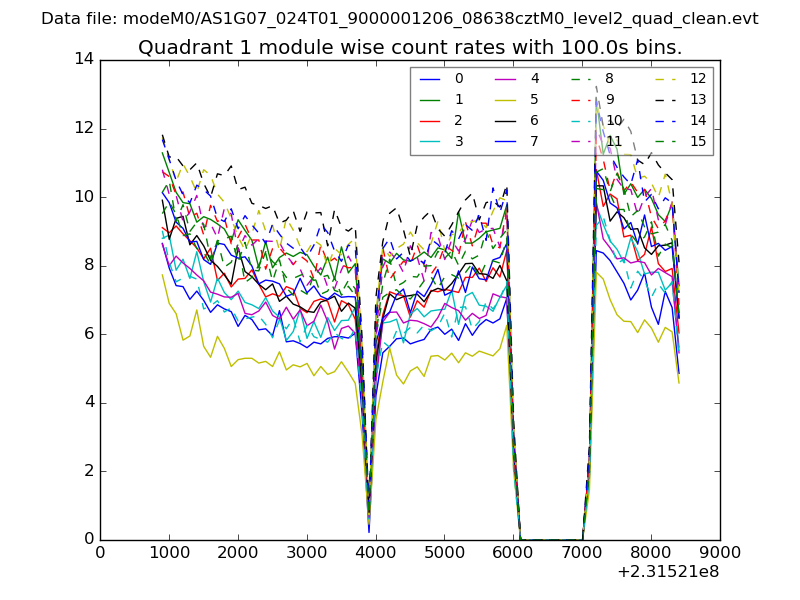
| Module-wise count rates for Quadrant A Data is divided into 100 sec bins |
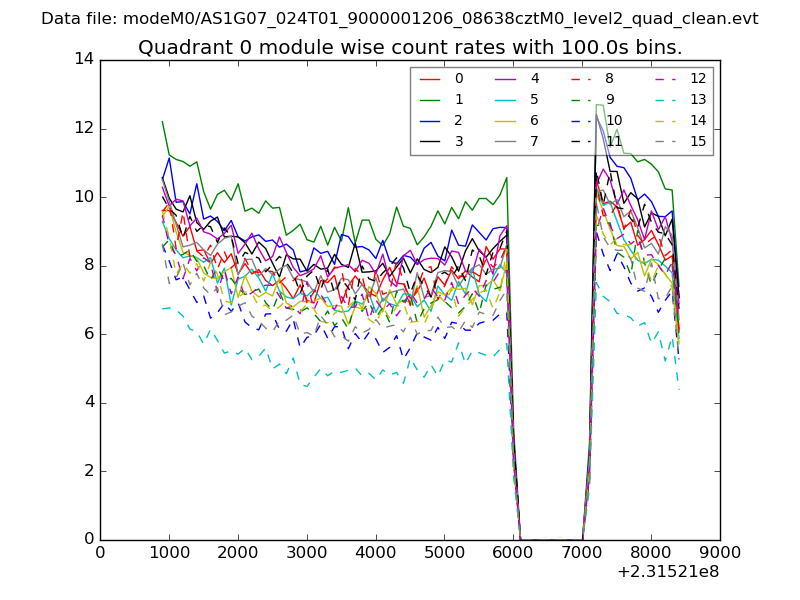 |
 |
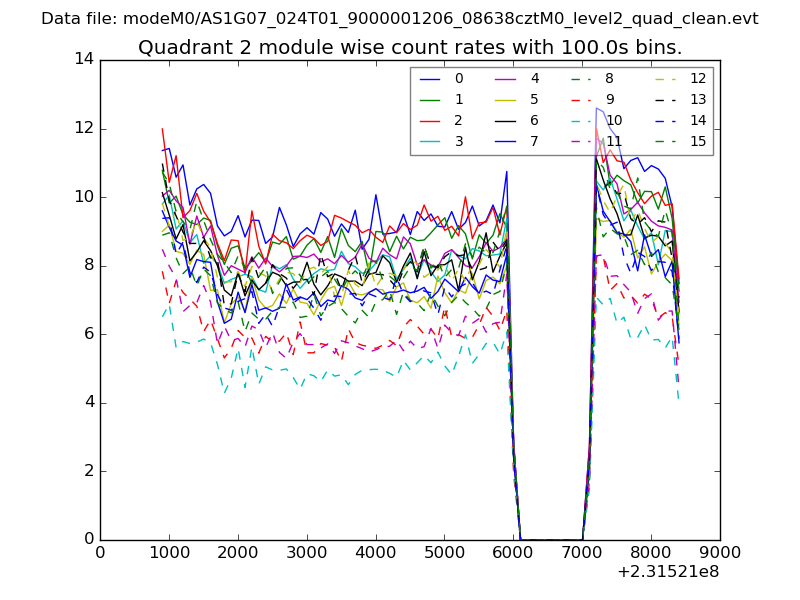
| Module-wise count rates for Quadrant B Data is divided into 100 sec bins |
 |
 |
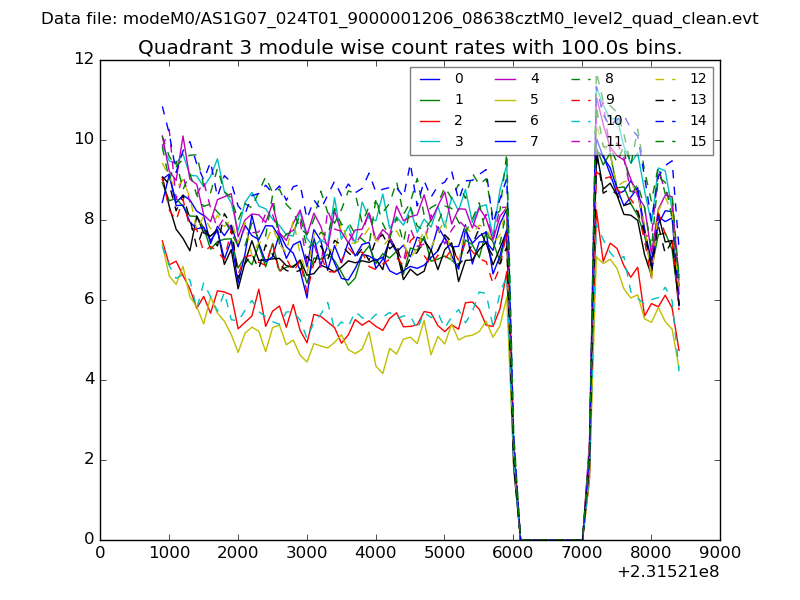
| Module-wise count rates for Quadrant C Data is divided into 100 sec bins |
 |
 |
| Module-wise count rates for Quadrant D Data is divided into 100 sec bins |
 |
 |
| Parameter | Plot |
|---|---|
| CZT HV Monitor | 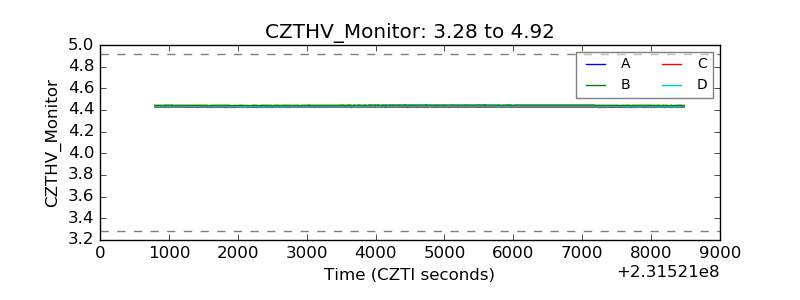 |
| D_VDD | 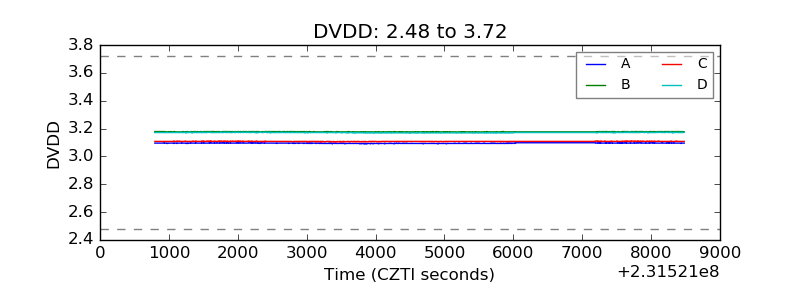 |
| Temperature 1 | 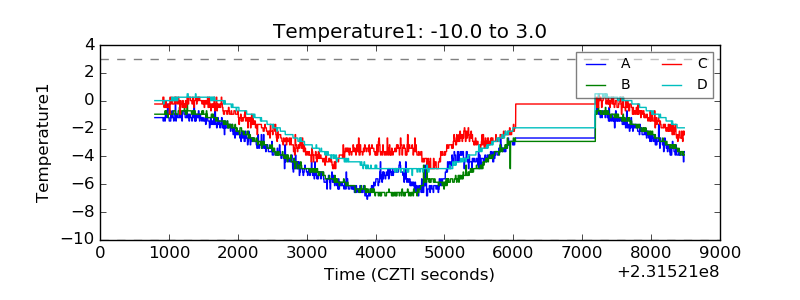 |
| Veto HV Monitor | 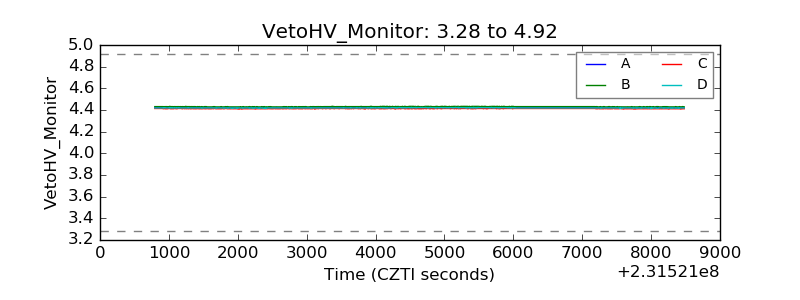 |
| Veto LLD | 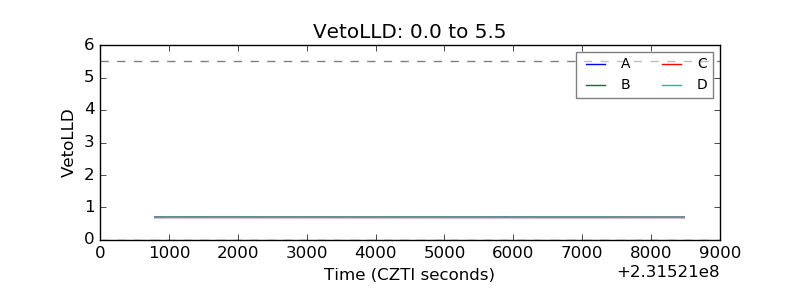 |
| Alpha Counter | 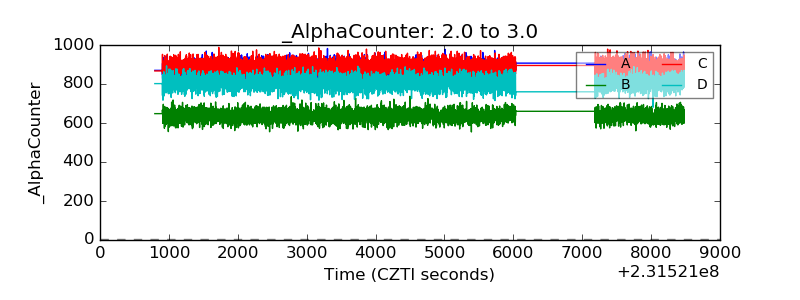 |
| _CPM_Rate | 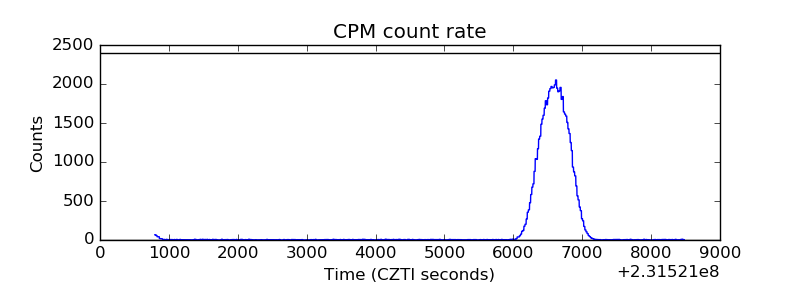 |
| CZT Counter | 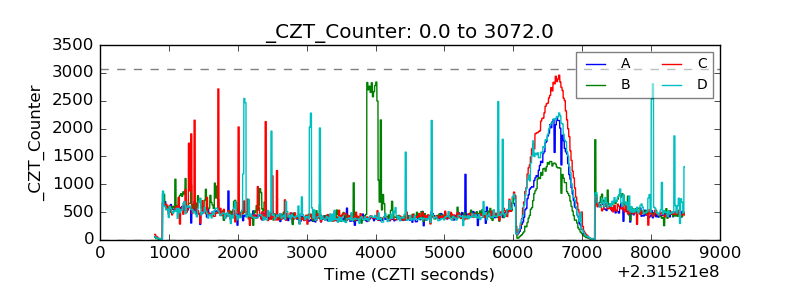 |
| +2.5 Volts monitor |  |
| +5 Volts monitor |  |
| _ROLL_ROT | 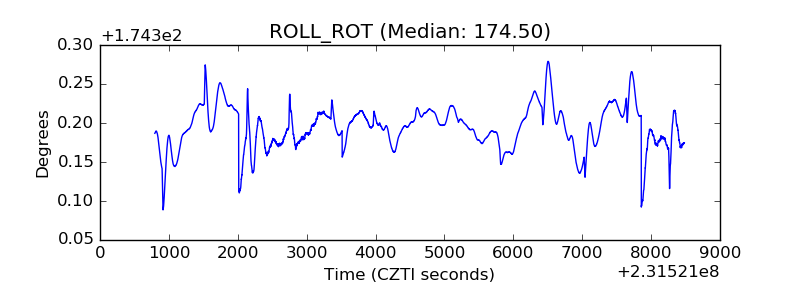 |
| _Roll_DEC | 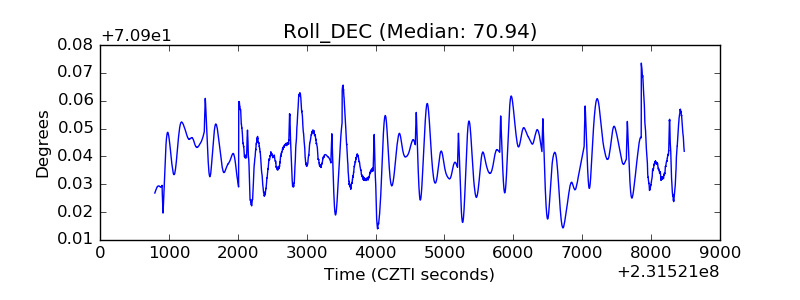 |
| _Roll_RA | 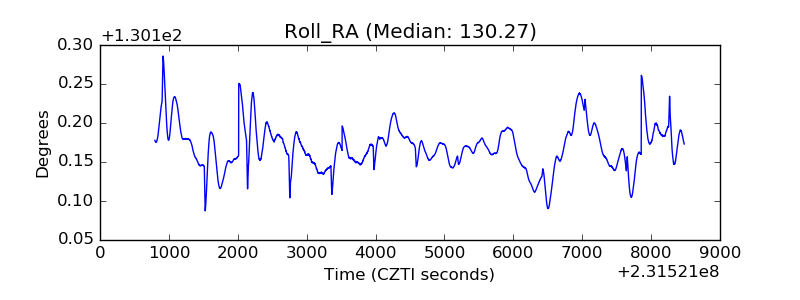 |
| Veto Counter | 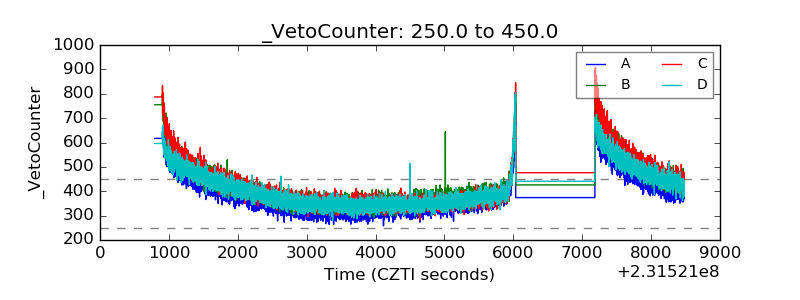 |