| Param | Original file | Final file |
|---|---|---|
| Filename | modeM0/AS1G07_024T01_9000001206_08639cztM0_level2.evt | modeM0/AS1G07_024T01_9000001206_08639cztM0_level2_quad_clean.evt |
| Size (bytes) | 411,050,880 | 121,415,040 |
| Size | 392.0 MB | 115.8 MB |
| Events in quadrant A | 2,847,679 | 803,104 |
| Events in quadrant B | 3,031,246 | 836,109 |
| Events in quadrant C | 2,862,529 | 826,711 |
| Events in quadrant D | 3,287,118 | 780,314 |
| Mode M0 | |||
|---|---|---|---|
| Quadrant | BADHDUFLAG | Total packets | Discarded packets |
| A | 0 | 12827 | 3 |
| B | 0 | 13298 | 2 |
| C | 0 | 12746 | 2 |
| D | 0 | 14201 | 2 |
| Mode M9 | |||
|---|---|---|---|
| Quadrant | BADHDUFLAG | Total packets | Discarded packets |
| A | 0 | 15 | 0 |
| B | 0 | 15 | 0 |
| C | 0 | 15 | 0 |
| D | 0 | 16 | 0 |
| Mode SS | |||
|---|---|---|---|
| Quadrant | BADHDUFLAG | Total packets | Discarded packets |
| A | 0 | 126 | 0 |
| B | 0 | 126 | 0 |
| C | 0 | 126 | 0 |
| D | 0 | 126 | 0 |
| Quadrant | Total seconds | Saturated seconds | Saturation percentage |
|---|---|---|---|
| A | 6176 | 18 | 0.291451% |
| B | 6176 | 19 | 0.307642% |
| C | 6176 | 11 | 0.178109% |
| D | 6176 | 76 | 1.230570% |
Noise dominated data is calculated using 1-second bins in cleaned event files. If a bin has >2000 counts, and if more than 50% of those come from <1% of pixels, then it is considered to be noise-dominated and hence unusable.
| Quadrant | # 1 sec bins | Bins with >0 counts | Bins with >2000 counts | High rate bins dominated by noise | Noise dominated (total time) | Noise dominated (detector-on time) | Marked lightcurve |
|---|---|---|---|---|---|---|---|
| A | 7436 | 6177 | 10 | 10 | 0.13% | 0.16% | 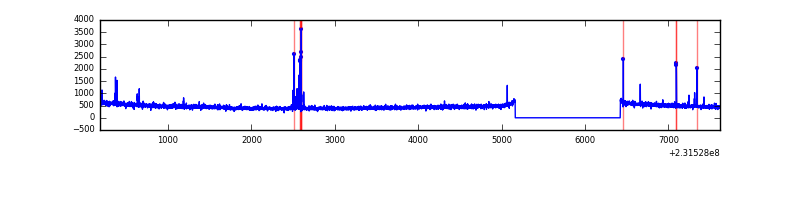 |
| B | 7436 | 6177 | 8 | 8 | 0.11% | 0.13% | 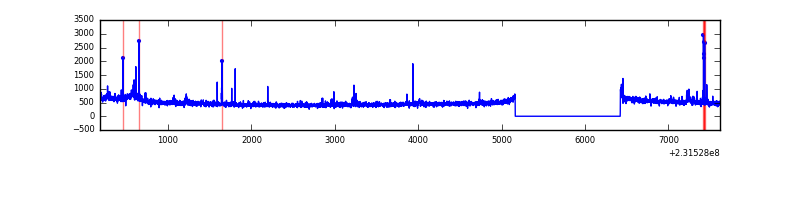 |
| C | 7436 | 6177 | 0 | 0 | 0.00% | 0.00% | 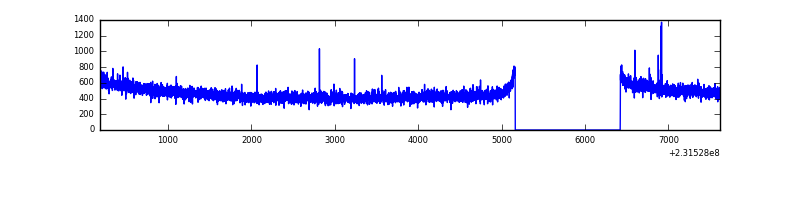 |
| D | 7436 | 6177 | 61 | 61 | 0.82% | 0.99% | 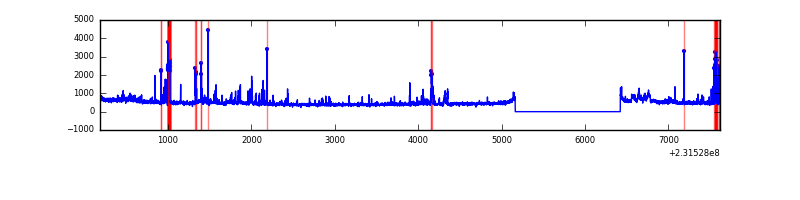 |
Top three noisy pixels from each quadrant. If the there are fewer than three noisy pixels in the level2.evt file, extra rows are filled as -1
| Pixel properties | Quadrant properties | ||||||
|---|---|---|---|---|---|---|---|
| Quadrant | DetID | PixID | Counts | Sigma | Mean | Median | Sigma |
| A | 13 | 248 | 32785 | 220.16 | 722 | 705 | 145.7 |
| A | 5 | 16 | 29372 | 196.74 | 722 | 705 | 145.7 |
| A | 0 | 226 | 6914 | 42.61 | 722 | 705 | 145.7 |
| B | 0 | 168 | 61052 | 437.91 | 740 | 722 | 137.8 |
| B | 0 | 219 | 26149 | 184.56 | 740 | 722 | 137.8 |
| B | 4 | 80 | 24117 | 169.81 | 740 | 722 | 137.8 |
| C | 8 | 208 | 38413 | 229.67 | 722 | 726 | 164.1 |
| C | 13 | 61 | 5582 | 29.59 | 722 | 726 | 164.1 |
| C | 8 | 222 | 2487 | 10.73 | 722 | 726 | 164.1 |
| D | 2 | 16 | 112629 | 647.02 | 713 | 691 | 173.0 |
| D | 9 | 64 | 98023 | 562.6 | 713 | 691 | 173.0 |
| D | 7 | 71 | 92368 | 529.91 | 713 | 691 | 173.0 |
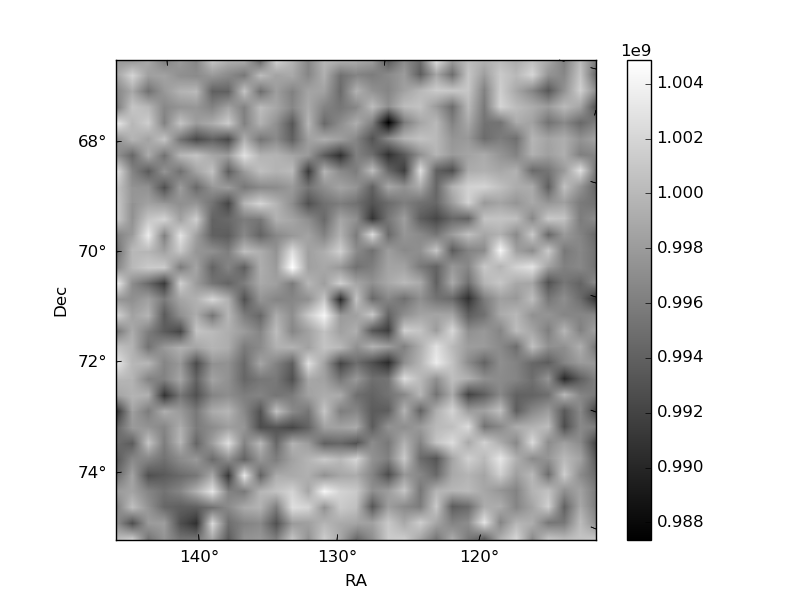
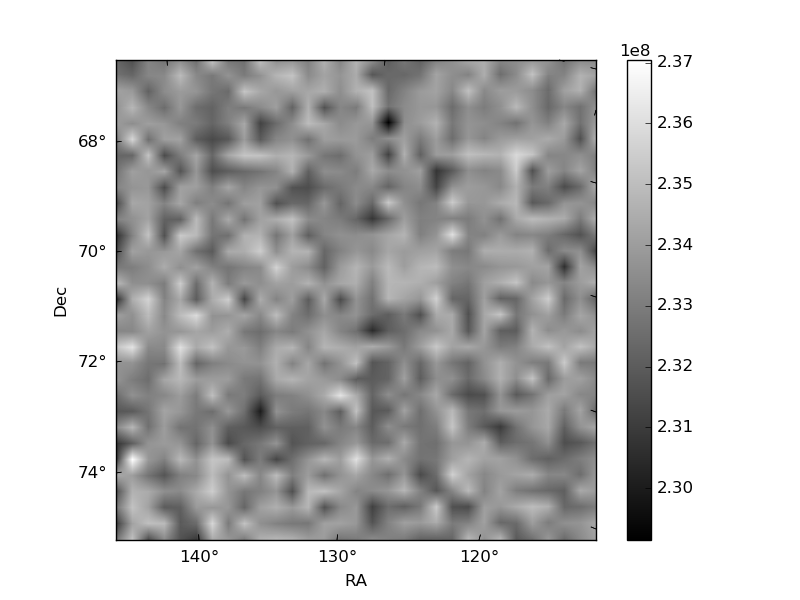
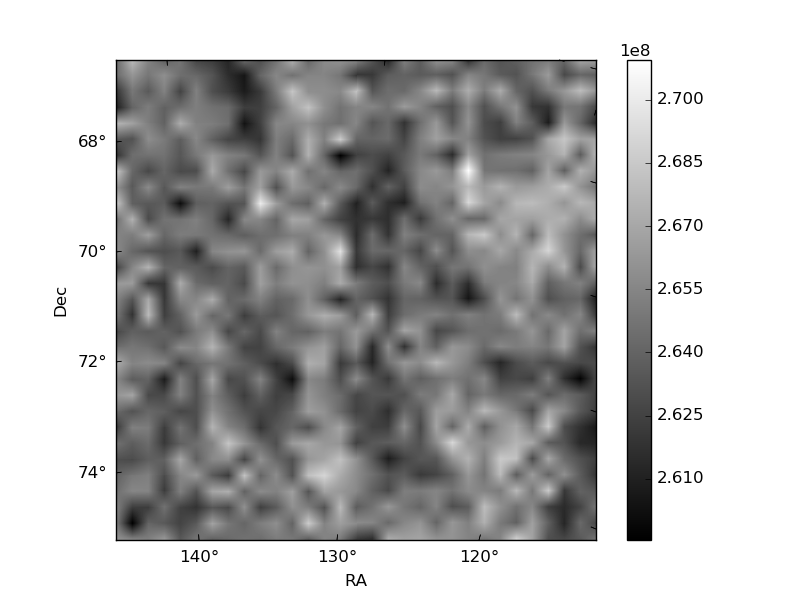
Histogram calculated using DETX and DETY for each event in the final _common_clean file
| Quadrant A | 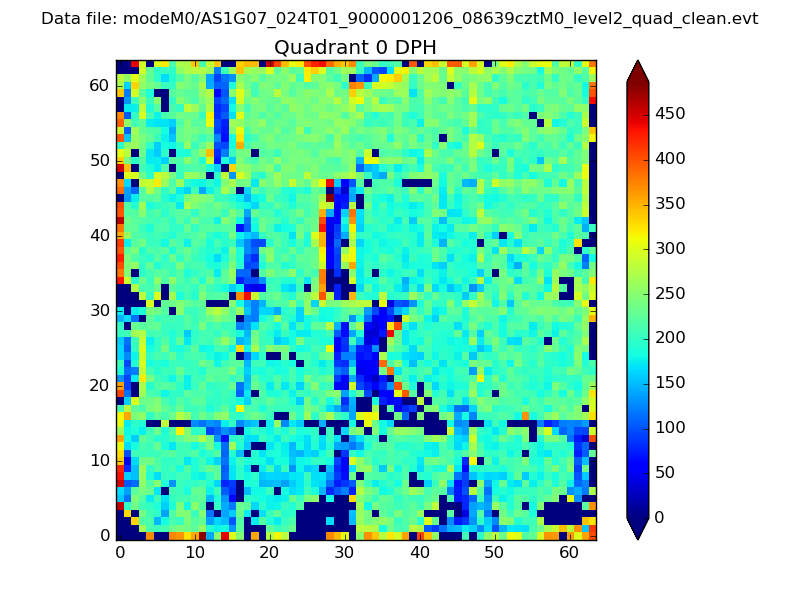 |
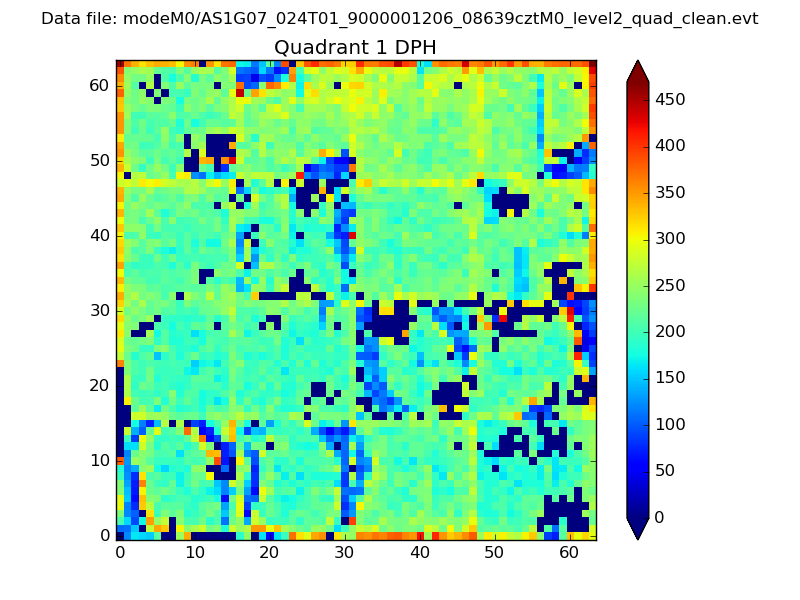 |
Quadrant B |
|---|---|---|---|
| Quadrant D | 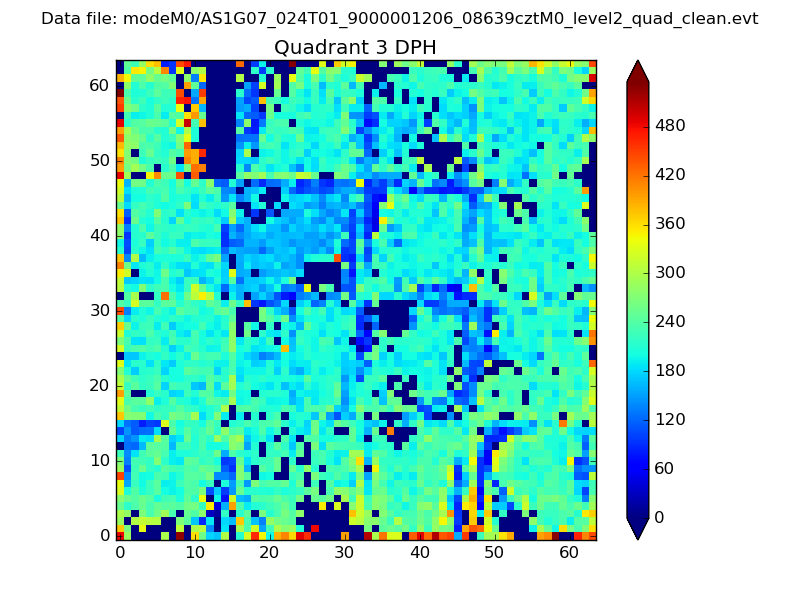 |
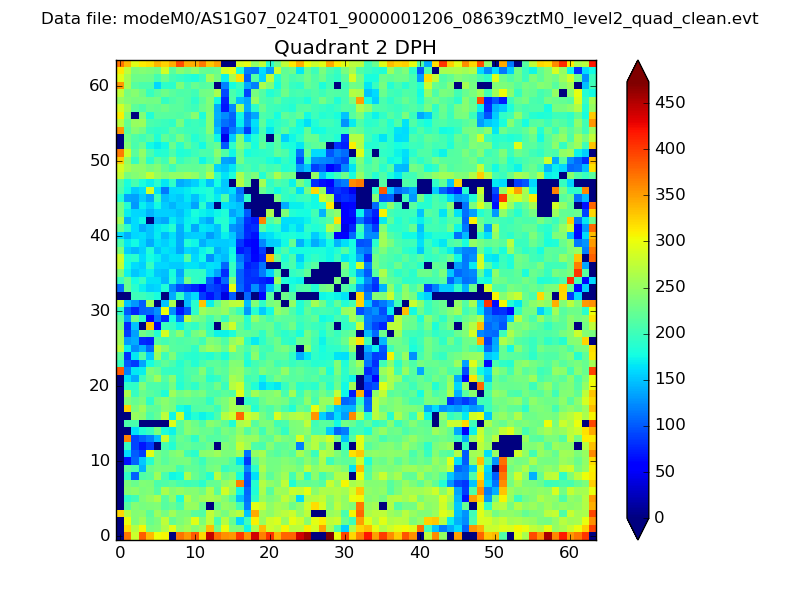 |
Quadrant C |
| Plot type | Count rate plots | Images |
|---|---|---|
| Comparison with Poisson distribution Blue bars denote a histogram of data divided into 1 sec bins. Red curve is a Poisson curve with rate = median count rate of data. |
 |
 |
| Quadrant-wise count rates Data is divided into 100 sec bins |
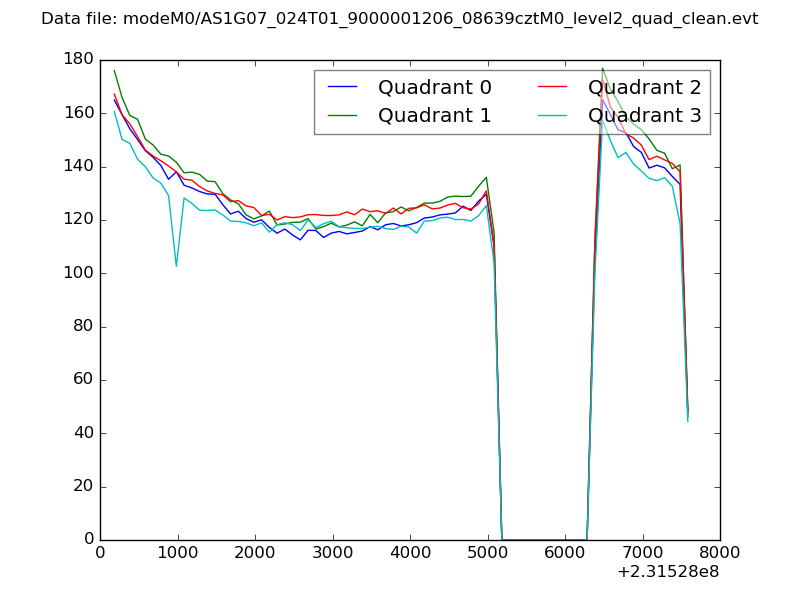 |
|
| Module-wise count rates for Quadrant A Data is divided into 100 sec bins |
 |
 |
| Module-wise count rates for Quadrant B Data is divided into 100 sec bins |
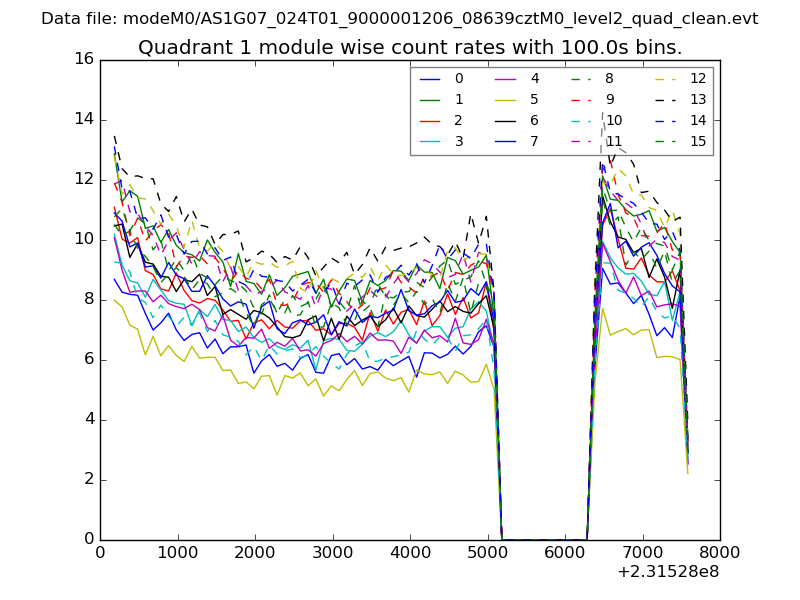 |
 |
| Module-wise count rates for Quadrant C Data is divided into 100 sec bins |
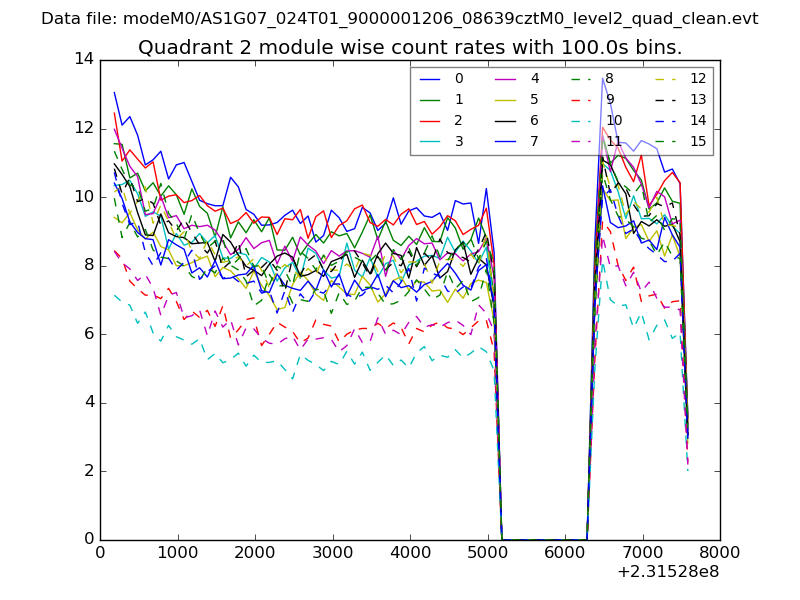 |
 |
| Module-wise count rates for Quadrant D Data is divided into 100 sec bins |
 |
 |
| Parameter | Plot |
|---|---|
| CZT HV Monitor | 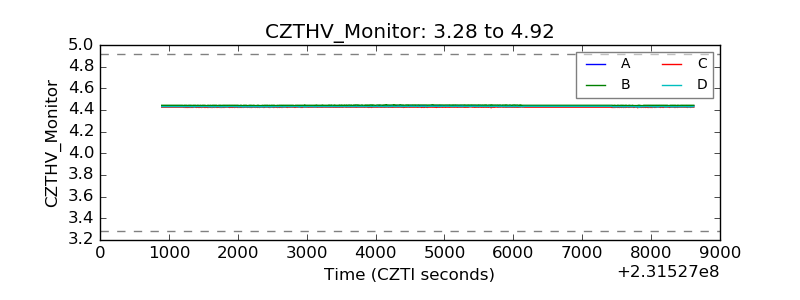 |
| D_VDD | 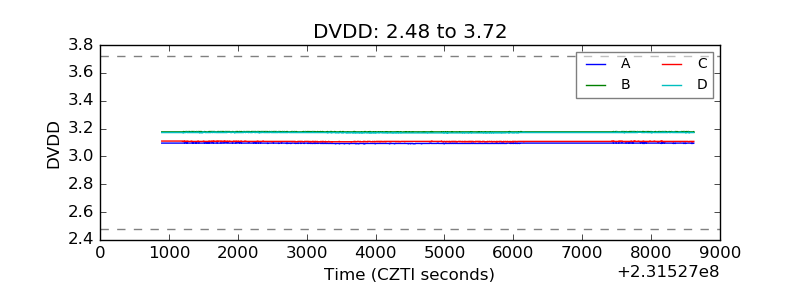 |
| Temperature 1 | 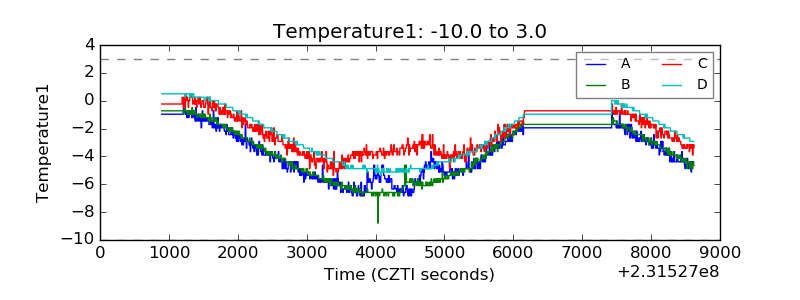 |
| Veto HV Monitor | 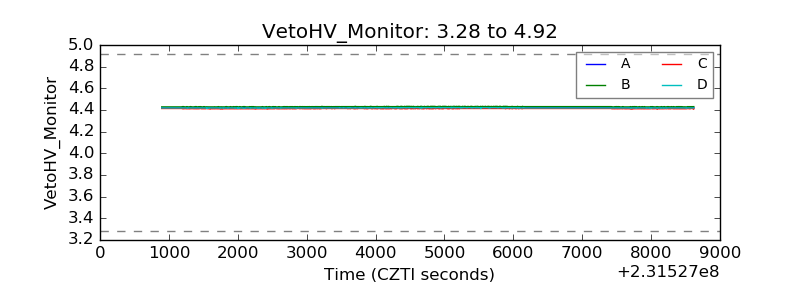 |
| Veto LLD | 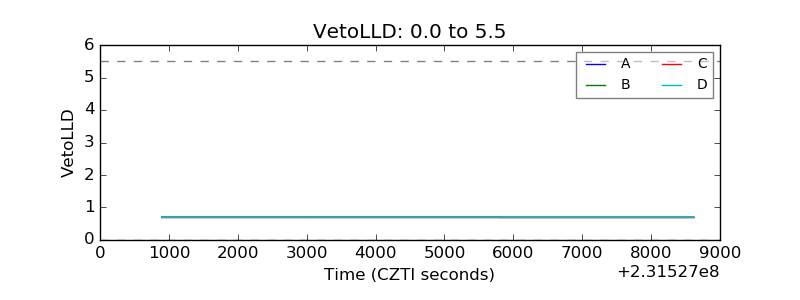 |
| Alpha Counter | 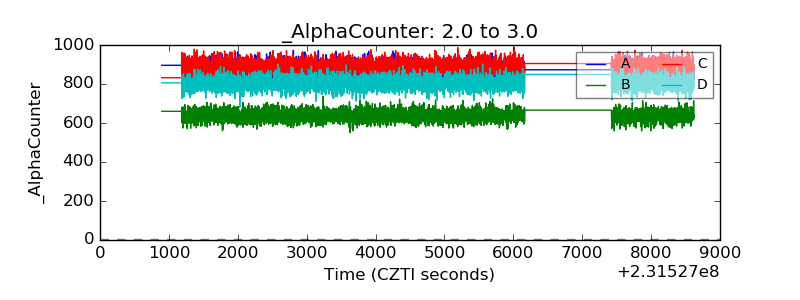 |
| _CPM_Rate | 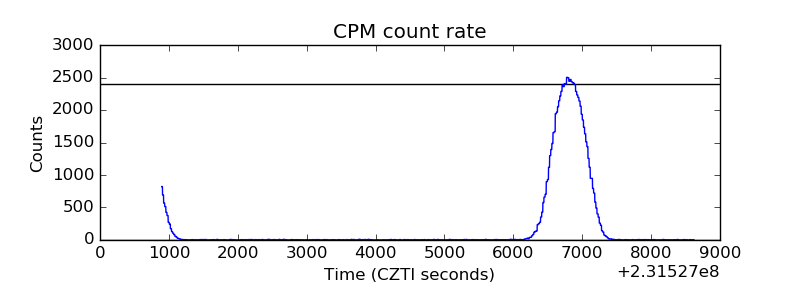 |
| CZT Counter | 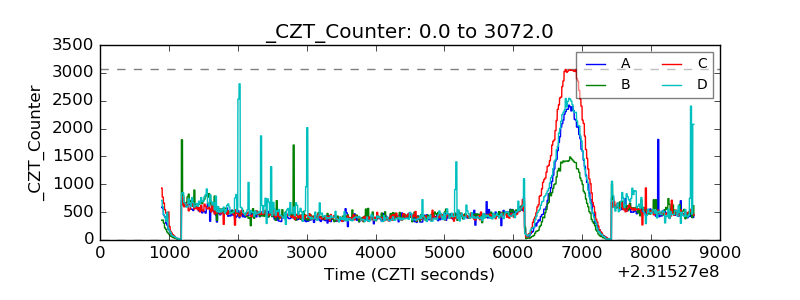 |
| +2.5 Volts monitor |  |
| +5 Volts monitor | 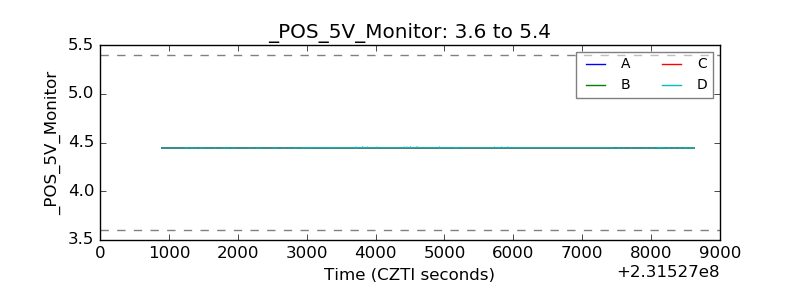 |
| _ROLL_ROT |  |
| _Roll_DEC | 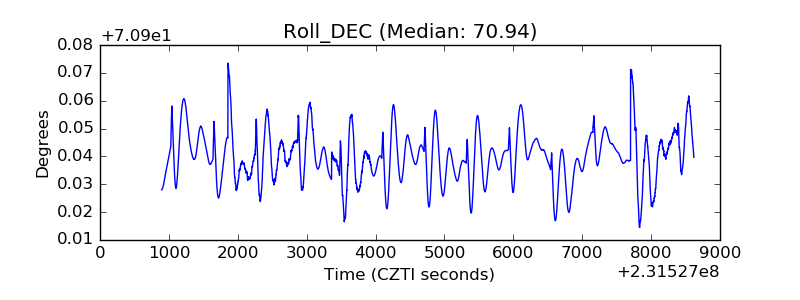 |
| _Roll_RA | 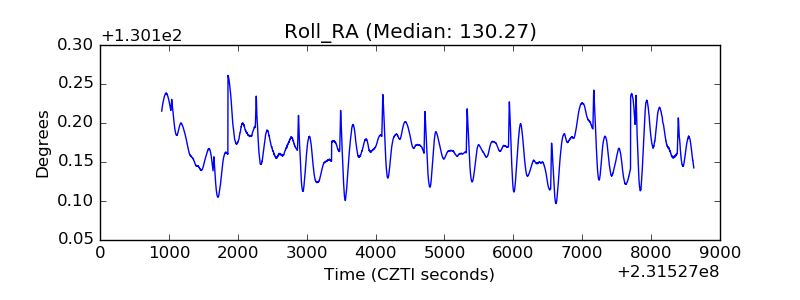 |
| Veto Counter | 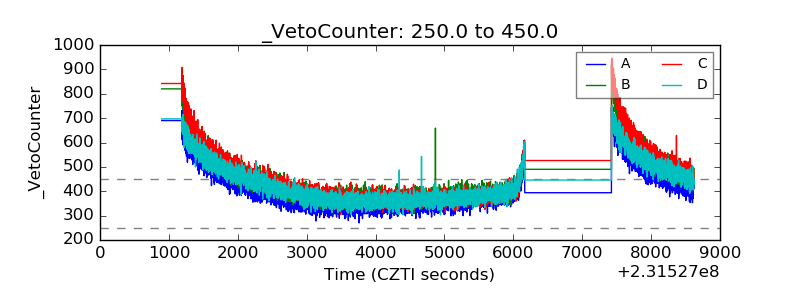 |