| Param | Original file | Final file |
|---|---|---|
| Filename | modeM0/AS1G07_024T01_9000001206_08640cztM0_level2.evt | modeM0/AS1G07_024T01_9000001206_08640cztM0_level2_quad_clean.evt |
| Size (bytes) | 415,598,400 | 125,012,160 |
| Size | 396.3 MB | 119.2 MB |
| Events in quadrant A | 2,871,648 | 828,011 |
| Events in quadrant B | 3,130,499 | 861,865 |
| Events in quadrant C | 2,907,795 | 857,517 |
| Events in quadrant D | 3,248,583 | 800,257 |
| Mode M0 | |||
|---|---|---|---|
| Quadrant | BADHDUFLAG | Total packets | Discarded packets |
| A | 0 | 12945 | 3 |
| B | 0 | 13482 | 2 |
| C | 0 | 12936 | 2 |
| D | 0 | 14219 | 2 |
| Mode M9 | |||
|---|---|---|---|
| Quadrant | BADHDUFLAG | Total packets | Discarded packets |
| A | 0 | 17 | 0 |
| B | 0 | 17 | 0 |
| C | 0 | 17 | 0 |
| D | 0 | 18 | 0 |
| Mode SS | |||
|---|---|---|---|
| Quadrant | BADHDUFLAG | Total packets | Discarded packets |
| A | 0 | 128 | 0 |
| B | 0 | 128 | 0 |
| C | 0 | 128 | 0 |
| D | 0 | 128 | 0 |
| Quadrant | Total seconds | Saturated seconds | Saturation percentage |
|---|---|---|---|
| A | 6288 | 17 | 0.270356% |
| B | 6288 | 29 | 0.461196% |
| C | 6288 | 11 | 0.174936% |
| D | 6288 | 109 | 1.733461% |
Noise dominated data is calculated using 1-second bins in cleaned event files. If a bin has >2000 counts, and if more than 50% of those come from <1% of pixels, then it is considered to be noise-dominated and hence unusable.
| Quadrant | # 1 sec bins | Bins with >0 counts | Bins with >2000 counts | High rate bins dominated by noise | Noise dominated (total time) | Noise dominated (detector-on time) | Marked lightcurve |
|---|---|---|---|---|---|---|---|
| A | 7598 | 6289 | 5 | 5 | 0.07% | 0.08% | 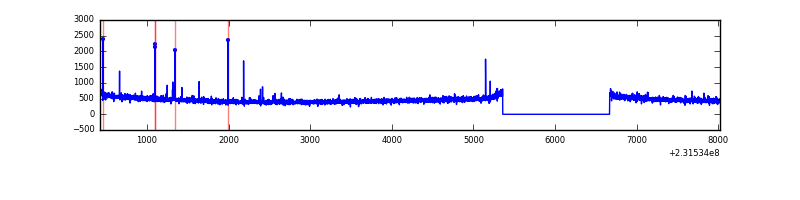 |
| B | 7598 | 6288 | 6 | 6 | 0.08% | 0.10% | 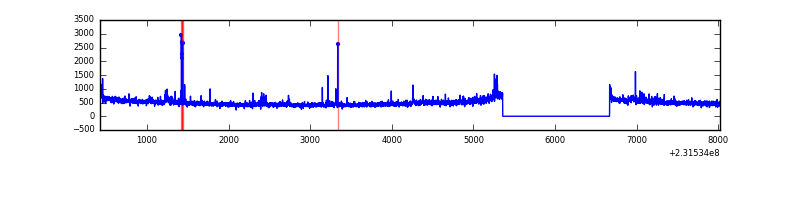 |
| C | 7598 | 6289 | 0 | 0 | 0.00% | 0.00% | 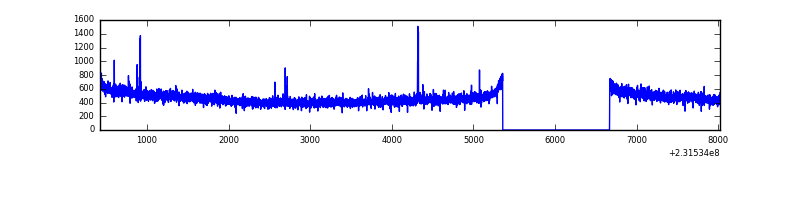 |
| D | 7598 | 6289 | 90 | 90 | 1.18% | 1.43% | 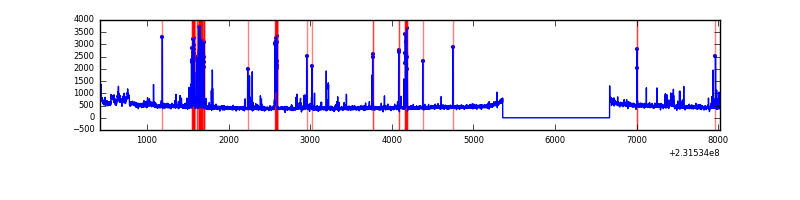 |
Top three noisy pixels from each quadrant. If the there are fewer than three noisy pixels in the level2.evt file, extra rows are filled as -1
| Pixel properties | Quadrant properties | ||||||
|---|---|---|---|---|---|---|---|
| Quadrant | DetID | PixID | Counts | Sigma | Mean | Median | Sigma |
| A | 5 | 16 | 18776 | 122.16 | 735 | 720 | 147.8 |
| A | 15 | 174 | 12554 | 80.06 | 735 | 720 | 147.8 |
| A | 0 | 226 | 7139 | 43.43 | 735 | 720 | 147.8 |
| B | 0 | 219 | 100607 | 714.53 | 756 | 740 | 139.8 |
| B | 0 | 214 | 25749 | 178.93 | 756 | 740 | 139.8 |
| B | 4 | 80 | 22082 | 152.7 | 756 | 740 | 139.8 |
| C | 12 | 4 | 13876 | 77.37 | 740 | 744 | 169.7 |
| C | 8 | 208 | 6446 | 33.6 | 740 | 744 | 169.7 |
| C | 13 | 61 | 5656 | 28.94 | 740 | 744 | 169.7 |
| D | 10 | 253 | 190518 | 1078.35 | 722 | 700 | 176.0 |
| D | 13 | 29 | 89048 | 501.9 | 722 | 700 | 176.0 |
| D | 7 | 71 | 86651 | 488.28 | 722 | 700 | 176.0 |
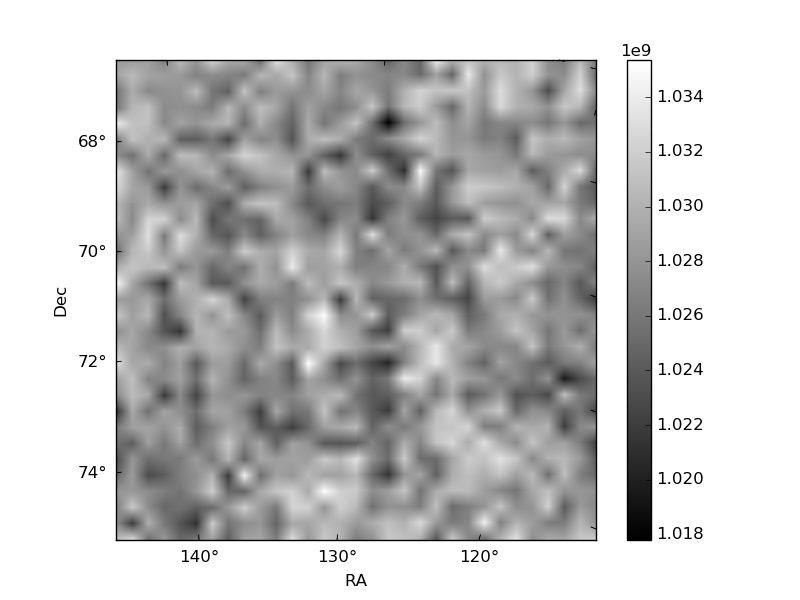
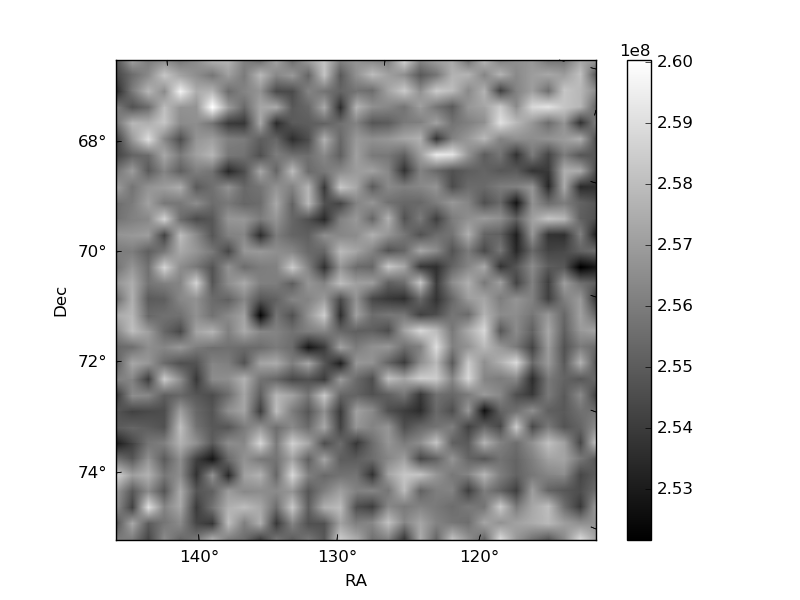
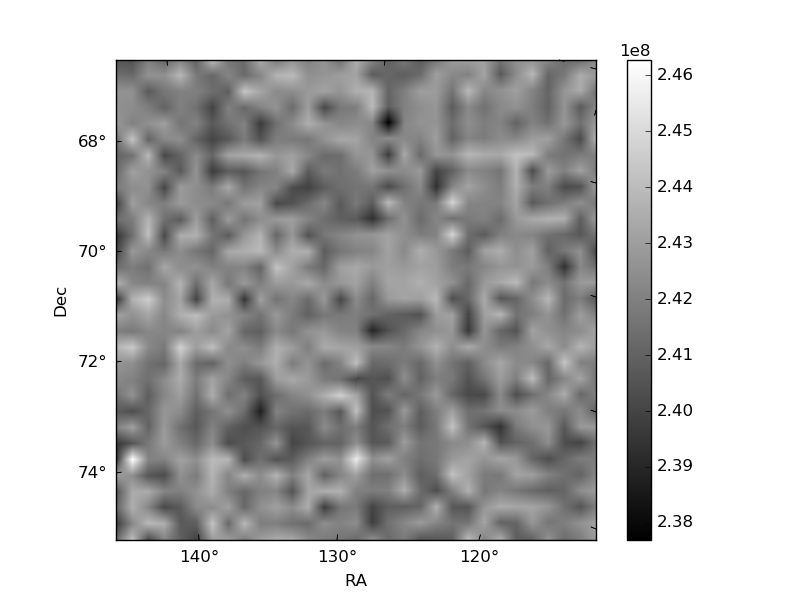
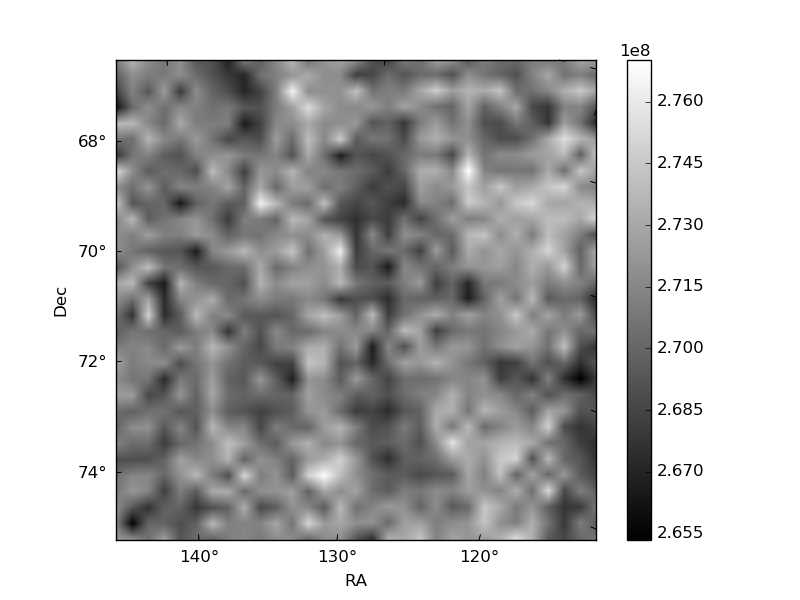
Histogram calculated using DETX and DETY for each event in the final _common_clean file
| Quadrant A | 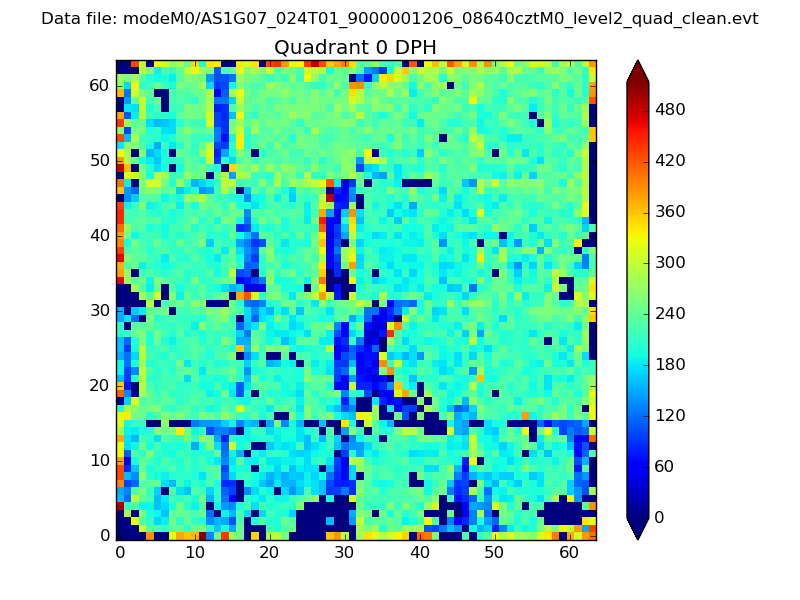 |
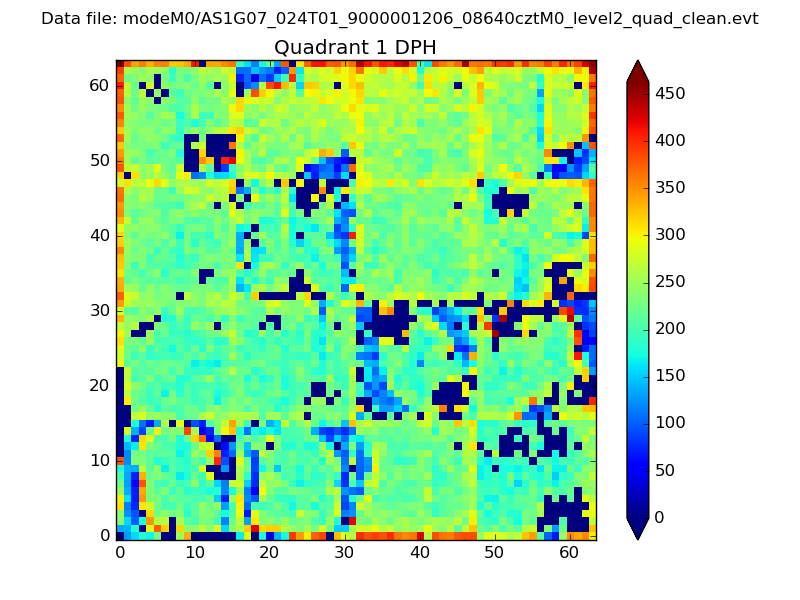 |
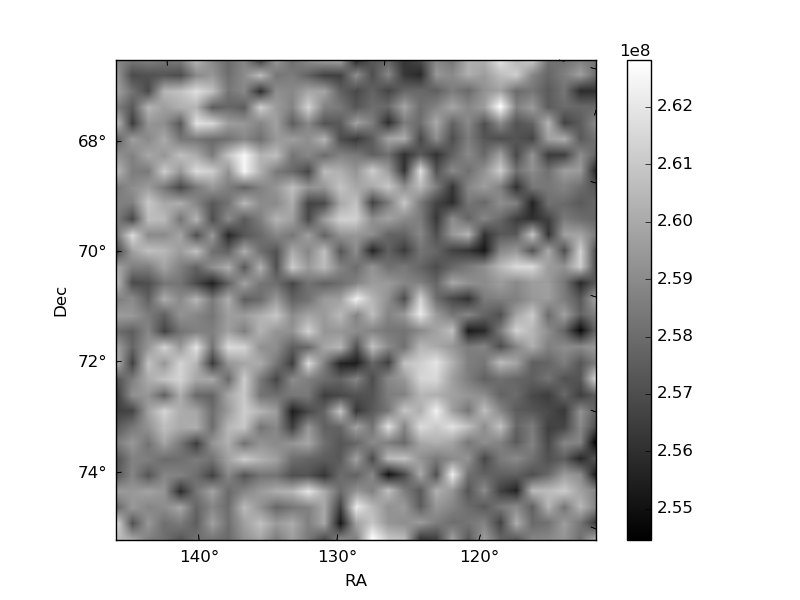
Quadrant B |
|---|---|---|---|
| Quadrant D | 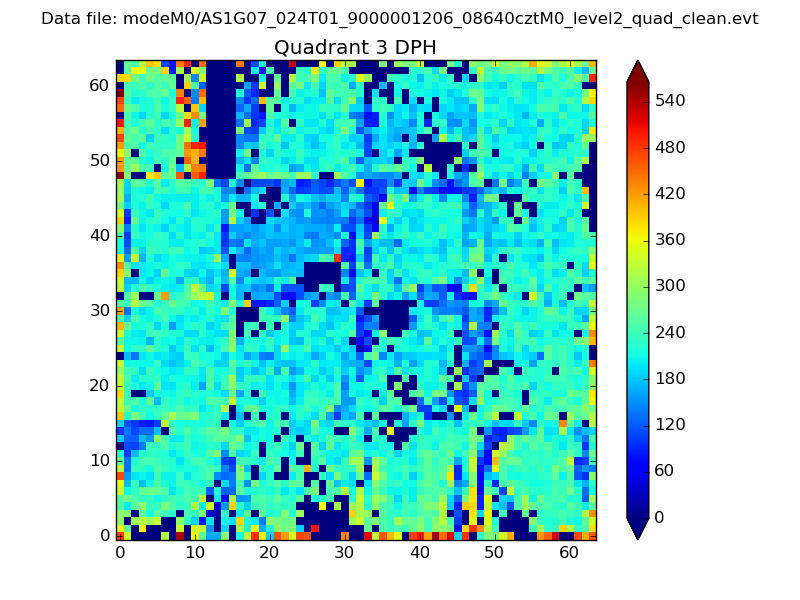 |
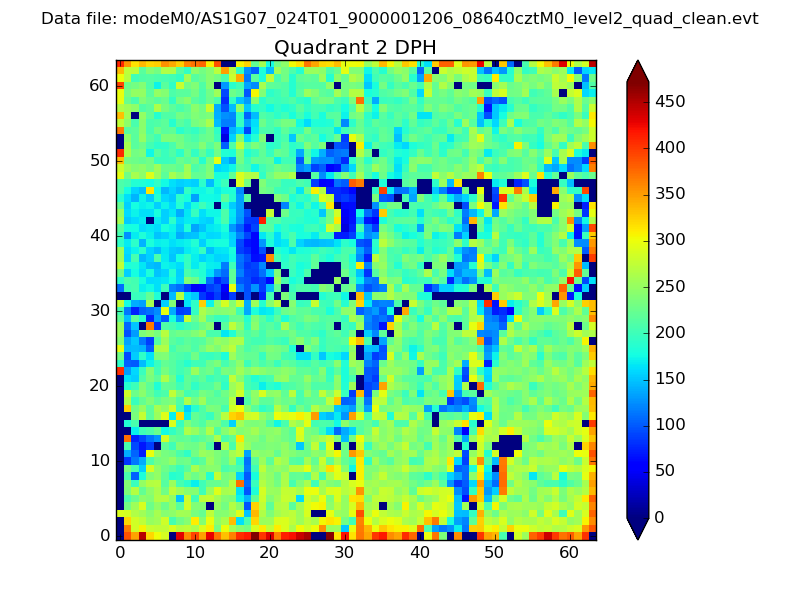 |
Quadrant C |
| Plot type | Count rate plots | Images |
|---|---|---|
| Comparison with Poisson distribution Blue bars denote a histogram of data divided into 1 sec bins. Red curve is a Poisson curve with rate = median count rate of data. |
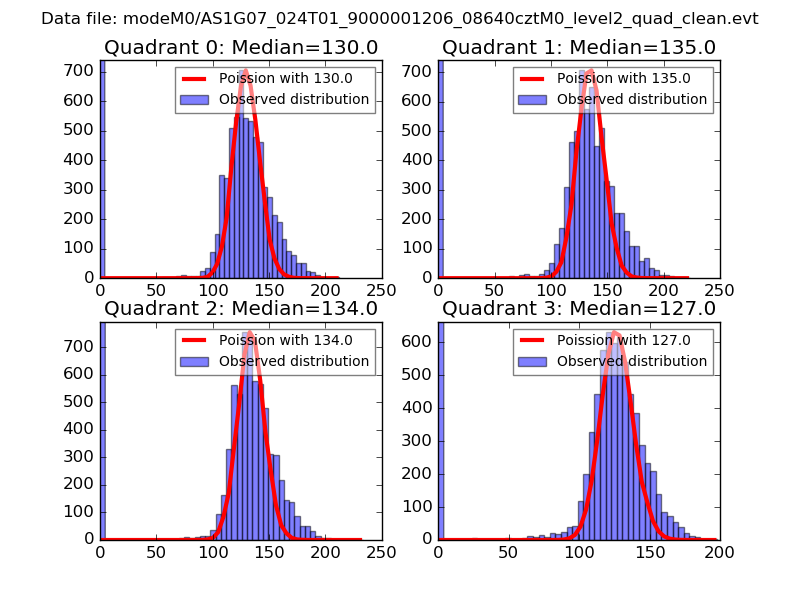 |
 |
| Quadrant-wise count rates Data is divided into 100 sec bins |
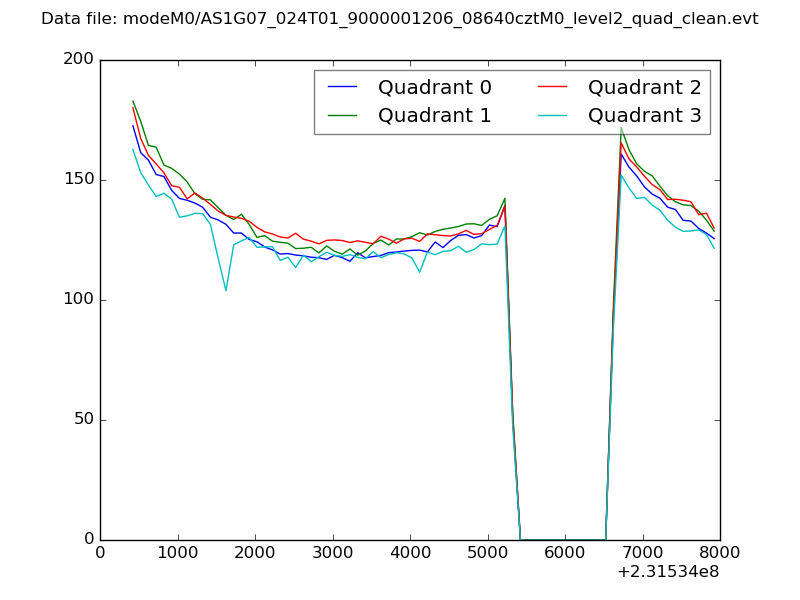 |
|
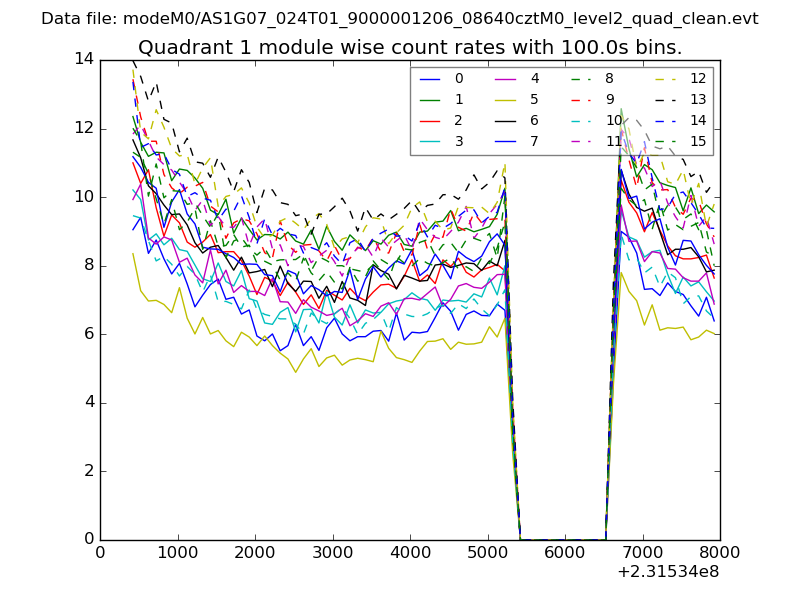
| Module-wise count rates for Quadrant A Data is divided into 100 sec bins |
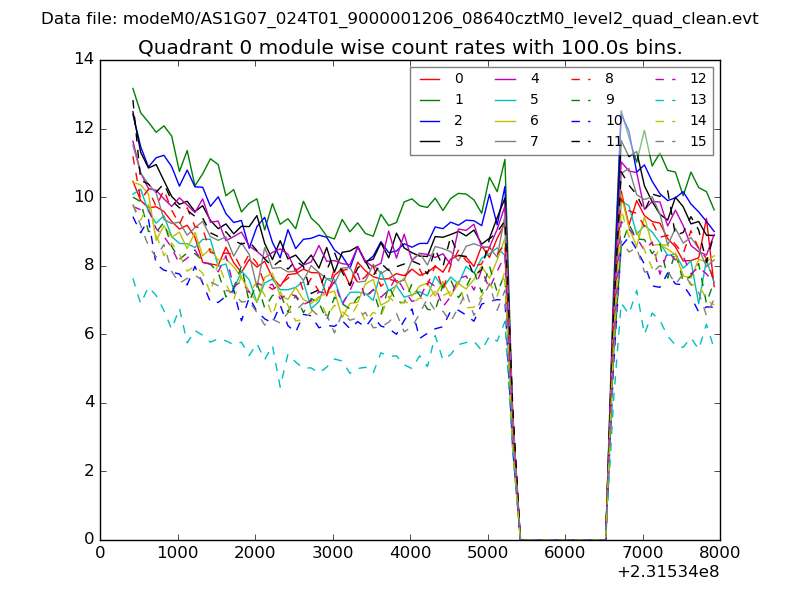 |
 |
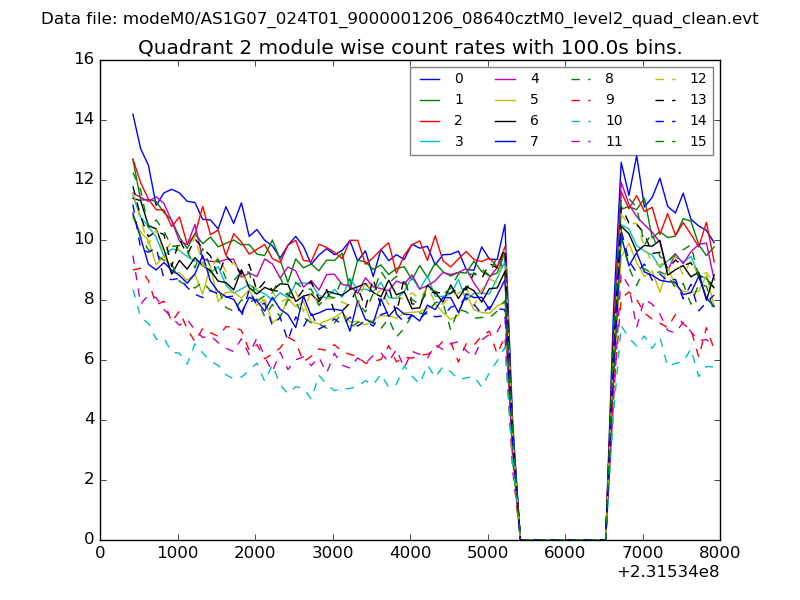
| Module-wise count rates for Quadrant B Data is divided into 100 sec bins |
 |
 |
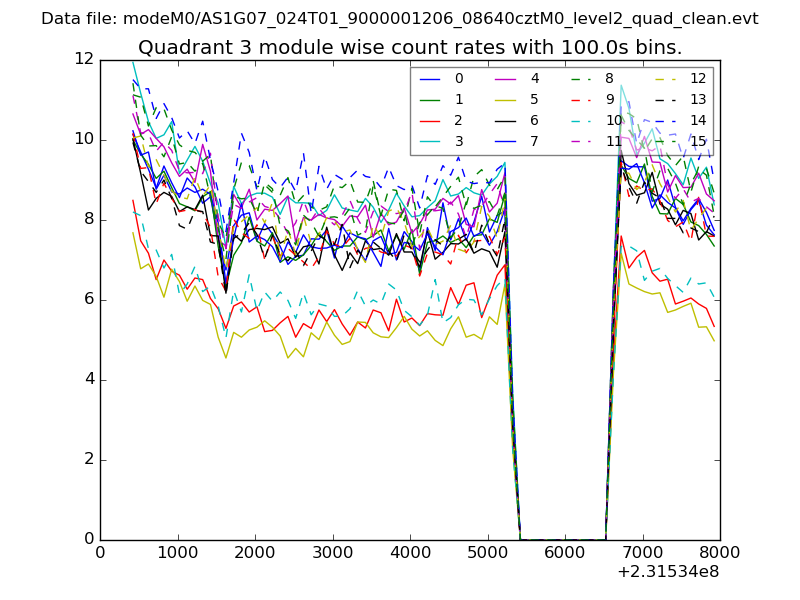
| Module-wise count rates for Quadrant C Data is divided into 100 sec bins |
 |
 |
| Module-wise count rates for Quadrant D Data is divided into 100 sec bins |
 |
 |
| Parameter | Plot |
|---|---|
| CZT HV Monitor | 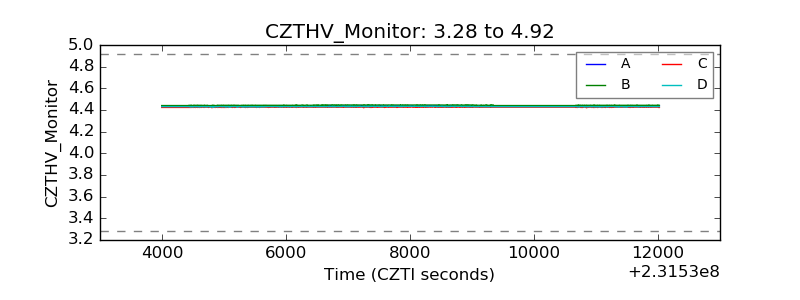 |
| D_VDD | 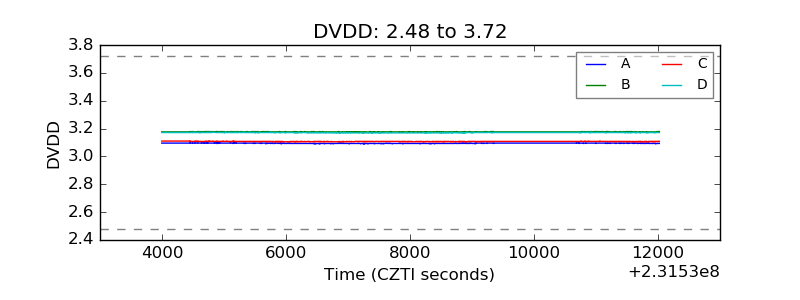 |
| Temperature 1 | 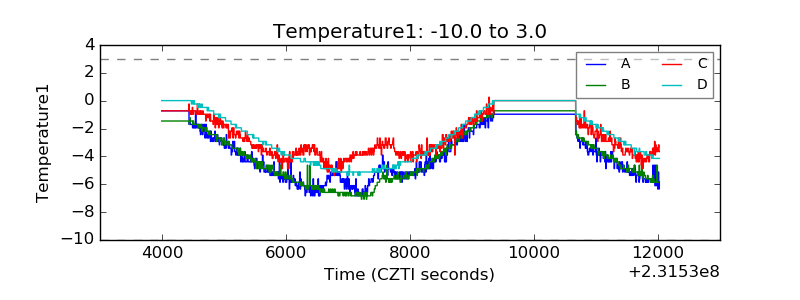 |
| Veto HV Monitor | 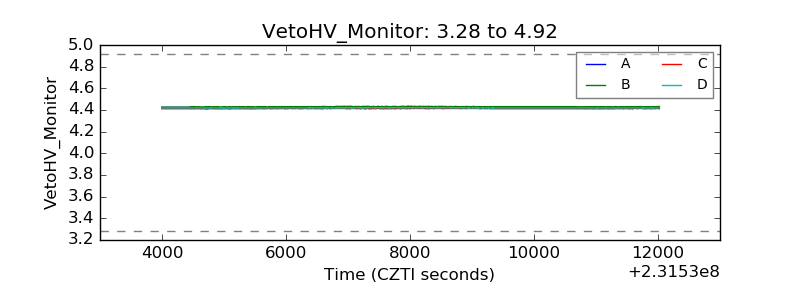 |
| Veto LLD | 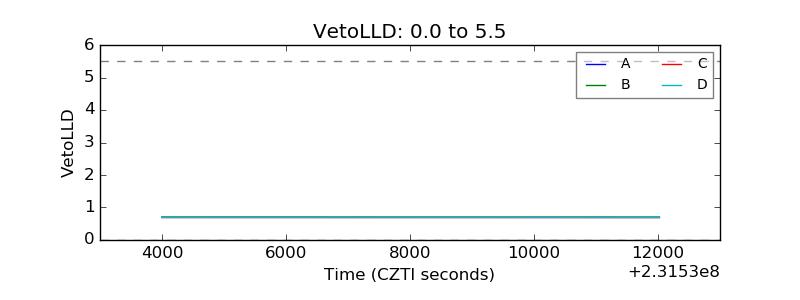 |
| Alpha Counter | 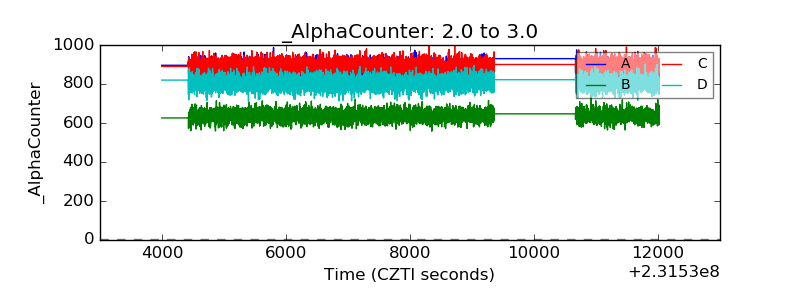 |
| _CPM_Rate | 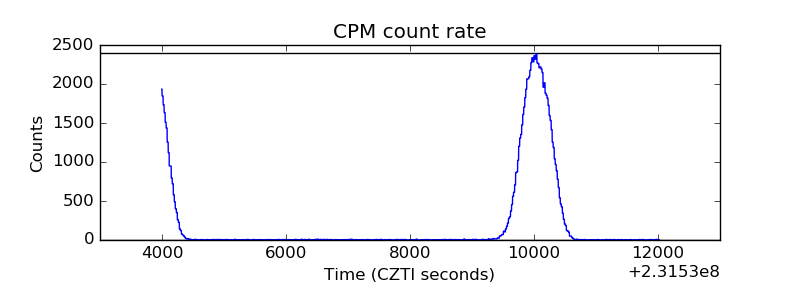 |
| CZT Counter | 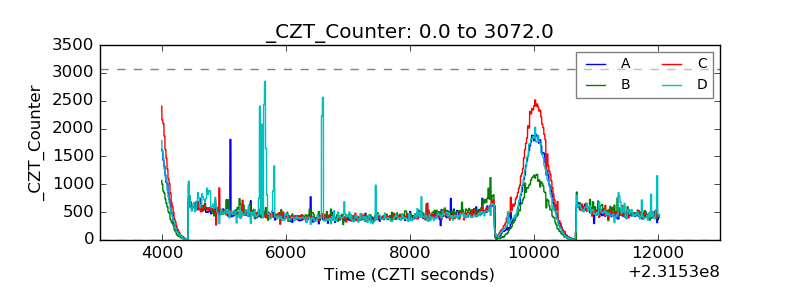 |
| +2.5 Volts monitor |  |
| +5 Volts monitor |  |
| _ROLL_ROT | 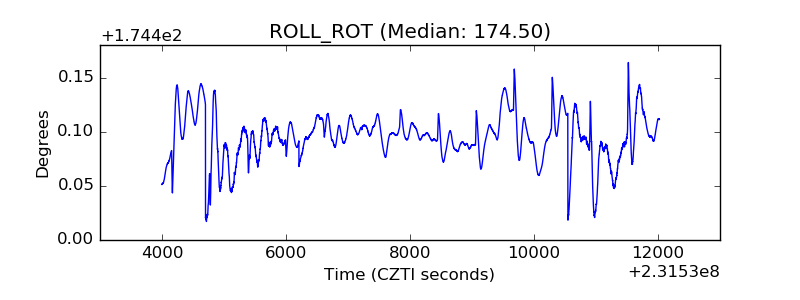 |
| _Roll_DEC |  |
| _Roll_RA | 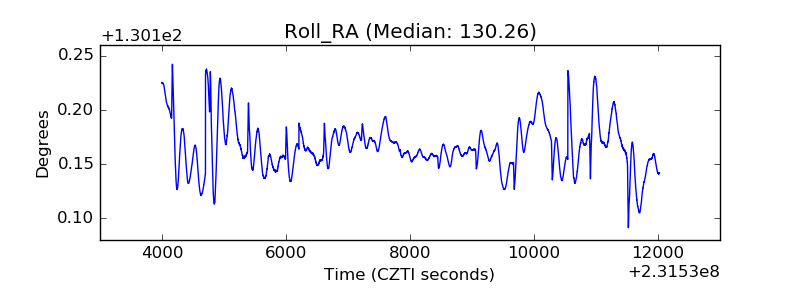 |
| Veto Counter | 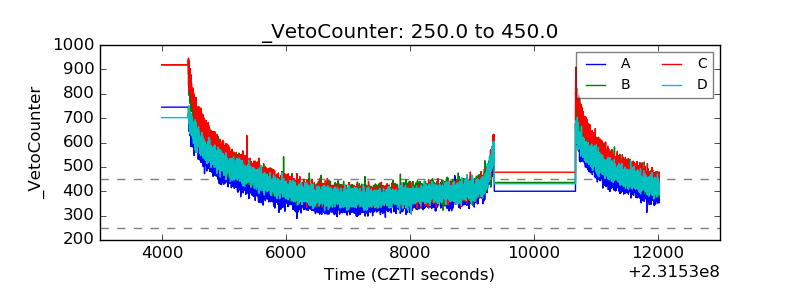 |