| Param | Original file | Final file |
|---|---|---|
| Filename | modeM0/AS1G07_024T01_9000001206_08641cztM0_level2.evt | modeM0/AS1G07_024T01_9000001206_08641cztM0_level2_quad_clean.evt |
| Size (bytes) | 412,729,920 | 120,686,400 |
| Size | 393.6 MB | 115.1 MB |
| Events in quadrant A | 2,813,012 | 796,124 |
| Events in quadrant B | 3,465,541 | 826,900 |
| Events in quadrant C | 2,833,106 | 824,357 |
| Events in quadrant D | 2,966,924 | 776,144 |
| Mode M0 | |||
|---|---|---|---|
| Quadrant | BADHDUFLAG | Total packets | Discarded packets |
| A | 0 | 12767 | 3 |
| B | 0 | 14490 | 2 |
| C | 0 | 12736 | 2 |
| D | 0 | 13326 | 2 |
| Mode M9 | |||
|---|---|---|---|
| Quadrant | BADHDUFLAG | Total packets | Discarded packets |
| A | 0 | 18 | 0 |
| B | 0 | 18 | 0 |
| C | 0 | 18 | 0 |
| D | 0 | 19 | 0 |
| Mode SS | |||
|---|---|---|---|
| Quadrant | BADHDUFLAG | Total packets | Discarded packets |
| A | 0 | 124 | 0 |
| B | 0 | 124 | 0 |
| C | 0 | 124 | 0 |
| D | 0 | 124 | 0 |
| Quadrant | Total seconds | Saturated seconds | Saturation percentage |
|---|---|---|---|
| A | 6194 | 32 | 0.516629% |
| B | 6194 | 117 | 1.888925% |
| C | 6194 | 6 | 0.096868% |
| D | 6194 | 27 | 0.435906% |
Noise dominated data is calculated using 1-second bins in cleaned event files. If a bin has >2000 counts, and if more than 50% of those come from <1% of pixels, then it is considered to be noise-dominated and hence unusable.
| Quadrant | # 1 sec bins | Bins with >0 counts | Bins with >2000 counts | High rate bins dominated by noise | Noise dominated (total time) | Noise dominated (detector-on time) | Marked lightcurve |
|---|---|---|---|---|---|---|---|
| A | 7524 | 6195 | 22 | 22 | 0.29% | 0.36% | 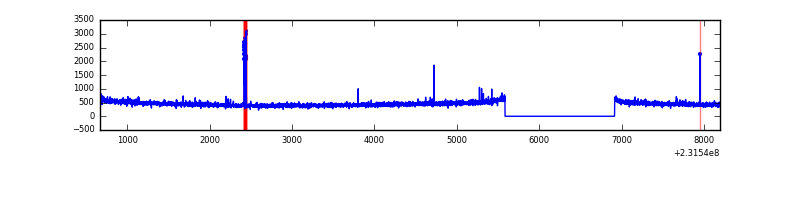 |
| B | 7524 | 6195 | 75 | 75 | 1.00% | 1.21% | 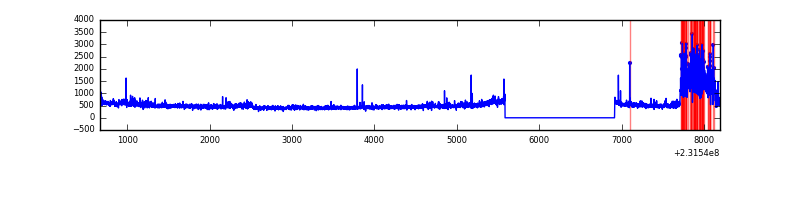 |
| C | 7524 | 6195 | 0 | 0 | 0.00% | 0.00% | 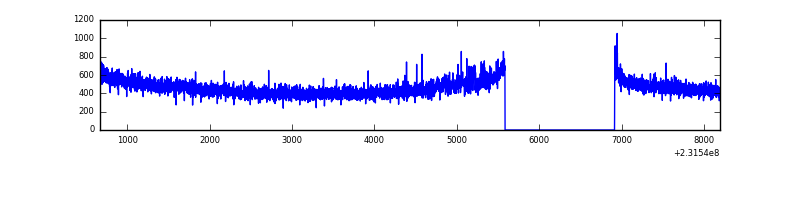 |
| D | 7524 | 6195 | 21 | 21 | 0.28% | 0.34% | 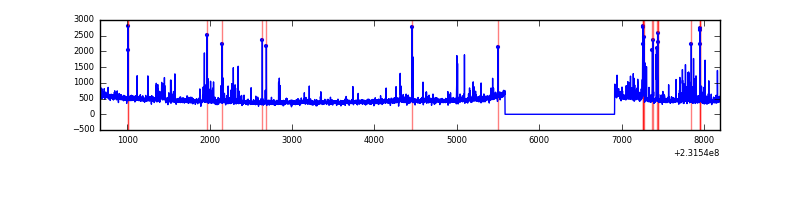 |
Top three noisy pixels from each quadrant. If the there are fewer than three noisy pixels in the level2.evt file, extra rows are filled as -1
| Pixel properties | Quadrant properties | ||||||
|---|---|---|---|---|---|---|---|
| Quadrant | DetID | PixID | Counts | Sigma | Mean | Median | Sigma |
| A | 15 | 174 | 69285 | 475.59 | 711 | 696 | 144.2 |
| A | 8 | 5 | 7625 | 48.05 | 711 | 696 | 144.2 |
| A | 0 | 226 | 6789 | 42.25 | 711 | 696 | 144.2 |
| B | 5 | 143 | 441024 | 3252.33 | 730 | 713 | 135.4 |
| B | 0 | 219 | 108320 | 794.83 | 730 | 713 | 135.4 |
| B | 0 | 214 | 33378 | 241.28 | 730 | 713 | 135.4 |
| C | 14 | 67 | 44753 | 270.41 | 712 | 714 | 162.9 |
| C | 13 | 61 | 5476 | 29.24 | 712 | 714 | 162.9 |
| C | 8 | 208 | 4142 | 21.05 | 712 | 714 | 162.9 |
| D | 10 | 253 | 116462 | 691.04 | 698 | 679 | 167.5 |
| D | 12 | 233 | 116222 | 689.61 | 698 | 679 | 167.5 |
| D | 2 | 234 | 23796 | 137.97 | 698 | 679 | 167.5 |
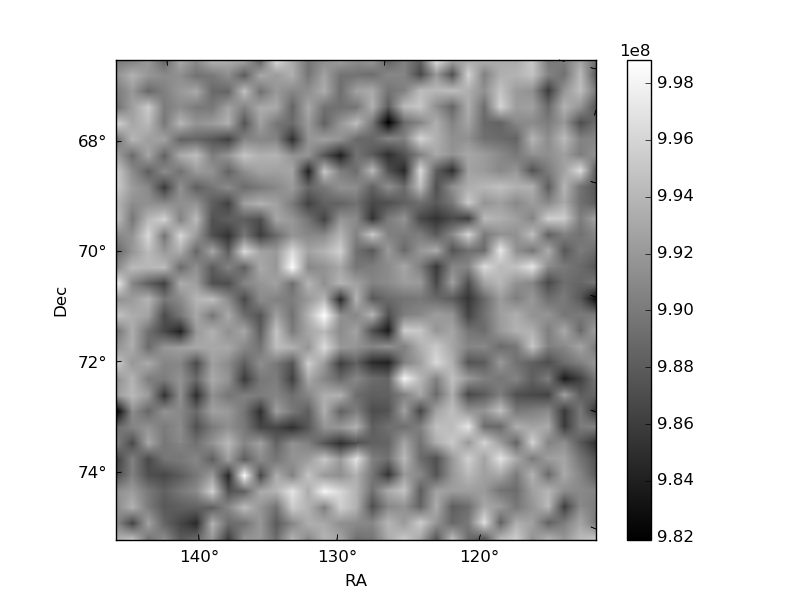
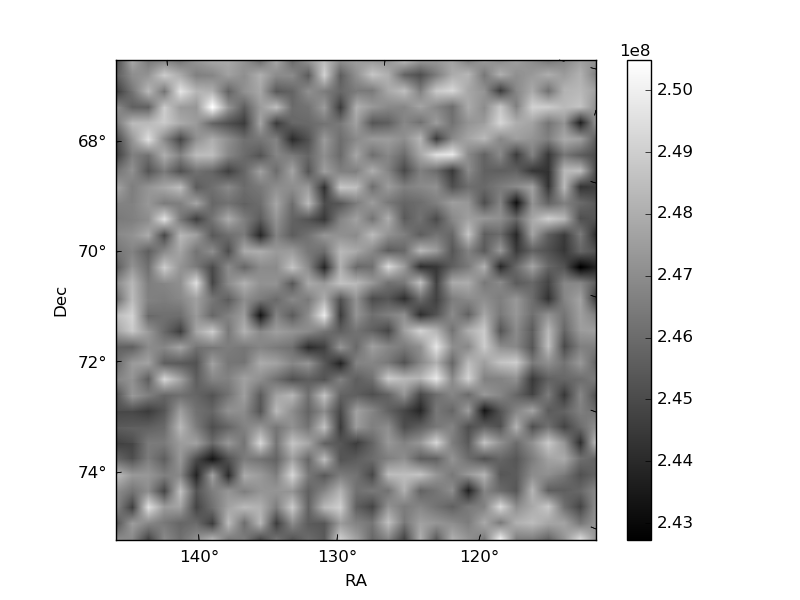
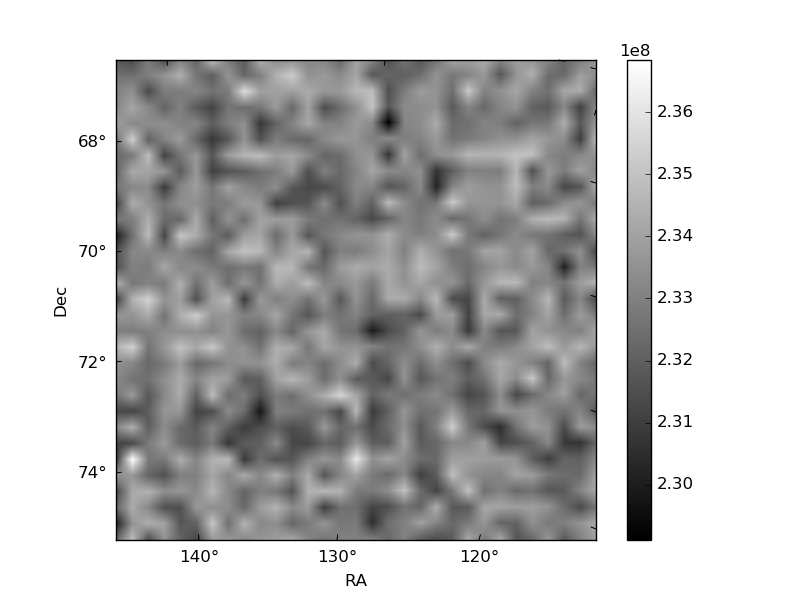
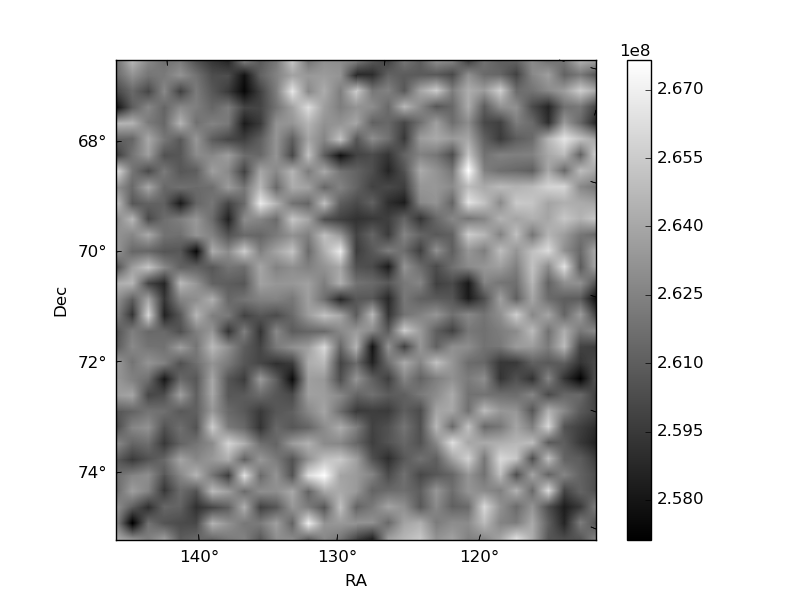
Histogram calculated using DETX and DETY for each event in the final _common_clean file
| Quadrant A | 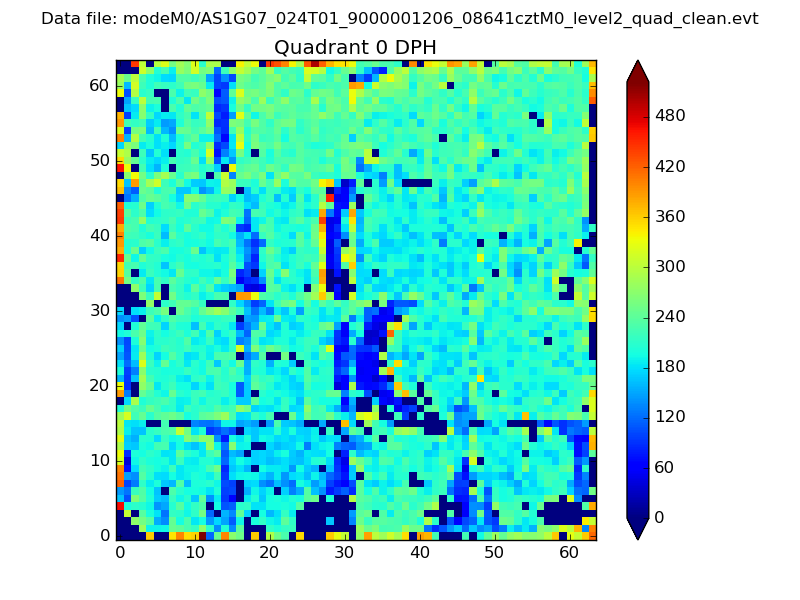 |
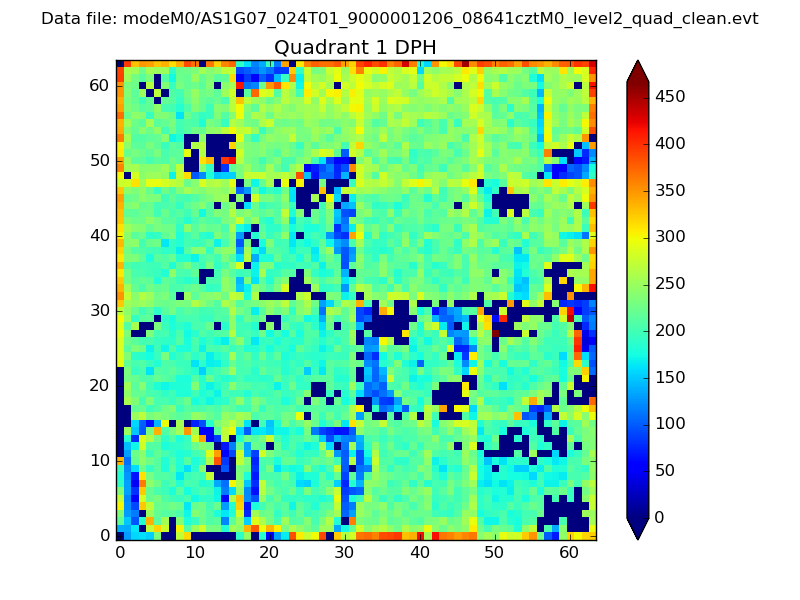 |
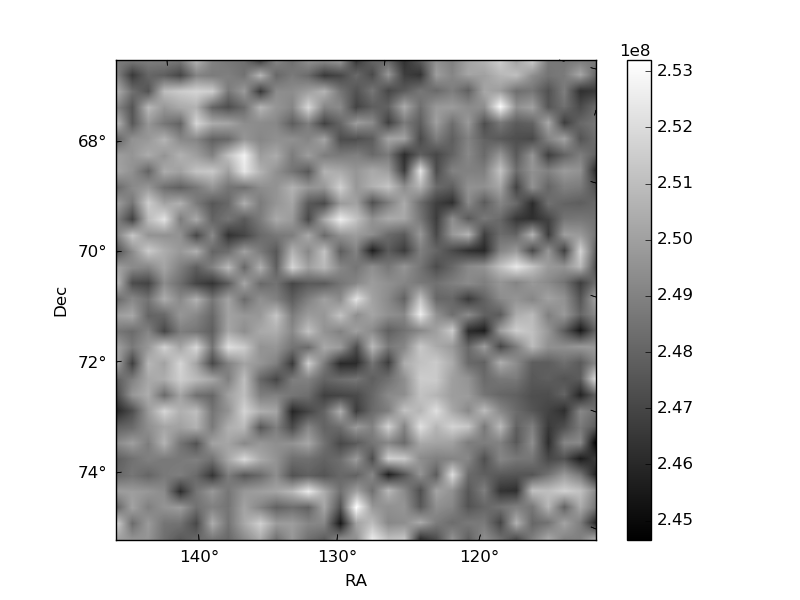
Quadrant B |
|---|---|---|---|
| Quadrant D | 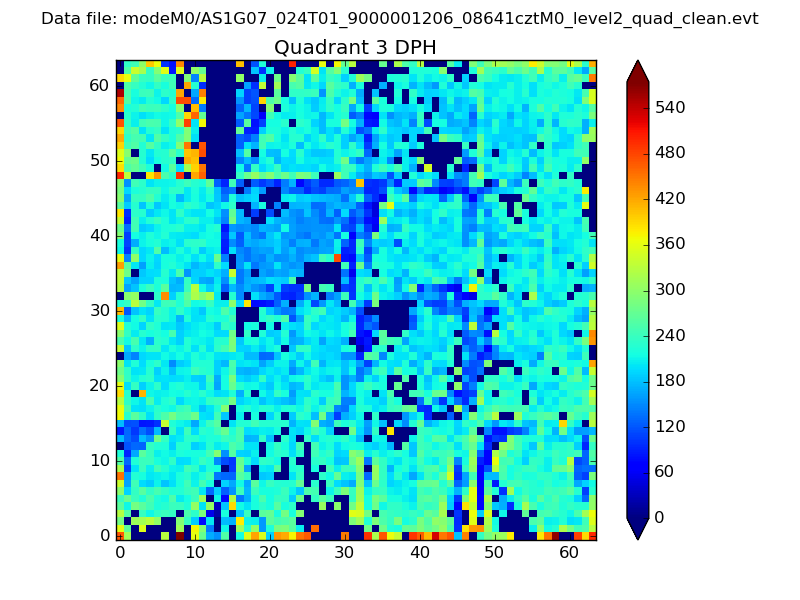 |
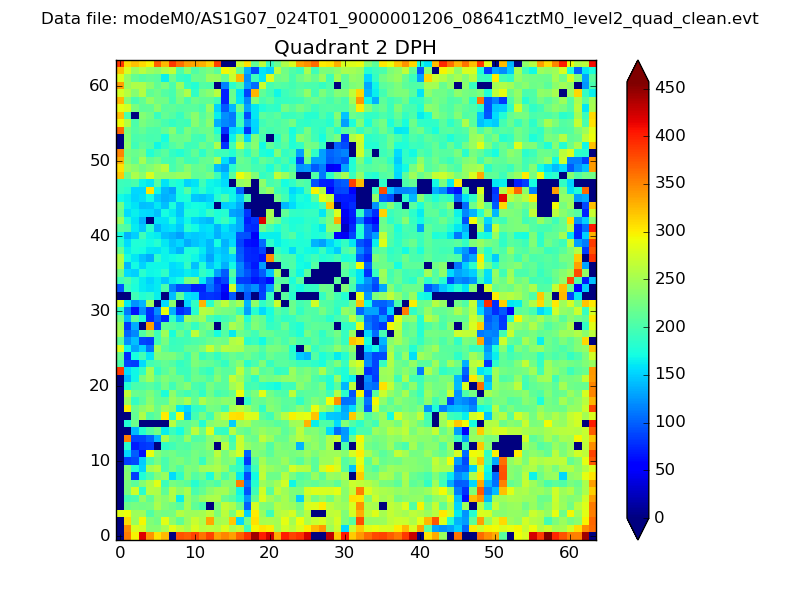 |
Quadrant C |
| Plot type | Count rate plots | Images |
|---|---|---|
| Comparison with Poisson distribution Blue bars denote a histogram of data divided into 1 sec bins. Red curve is a Poisson curve with rate = median count rate of data. |
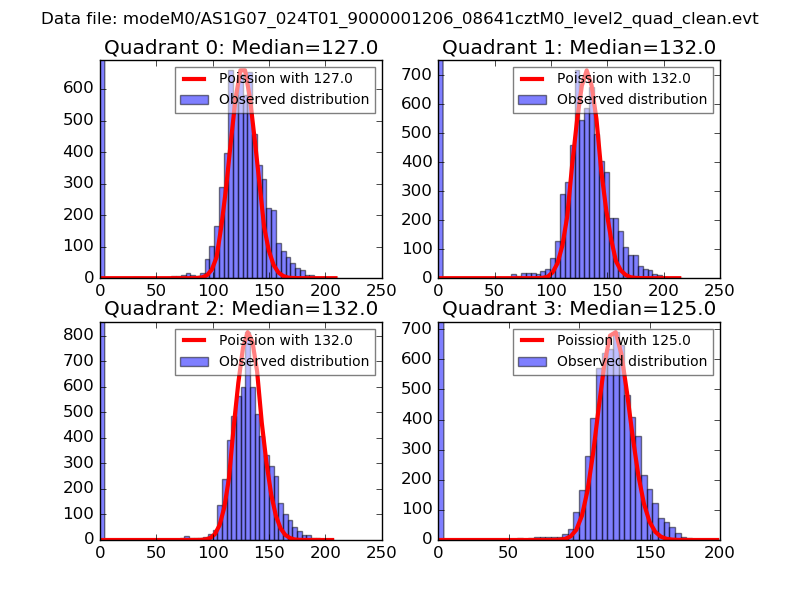 |
 |
| Quadrant-wise count rates Data is divided into 100 sec bins |
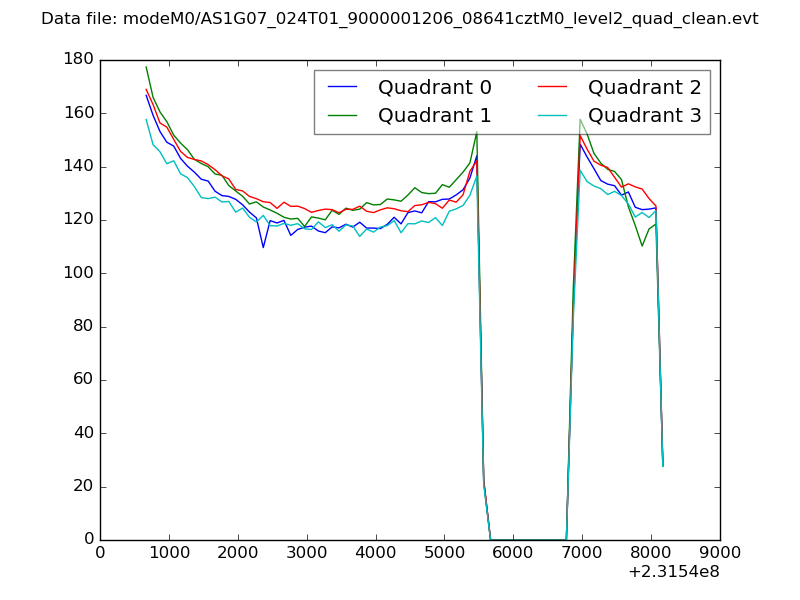 |
|
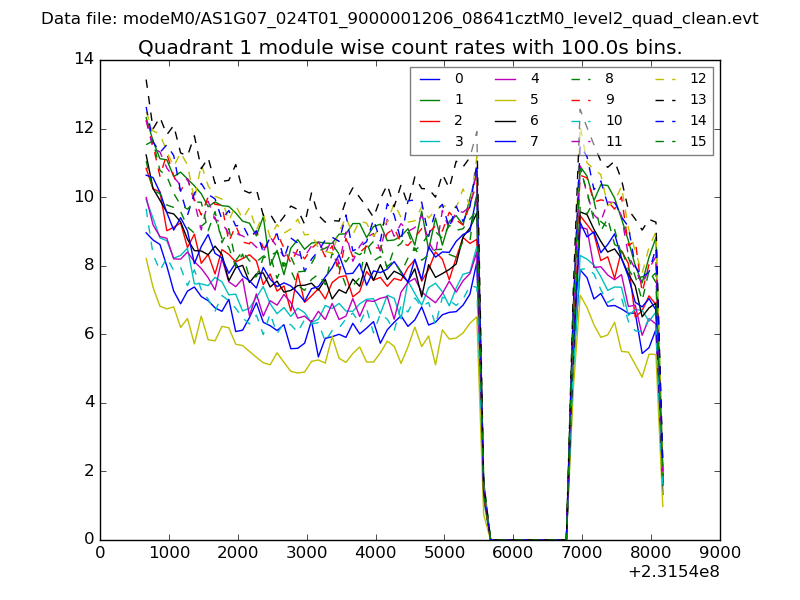
| Module-wise count rates for Quadrant A Data is divided into 100 sec bins |
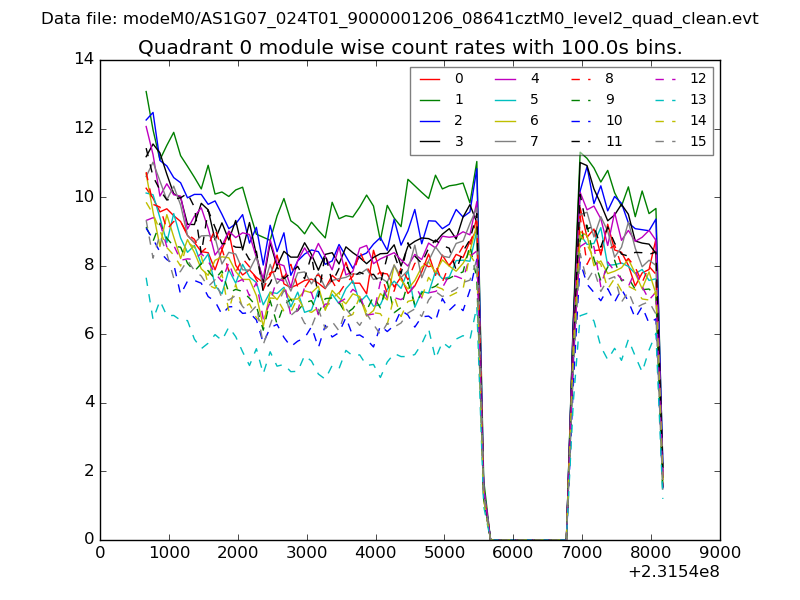 |
 |
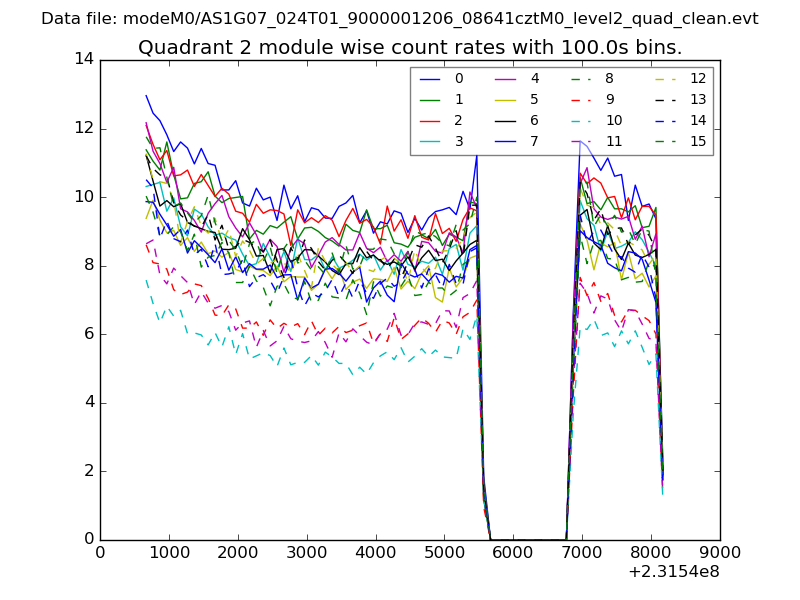
| Module-wise count rates for Quadrant B Data is divided into 100 sec bins |
 |
 |
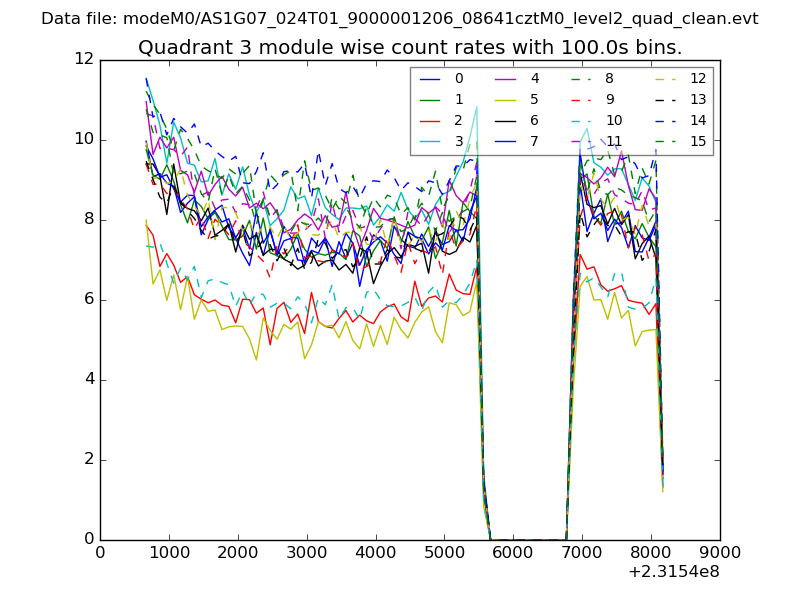
| Module-wise count rates for Quadrant C Data is divided into 100 sec bins |
 |
 |
| Module-wise count rates for Quadrant D Data is divided into 100 sec bins |
 |
 |
| Parameter | Plot |
|---|---|
| CZT HV Monitor | 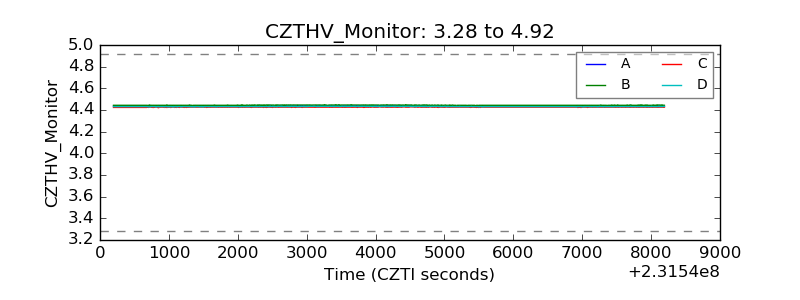 |
| D_VDD | 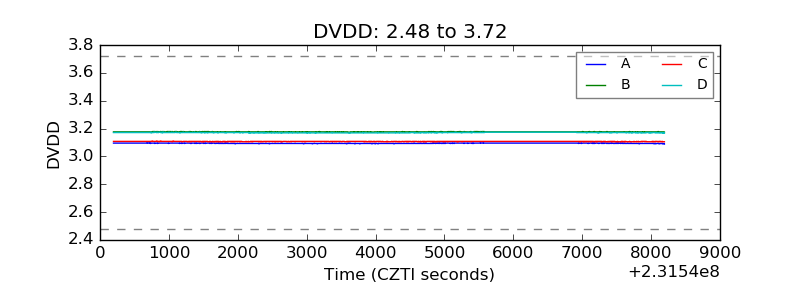 |
| Temperature 1 | 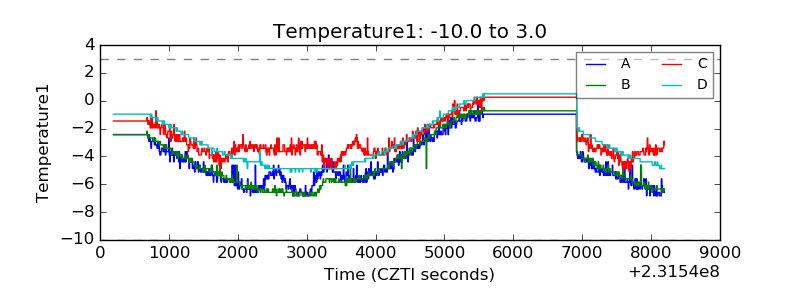 |
| Veto HV Monitor | 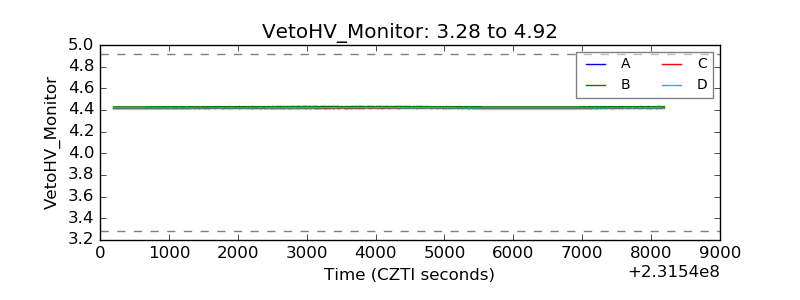 |
| Veto LLD | 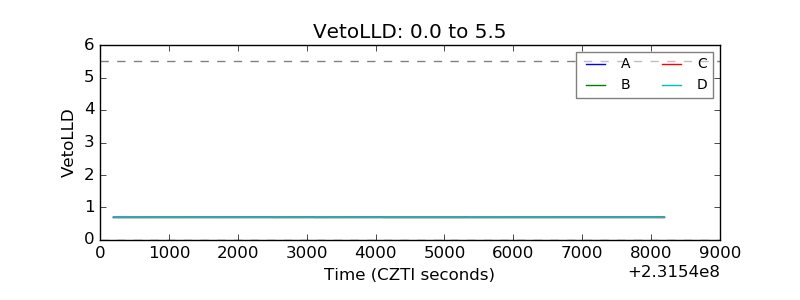 |
| Alpha Counter | 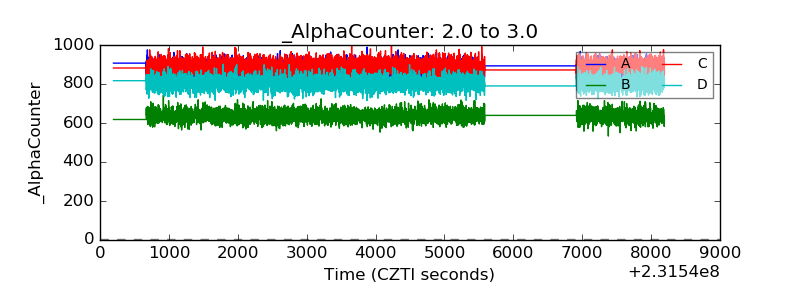 |
| _CPM_Rate | 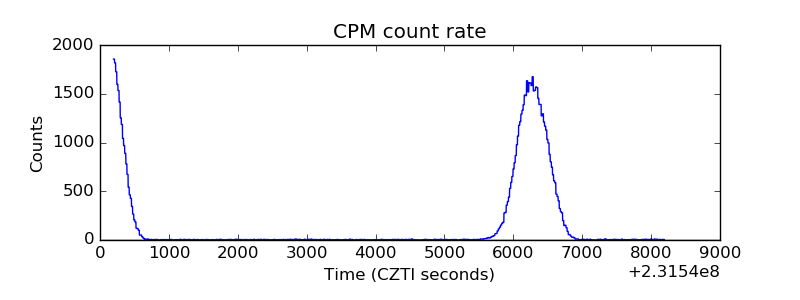 |
| CZT Counter | 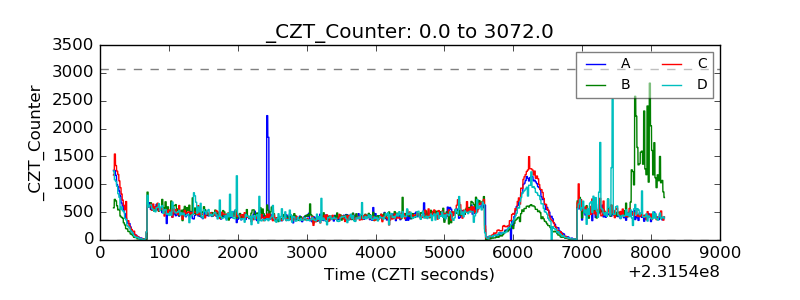 |
| +2.5 Volts monitor | 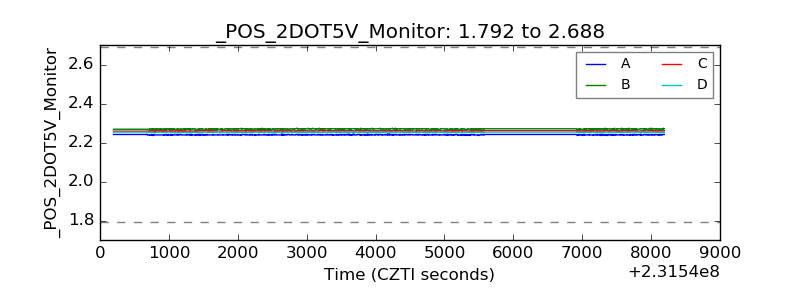 |
| +5 Volts monitor | 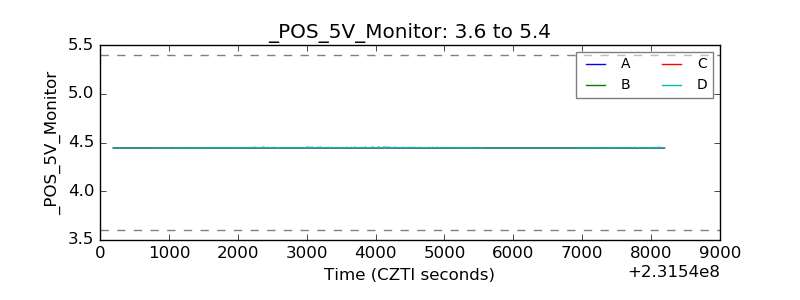 |
| _ROLL_ROT | 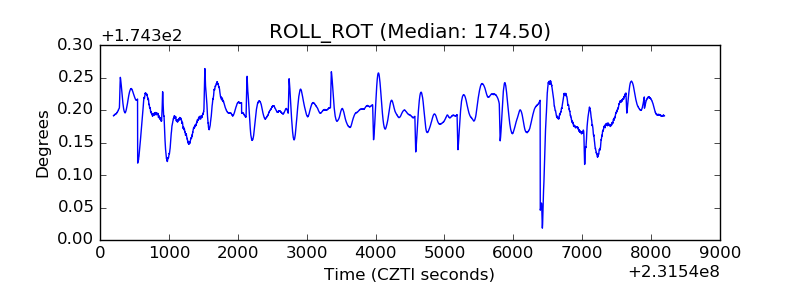 |
| _Roll_DEC |  |
| _Roll_RA | 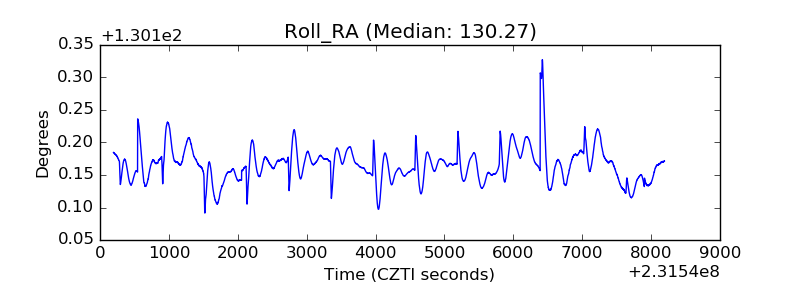 |
| Veto Counter | 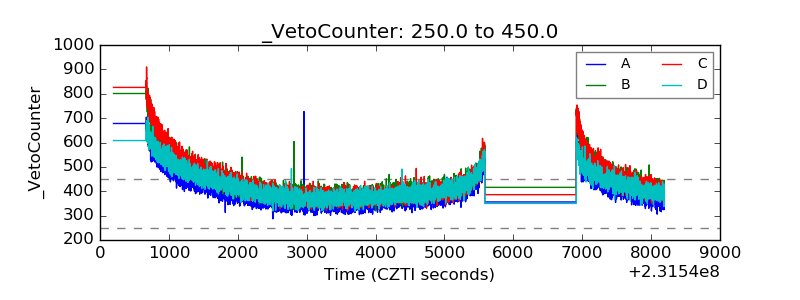 |