| Param | Original file | Final file |
|---|---|---|
| Filename | modeM0/AS1G07_024T01_9000001206_08642cztM0_level2.evt | modeM0/AS1G07_024T01_9000001206_08642cztM0_level2_quad_clean.evt |
| Size (bytes) | 449,182,080 | 119,018,880 |
| Size | 428.4 MB | 113.5 MB |
| Events in quadrant A | 2,814,306 | 787,925 |
| Events in quadrant B | 4,282,416 | 801,444 |
| Events in quadrant C | 3,053,820 | 804,836 |
| Events in quadrant D | 3,020,759 | 766,821 |
| Mode M0 | |||
|---|---|---|---|
| Quadrant | BADHDUFLAG | Total packets | Discarded packets |
| A | 0 | 13022 | 5 |
| B | 0 | 17098 | 2 |
| C | 0 | 13668 | 2 |
| D | 0 | 13748 | 6 |
| Mode M9 | |||
|---|---|---|---|
| Quadrant | BADHDUFLAG | Total packets | Discarded packets |
| A | 0 | 17 | 0 |
| B | 0 | 17 | 0 |
| C | 0 | 17 | 0 |
| D | 0 | 18 | 0 |
| Mode SS | |||
|---|---|---|---|
| Quadrant | BADHDUFLAG | Total packets | Discarded packets |
| A | 0 | 128 | 0 |
| B | 0 | 128 | 0 |
| C | 0 | 128 | 0 |
| D | 0 | 128 | 0 |
| Quadrant | Total seconds | Saturated seconds | Saturation percentage |
|---|---|---|---|
| A | 6361 | 25 | 0.393020% |
| B | 6362 | 321 | 5.045583% |
| C | 6362 | 64 | 1.005973% |
| D | 6360 | 44 | 0.691824% |
Noise dominated data is calculated using 1-second bins in cleaned event files. If a bin has >2000 counts, and if more than 50% of those come from <1% of pixels, then it is considered to be noise-dominated and hence unusable.
| Quadrant | # 1 sec bins | Bins with >0 counts | Bins with >2000 counts | High rate bins dominated by noise | Noise dominated (total time) | Noise dominated (detector-on time) | Marked lightcurve |
|---|---|---|---|---|---|---|---|
| A | 7572 | 6362 | 6 | 6 | 0.08% | 0.09% | 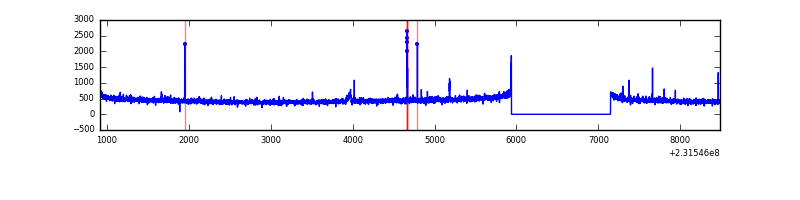 |
| B | 7572 | 6363 | 208 | 208 | 2.75% | 3.27% | 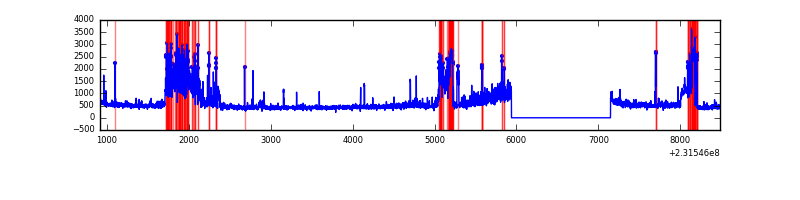 |
| C | 7572 | 6363 | 33 | 33 | 0.44% | 0.52% | 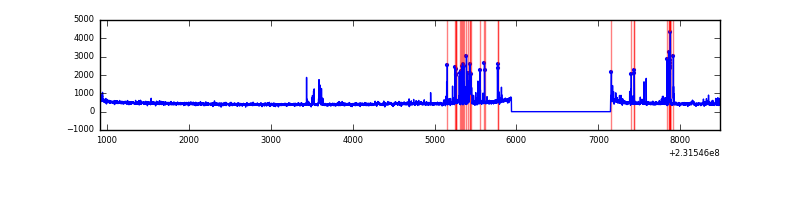 |
| D | 7572 | 6363 | 21 | 21 | 0.28% | 0.33% | 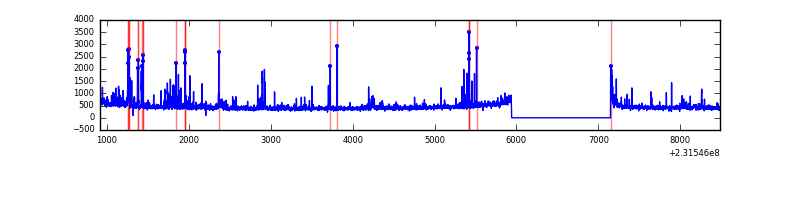 |
Top three noisy pixels from each quadrant. If the there are fewer than three noisy pixels in the level2.evt file, extra rows are filled as -1
| Pixel properties | Quadrant properties | ||||||
|---|---|---|---|---|---|---|---|
| Quadrant | DetID | PixID | Counts | Sigma | Mean | Median | Sigma |
| A | 15 | 174 | 37113 | 250.47 | 716 | 702 | 145.4 |
| A | 8 | 5 | 8808 | 55.76 | 716 | 702 | 145.4 |
| A | 5 | 168 | 7643 | 47.75 | 716 | 702 | 145.4 |
| B | 5 | 143 | 781226 | 5776.59 | 723 | 704 | 135.1 |
| B | 0 | 228 | 471523 | 3484.5 | 723 | 704 | 135.1 |
| B | 0 | 219 | 139652 | 1028.34 | 723 | 704 | 135.1 |
| C | 4 | 254 | 257485 | 1576.44 | 709 | 712 | 162.9 |
| C | 14 | 67 | 23401 | 139.3 | 709 | 712 | 162.9 |
| C | 13 | 61 | 5509 | 29.45 | 709 | 712 | 162.9 |
| D | 10 | 253 | 120473 | 706.93 | 699 | 678 | 169.5 |
| D | 12 | 233 | 118876 | 697.5 | 699 | 678 | 169.5 |
| D | 1 | 52 | 36030 | 208.62 | 699 | 678 | 169.5 |
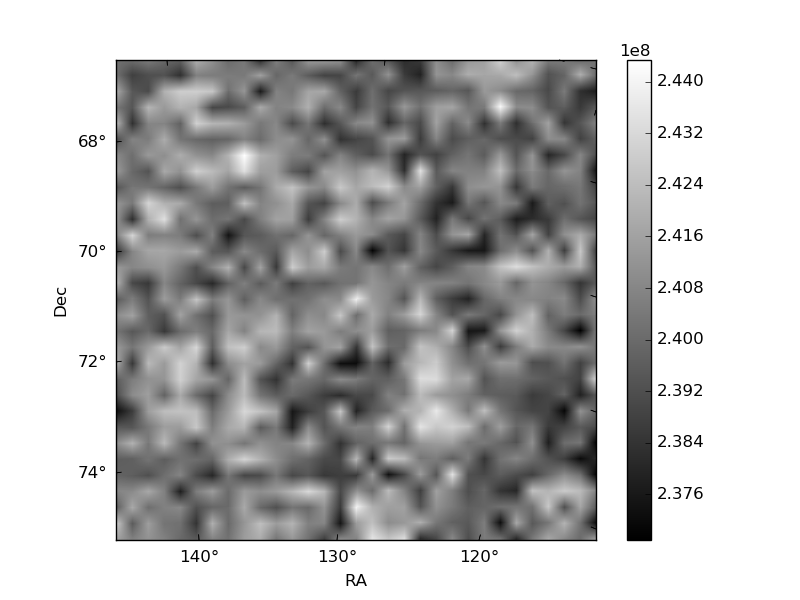
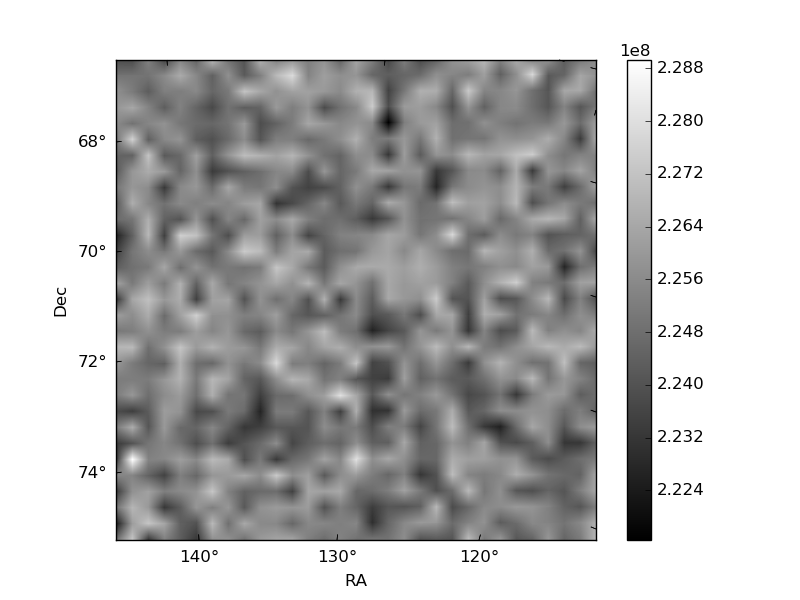
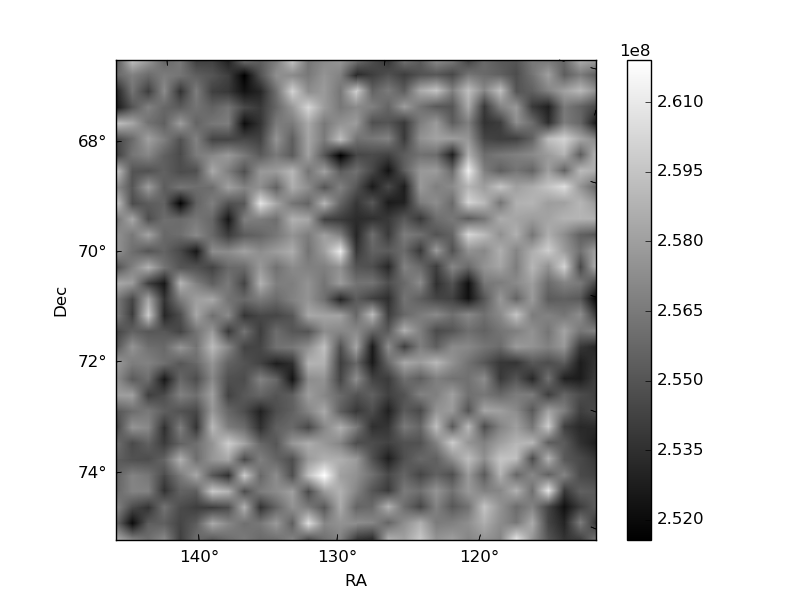
Histogram calculated using DETX and DETY for each event in the final _common_clean file
| Quadrant A | 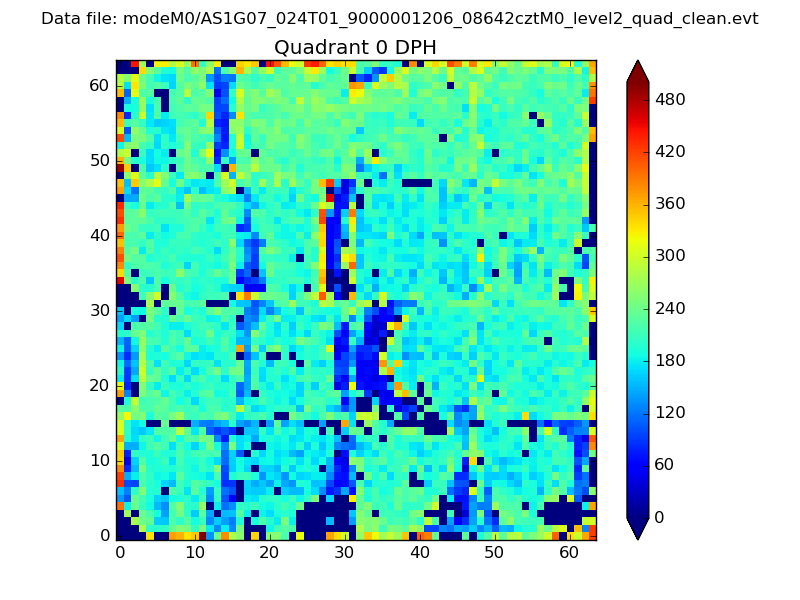 |
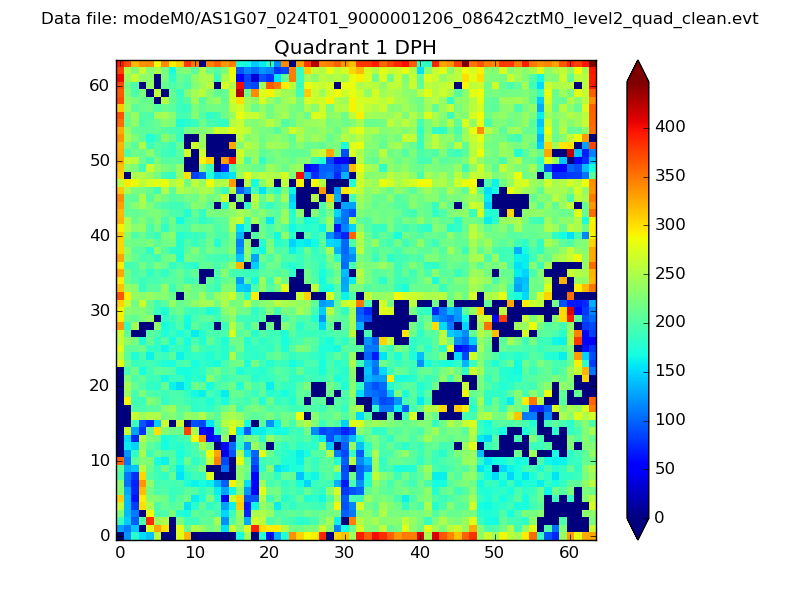 |
Quadrant B |
|---|---|---|---|
| Quadrant D | 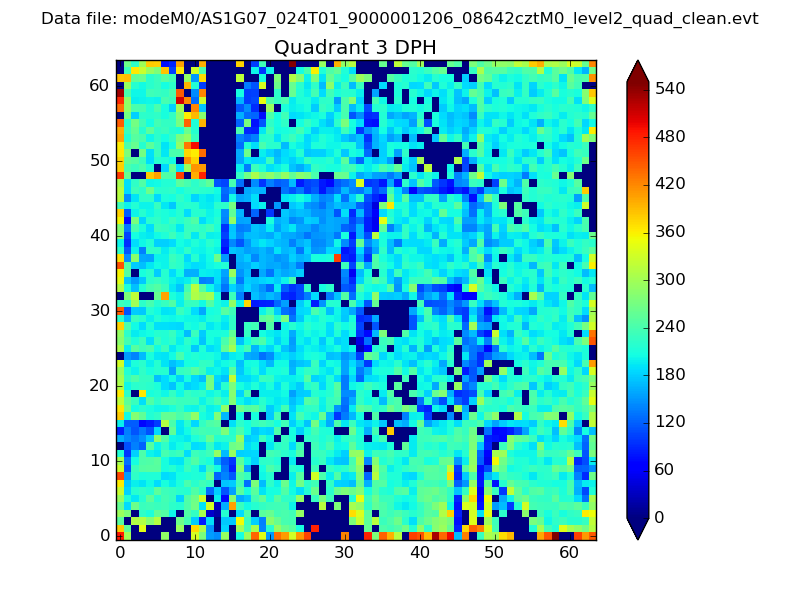 |
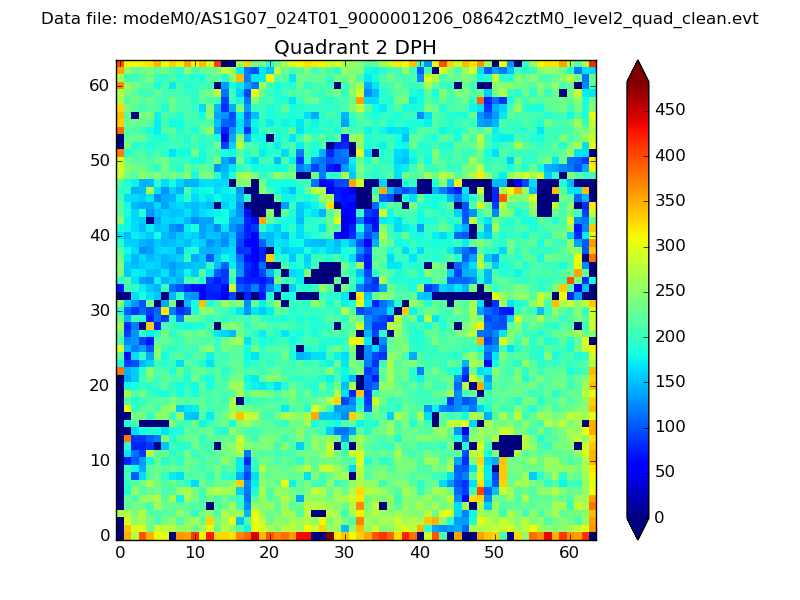 |
Quadrant C |
| Plot type | Count rate plots | Images |
|---|---|---|
| Comparison with Poisson distribution Blue bars denote a histogram of data divided into 1 sec bins. Red curve is a Poisson curve with rate = median count rate of data. |
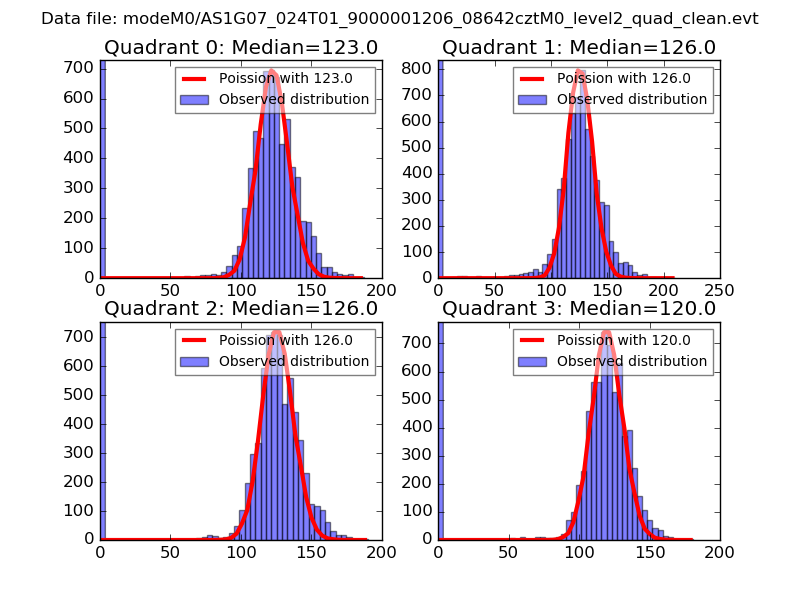 |
 |
| Quadrant-wise count rates Data is divided into 100 sec bins |
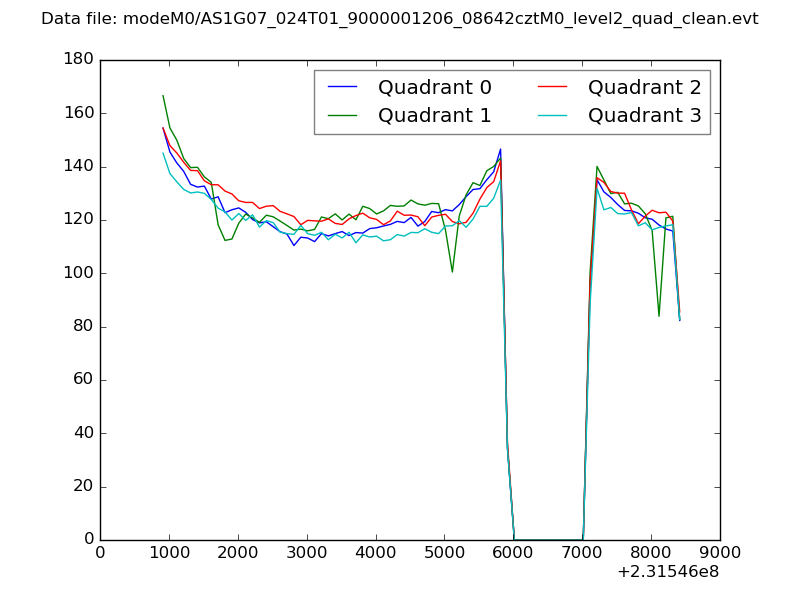 |
|
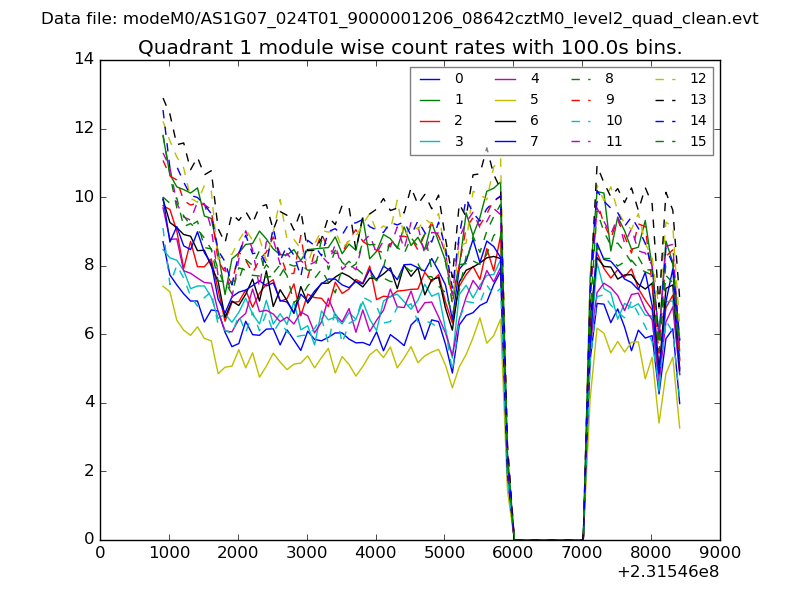
| Module-wise count rates for Quadrant A Data is divided into 100 sec bins |
 |
 |
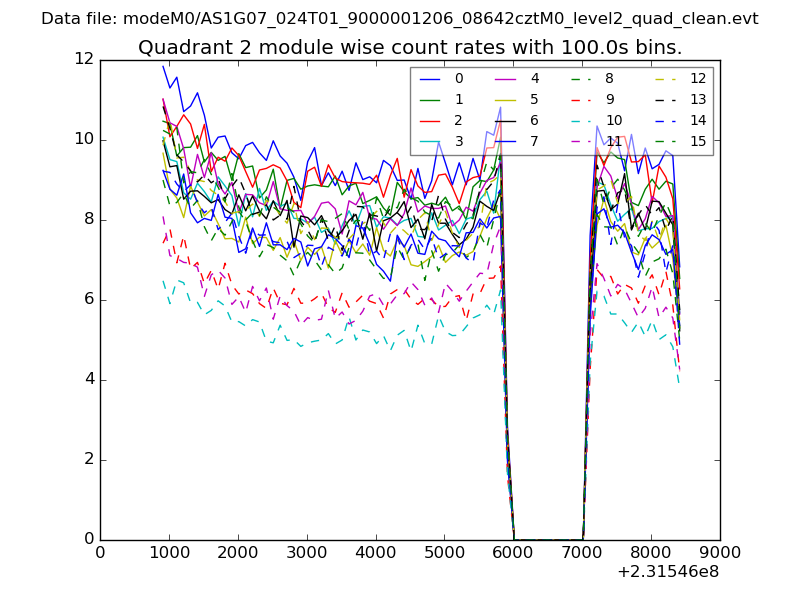
| Module-wise count rates for Quadrant B Data is divided into 100 sec bins |
 |
 |
| Module-wise count rates for Quadrant C Data is divided into 100 sec bins |
 |
 |
| Module-wise count rates for Quadrant D Data is divided into 100 sec bins |
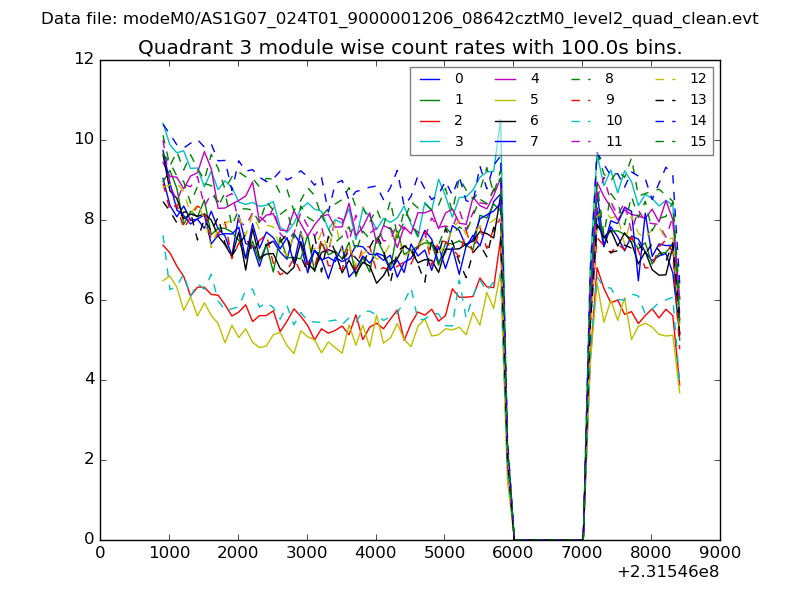 |
 |
| Parameter | Plot |
|---|---|
| CZT HV Monitor | 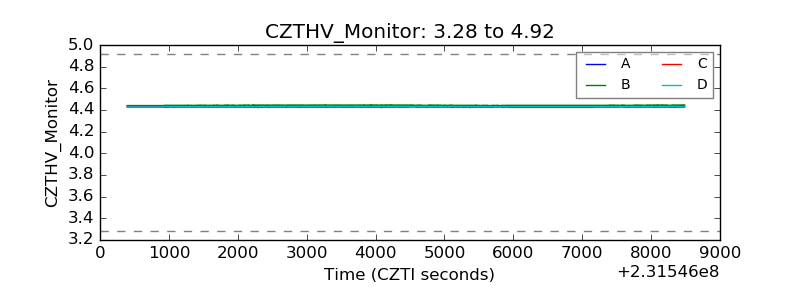 |
| D_VDD | 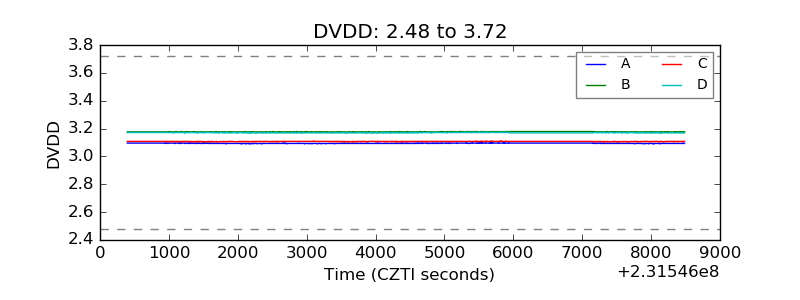 |
| Temperature 1 |  |
| Veto HV Monitor | 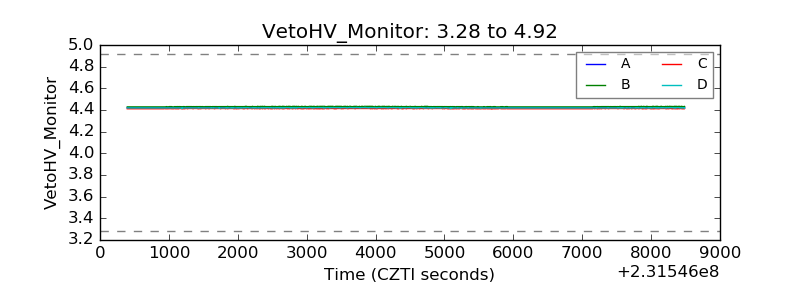 |
| Veto LLD | 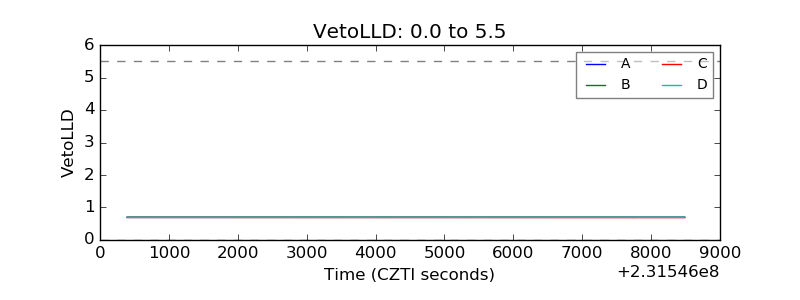 |
| Alpha Counter | 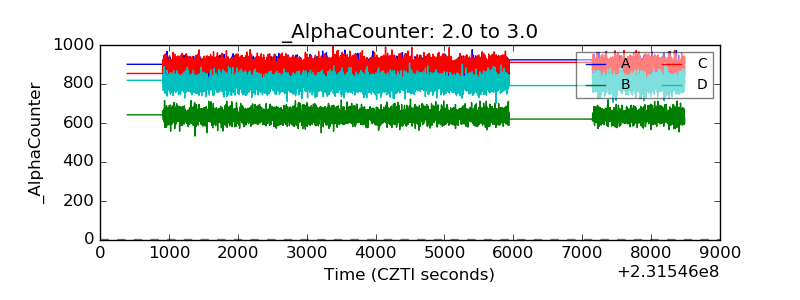 |
| _CPM_Rate | 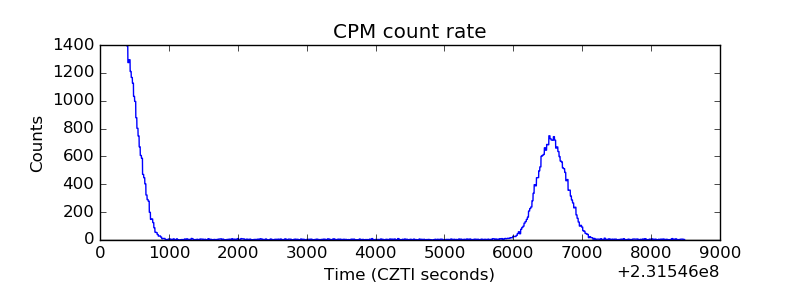 |
| CZT Counter | 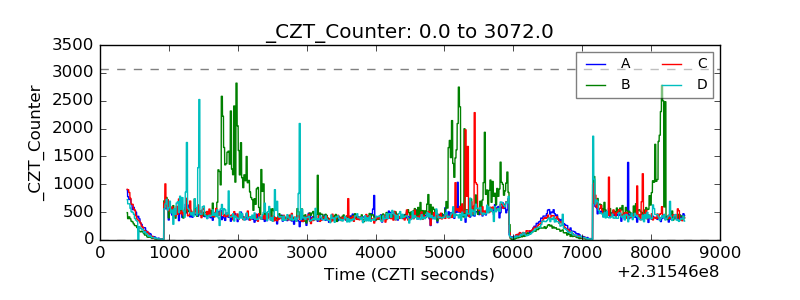 |
| +2.5 Volts monitor |  |
| +5 Volts monitor |  |
| _ROLL_ROT | 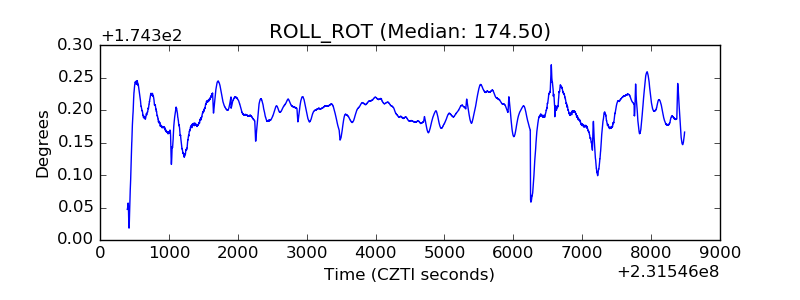 |
| _Roll_DEC |  |
| _Roll_RA | 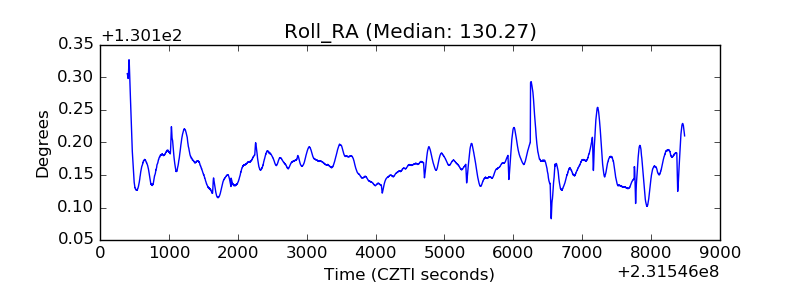 |
| Veto Counter |  |