| Param | Original file | Final file |
|---|---|---|
| Filename | modeM0/AS1G07_024T01_9000001206_08644cztM0_level2.evt | modeM0/AS1G07_024T01_9000001206_08644cztM0_level2_quad_clean.evt |
| Size (bytes) | 497,214,720 | 131,552,640 |
| Size | 474.2 MB | 125.5 MB |
| Events in quadrant A | 3,236,819 | 865,198 |
| Events in quadrant B | 3,493,389 | 893,827 |
| Events in quadrant C | 3,984,943 | 870,963 |
| Events in quadrant D | 3,837,037 | 836,498 |
| Mode M0 | |||
|---|---|---|---|
| Quadrant | BADHDUFLAG | Total packets | Discarded packets |
| A | 0 | 15233 | 3 |
| B | 0 | 15603 | 2 |
| C | 0 | 17369 | 2 |
| D | 0 | 17087 | 2 |
| Mode M9 | |||
|---|---|---|---|
| Quadrant | BADHDUFLAG | Total packets | Discarded packets |
| A | 0 | 14 | 0 |
| B | 0 | 14 | 0 |
| C | 0 | 14 | 0 |
| D | 0 | 14 | 0 |
| Mode SS | |||
|---|---|---|---|
| Quadrant | BADHDUFLAG | Total packets | Discarded packets |
| A | 0 | 156 | 0 |
| B | 0 | 156 | 0 |
| C | 0 | 156 | 0 |
| D | 0 | 156 | 0 |
| Quadrant | Total seconds | Saturated seconds | Saturation percentage |
|---|---|---|---|
| A | 7439 | 80 | 1.075413% |
| B | 7439 | 113 | 1.519021% |
| C | 7439 | 275 | 3.696733% |
| D | 7439 | 198 | 2.661648% |
Noise dominated data is calculated using 1-second bins in cleaned event files. If a bin has >2000 counts, and if more than 50% of those come from <1% of pixels, then it is considered to be noise-dominated and hence unusable.
| Quadrant | # 1 sec bins | Bins with >0 counts | Bins with >2000 counts | High rate bins dominated by noise | Noise dominated (total time) | Noise dominated (detector-on time) | Marked lightcurve |
|---|---|---|---|---|---|---|---|
| A | 8879 | 7441 | 7 | 7 | 0.08% | 0.09% | 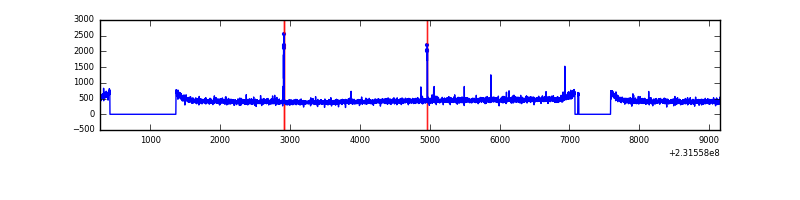 |
| B | 8879 | 7441 | 3 | 3 | 0.03% | 0.04% | 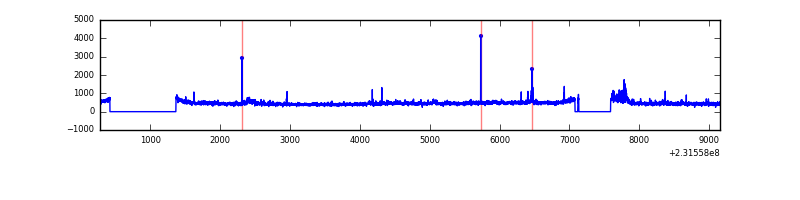 |
| C | 8879 | 7441 | 210 | 210 | 2.37% | 2.82% |  |
| D | 8879 | 7441 | 156 | 156 | 1.76% | 2.10% | 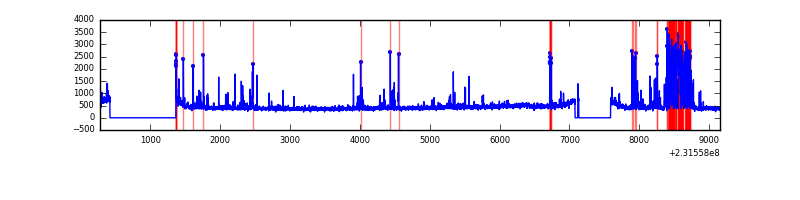 |
Top three noisy pixels from each quadrant. If the there are fewer than three noisy pixels in the level2.evt file, extra rows are filled as -1
| Pixel properties | Quadrant properties | ||||||
|---|---|---|---|---|---|---|---|
| Quadrant | DetID | PixID | Counts | Sigma | Mean | Median | Sigma |
| A | 15 | 174 | 37373 | 216.67 | 829 | 808 | 168.8 |
| A | 0 | 226 | 7753 | 41.15 | 829 | 808 | 168.8 |
| A | 12 | 194 | 7269 | 38.28 | 829 | 808 | 168.8 |
| B | 4 | 48 | 72307 | 445.86 | 845 | 823 | 160.3 |
| B | 0 | 219 | 44191 | 270.49 | 845 | 823 | 160.3 |
| B | 0 | 214 | 42207 | 258.12 | 845 | 823 | 160.3 |
| C | 4 | 254 | 809548 | 4349.41 | 809 | 813 | 185.9 |
| C | 4 | 222 | 6390 | 29.99 | 809 | 813 | 185.9 |
| C | 13 | 61 | 6306 | 29.54 | 809 | 813 | 185.9 |
| D | 0 | 11 | 596873 | 3050.83 | 801 | 776 | 195.4 |
| D | 7 | 71 | 40151 | 201.52 | 801 | 776 | 195.4 |
| D | 12 | 233 | 32901 | 164.42 | 801 | 776 | 195.4 |
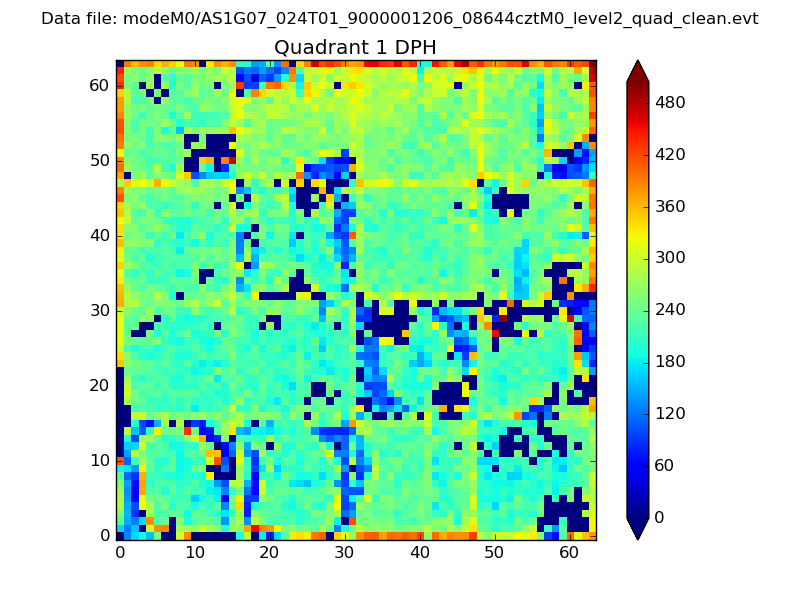
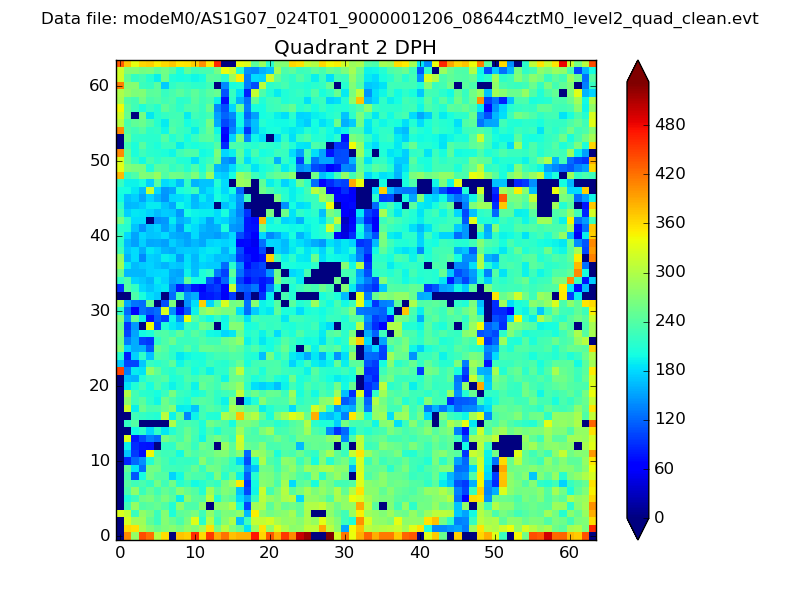
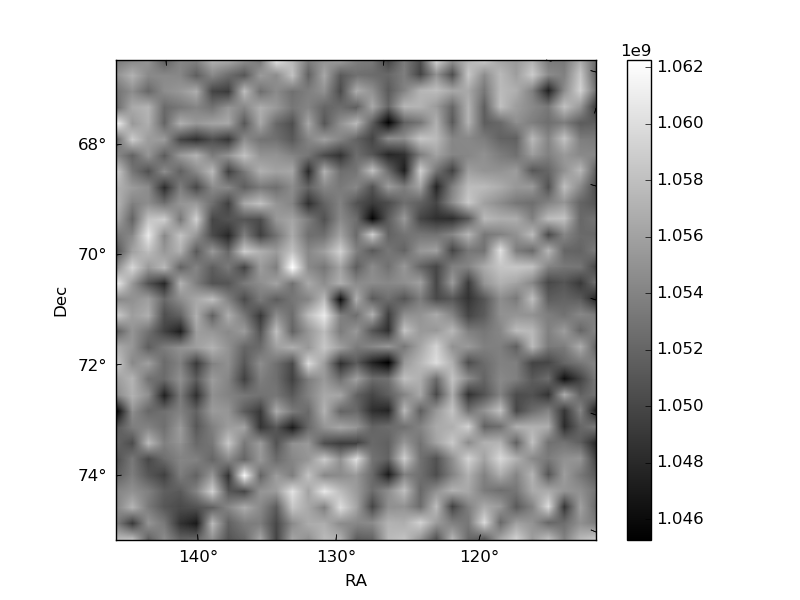
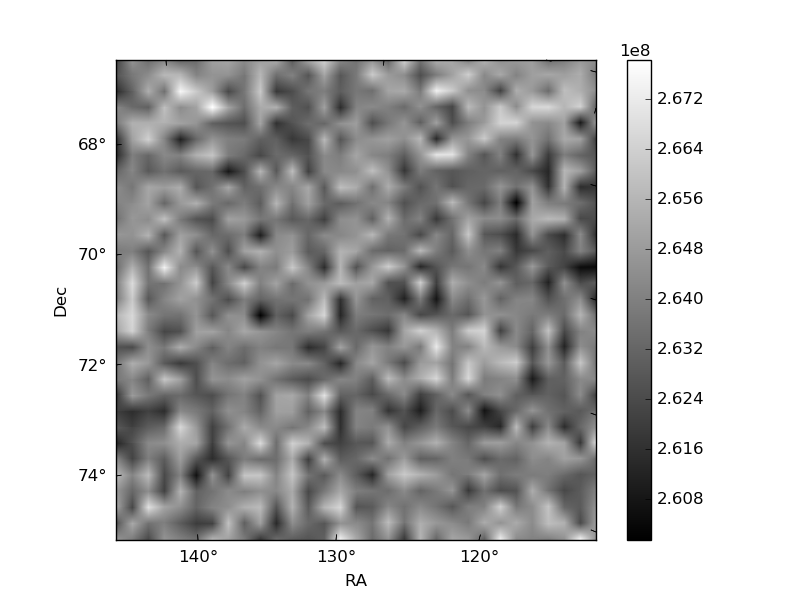
Histogram calculated using DETX and DETY for each event in the final _common_clean file
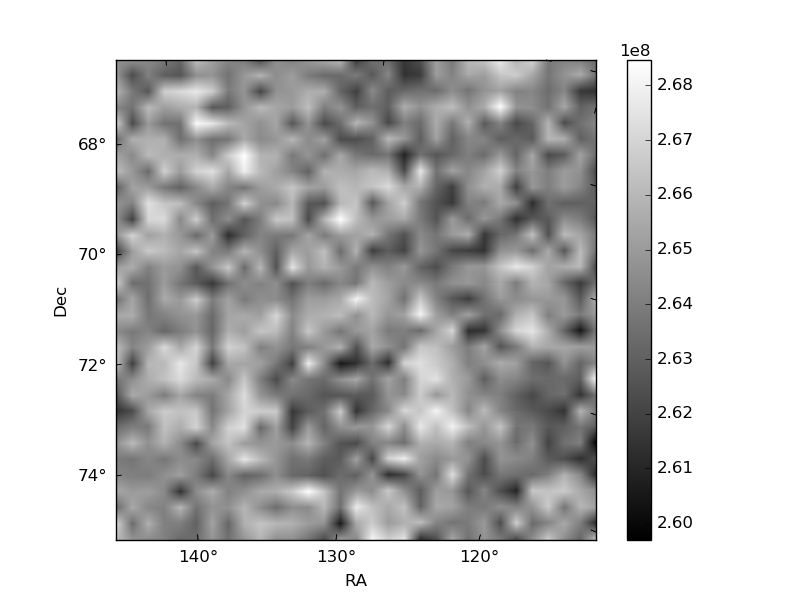
| Quadrant A | 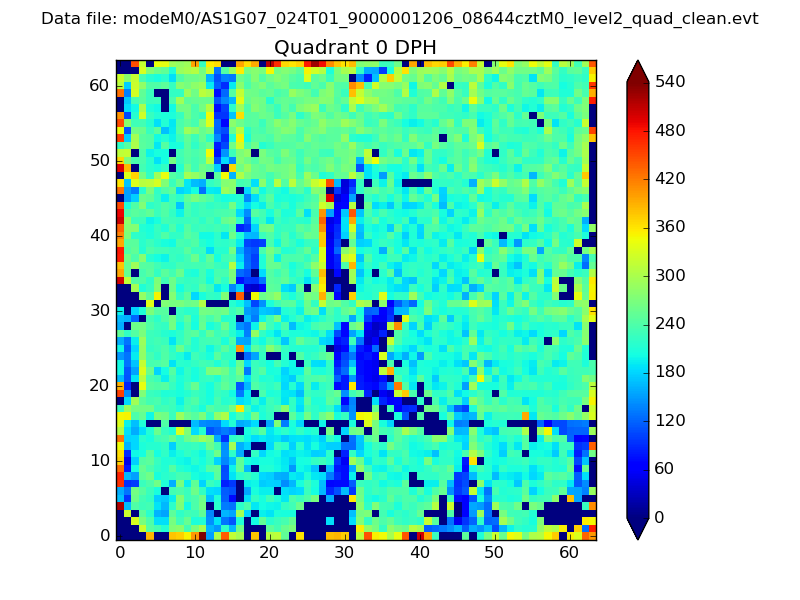 |
 |
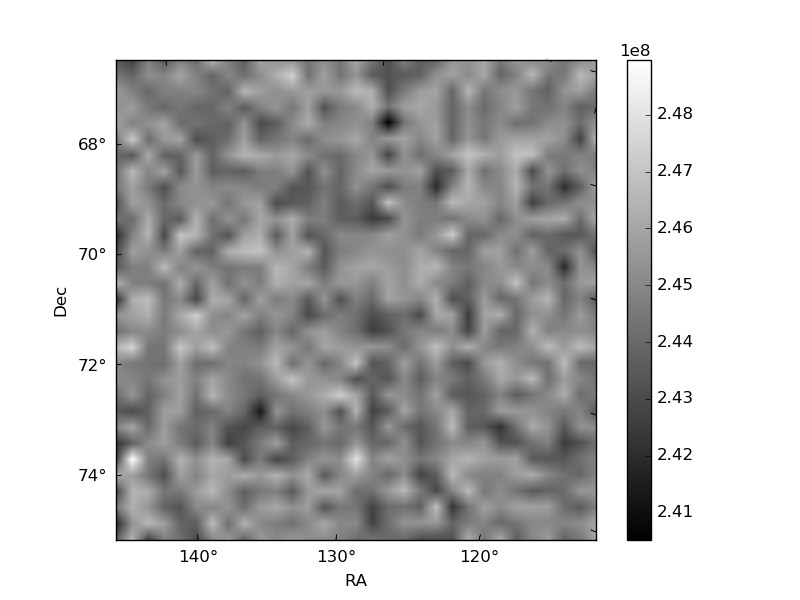
Quadrant B |
|---|---|---|---|
| Quadrant D | 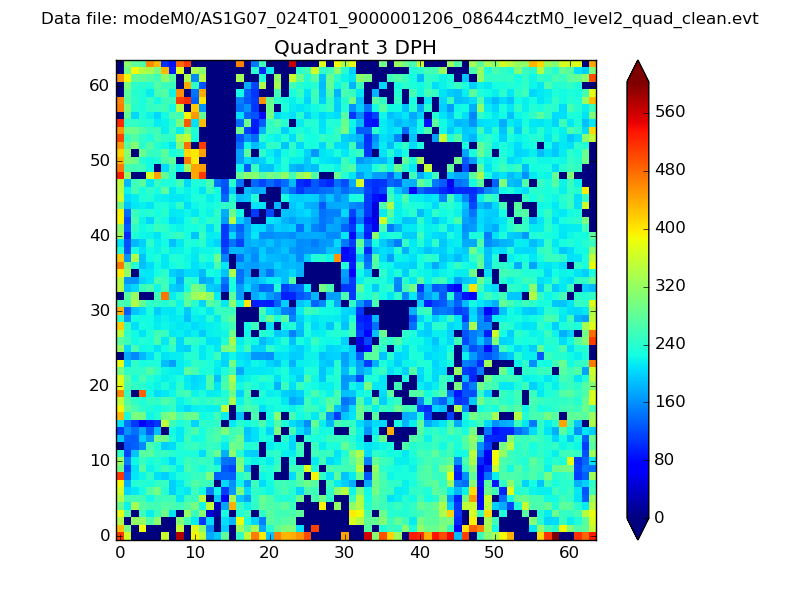 |
 |
Quadrant C |
| Plot type | Count rate plots | Images |
|---|---|---|
| Comparison with Poisson distribution Blue bars denote a histogram of data divided into 1 sec bins. Red curve is a Poisson curve with rate = median count rate of data. |
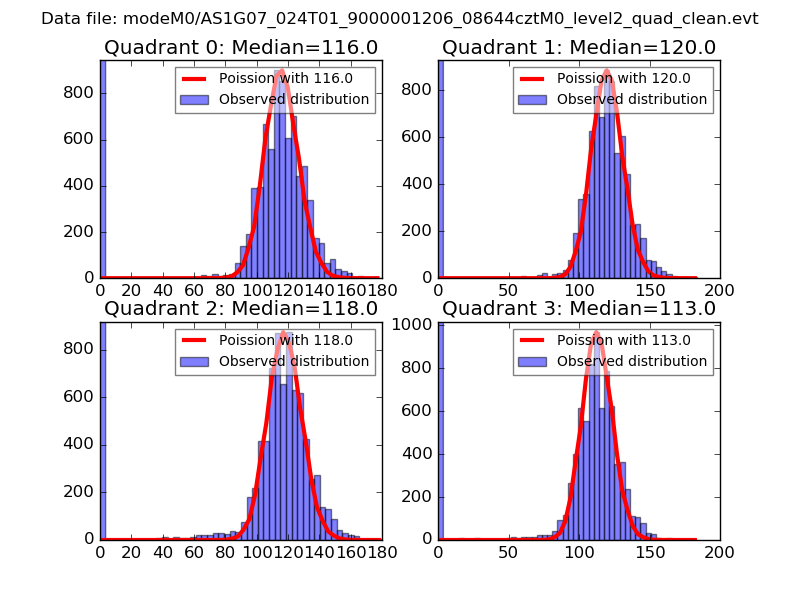 |
 |
| Quadrant-wise count rates Data is divided into 100 sec bins |
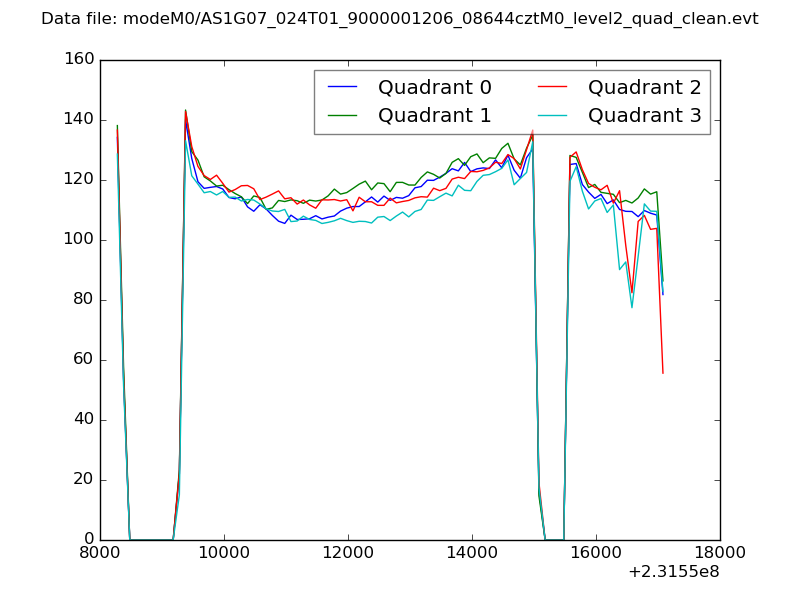 |
|
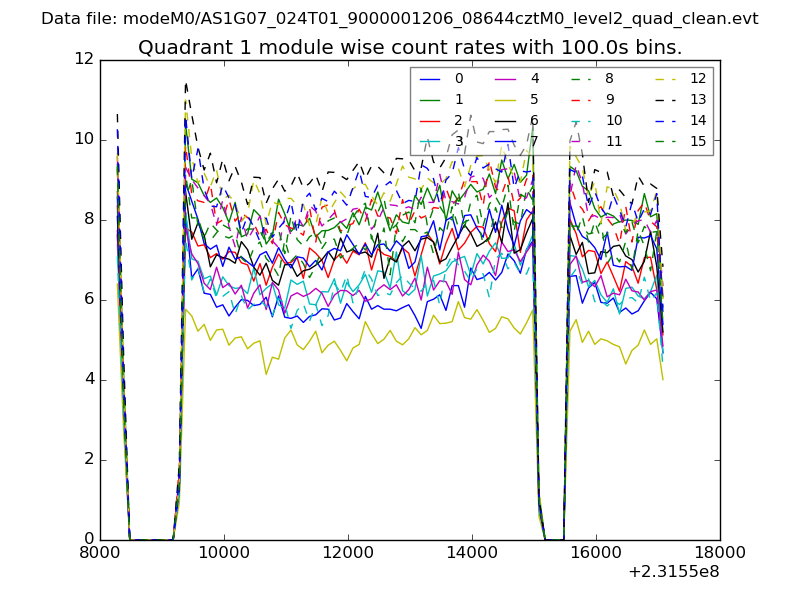
| Module-wise count rates for Quadrant A Data is divided into 100 sec bins |
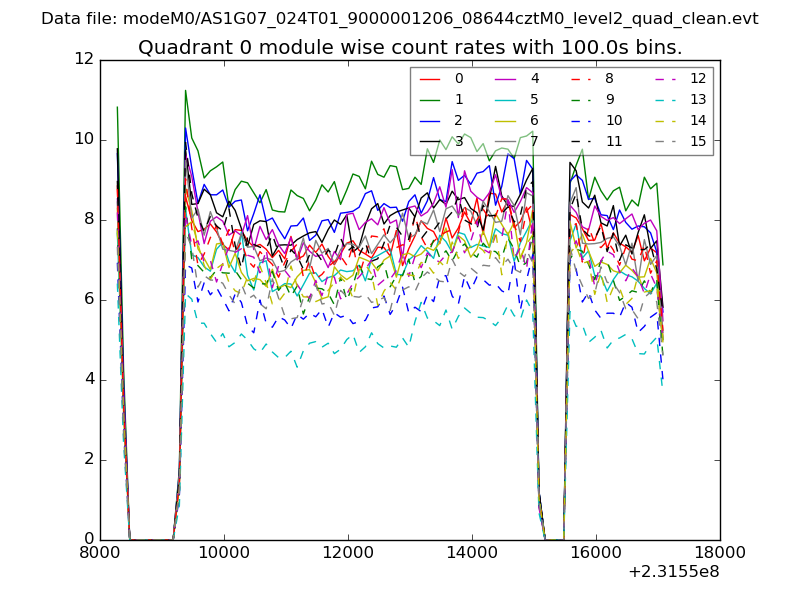 |
 |
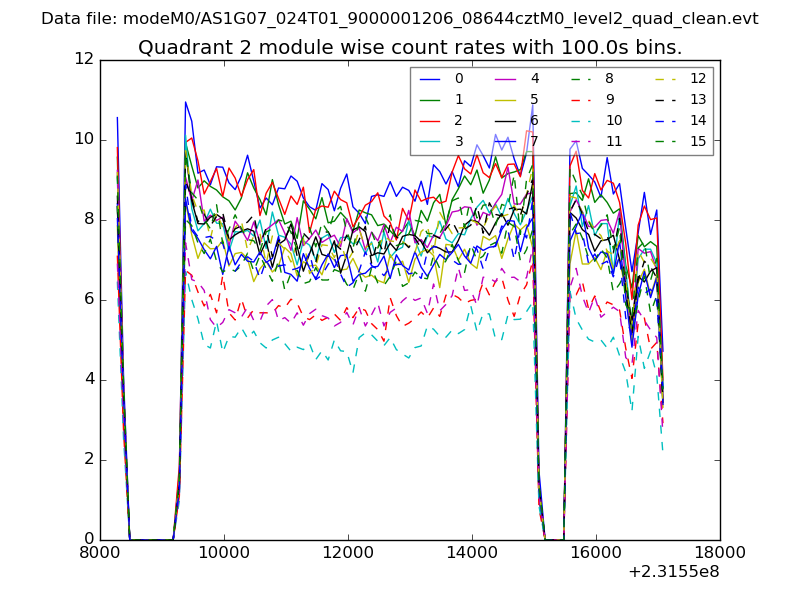
| Module-wise count rates for Quadrant B Data is divided into 100 sec bins |
 |
 |
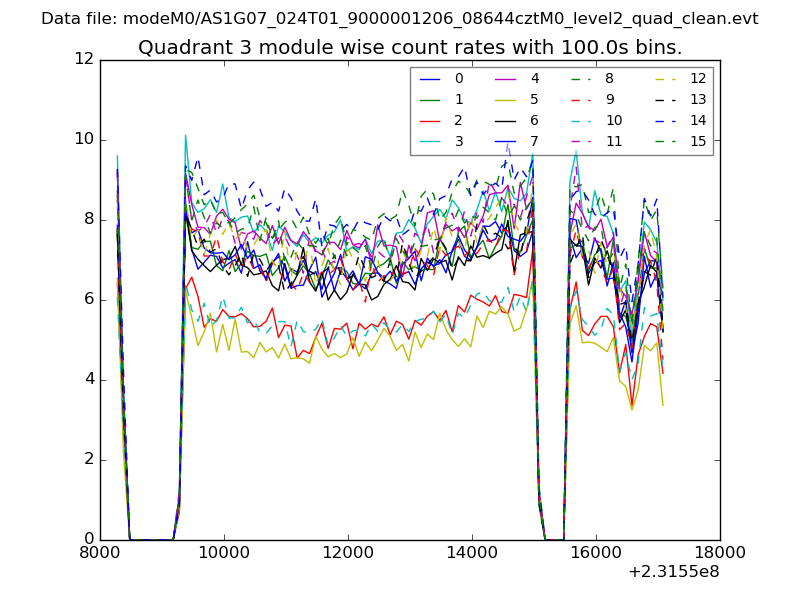
| Module-wise count rates for Quadrant C Data is divided into 100 sec bins |
 |
 |
| Module-wise count rates for Quadrant D Data is divided into 100 sec bins |
 |
 |
| Parameter | Plot |
|---|---|
| CZT HV Monitor | 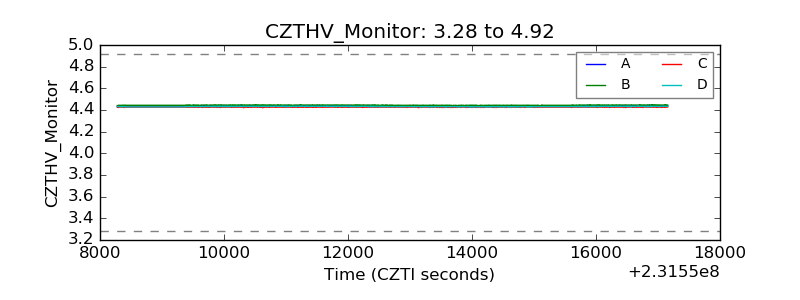 |
| D_VDD | 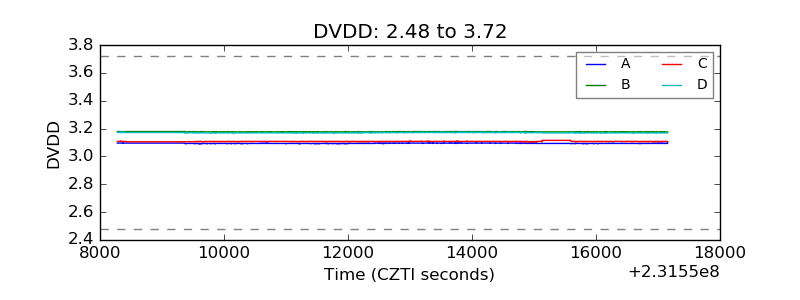 |
| Temperature 1 | 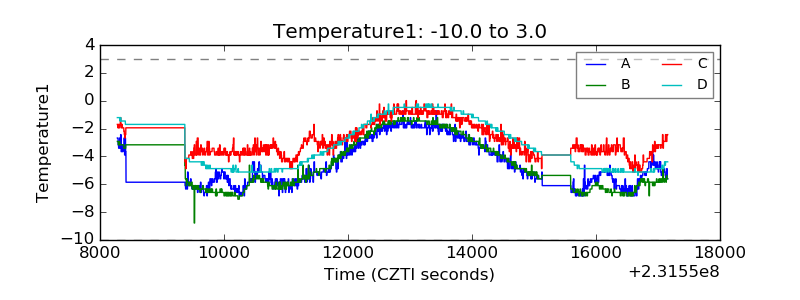 |
| Veto HV Monitor |  |
| Veto LLD | 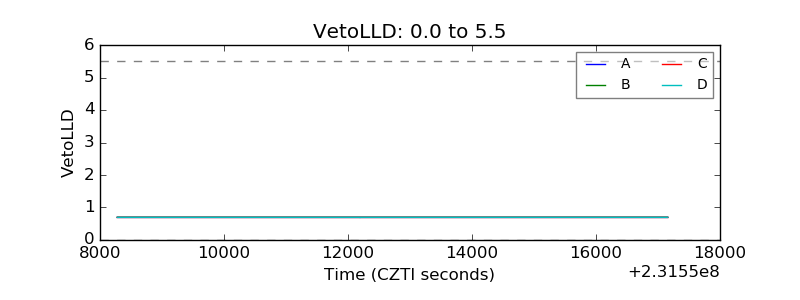 |
| Alpha Counter | 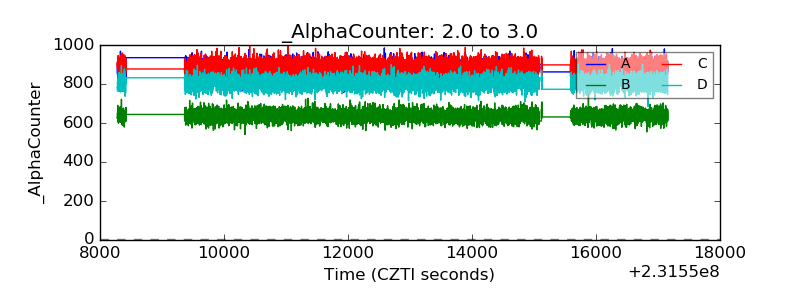 |
| _CPM_Rate | 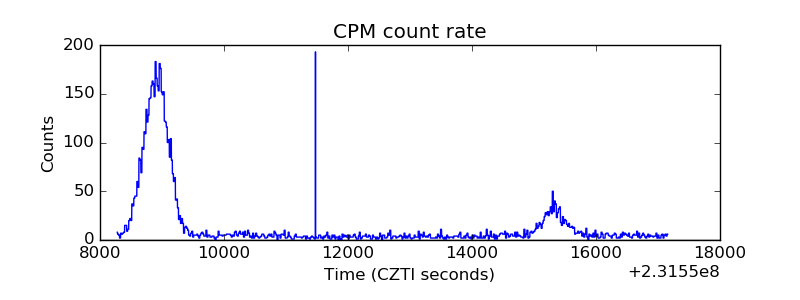 |
| CZT Counter | 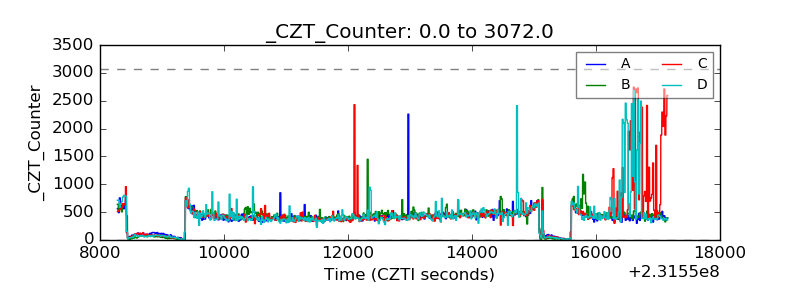 |
| +2.5 Volts monitor |  |
| +5 Volts monitor |  |
| _ROLL_ROT | 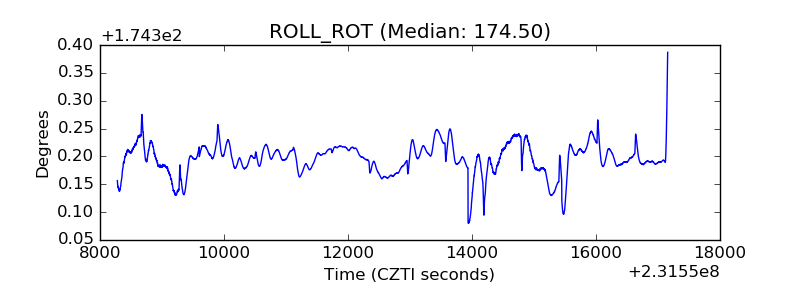 |
| _Roll_DEC |  |
| _Roll_RA | 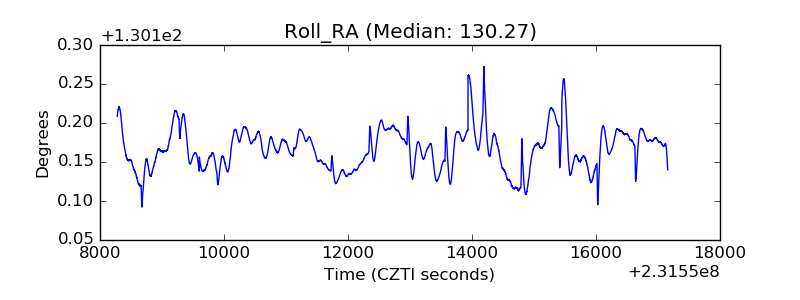 |
| Veto Counter | 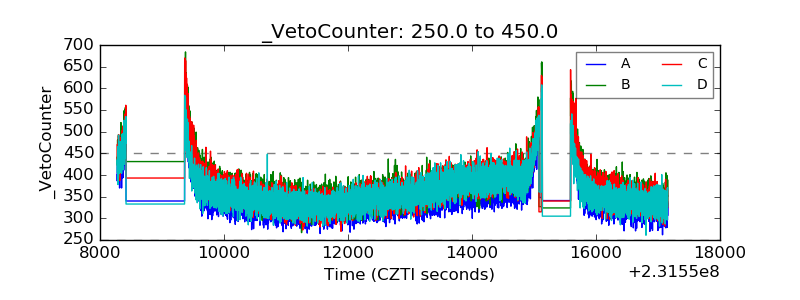 |