| Param | Original file | Final file |
|---|---|---|
| Filename | modeM0/AS1G07_024T01_9000001206_08645cztM0_level2.evt | modeM0/AS1G07_024T01_9000001206_08645cztM0_level2_quad_clean.evt |
| Size (bytes) | 692,176,320 | 117,967,680 |
| Size | 660.1 MB | 112.5 MB |
| Events in quadrant A | 3,109,578 | 812,883 |
| Events in quadrant B | 3,341,140 | 844,596 |
| Events in quadrant C | 7,399,623 | 699,446 |
| Events in quadrant D | 6,633,127 | 722,215 |
| Mode M0 | |||
|---|---|---|---|
| Quadrant | BADHDUFLAG | Total packets | Discarded packets |
| A | 0 | 14547 | 12 |
| B | 0 | 14919 | 3 |
| C | 0 | 26905 | 37 |
| D | 0 | 24947 | 32 |
| Mode SS | |||
|---|---|---|---|
| Quadrant | BADHDUFLAG | Total packets | Discarded packets |
| A | 0 | 142 | 0 |
| B | 0 | 142 | 0 |
| C | 0 | 142 | 0 |
| D | 0 | 142 | 0 |
| Quadrant | Total seconds | Saturated seconds | Saturation percentage |
|---|---|---|---|
| A | 7066 | 184 | 2.604019% |
| B | 7070 | 216 | 3.055163% |
| C | 7063 | 1659 | 23.488603% |
| D | 7063 | 1298 | 18.377460% |
Noise dominated data is calculated using 1-second bins in cleaned event files. If a bin has >2000 counts, and if more than 50% of those come from <1% of pixels, then it is considered to be noise-dominated and hence unusable.
| Quadrant | # 1 sec bins | Bins with >0 counts | Bins with >2000 counts | High rate bins dominated by noise | Noise dominated (total time) | Noise dominated (detector-on time) | Marked lightcurve |
|---|---|---|---|---|---|---|---|
| A | 7091 | 7072 | 0 | 0 | 0.00% | 0.00% |  |
| B | 7091 | 7071 | 11 | 11 | 0.16% | 0.16% |  |
| C | 7091 | 7072 | 1337 | 1337 | 18.85% | 18.91% | 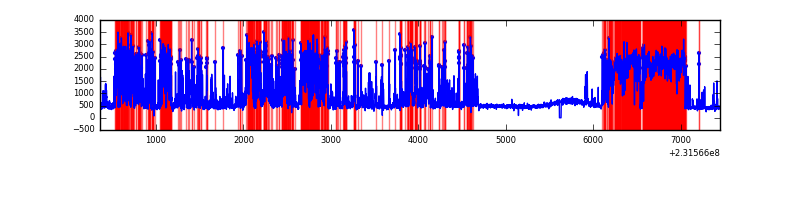 |
| D | 7091 | 7071 | 1027 | 1027 | 14.48% | 14.52% | 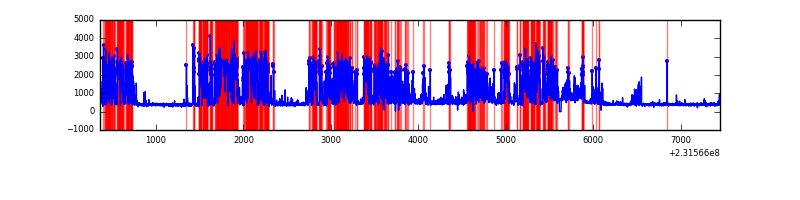 |
Top three noisy pixels from each quadrant. If the there are fewer than three noisy pixels in the level2.evt file, extra rows are filled as -1
| Pixel properties | Quadrant properties | ||||||
|---|---|---|---|---|---|---|---|
| Quadrant | DetID | PixID | Counts | Sigma | Mean | Median | Sigma |
| A | 15 | 174 | 25829 | 154.37 | 794 | 776 | 162.3 |
| A | 5 | 16 | 14238 | 82.95 | 794 | 776 | 162.3 |
| A | 13 | 251 | 11684 | 67.21 | 794 | 776 | 162.3 |
| B | 4 | 48 | 59064 | 377.79 | 804 | 781 | 154.3 |
| B | 0 | 214 | 51575 | 329.25 | 804 | 781 | 154.3 |
| B | 15 | 85 | 25037 | 157.23 | 804 | 781 | 154.3 |
| C | 4 | 254 | 4746224 | 30732.71 | 674 | 676 | 154.4 |
| C | 4 | 238 | 8471 | 50.48 | 674 | 676 | 154.4 |
| C | 13 | 61 | 5206 | 29.34 | 674 | 676 | 154.4 |
| D | 0 | 11 | 3271138 | 18703.3 | 712 | 687 | 174.9 |
| D | 13 | 29 | 411570 | 2349.79 | 712 | 687 | 174.9 |
| D | 10 | 253 | 110702 | 629.16 | 712 | 687 | 174.9 |
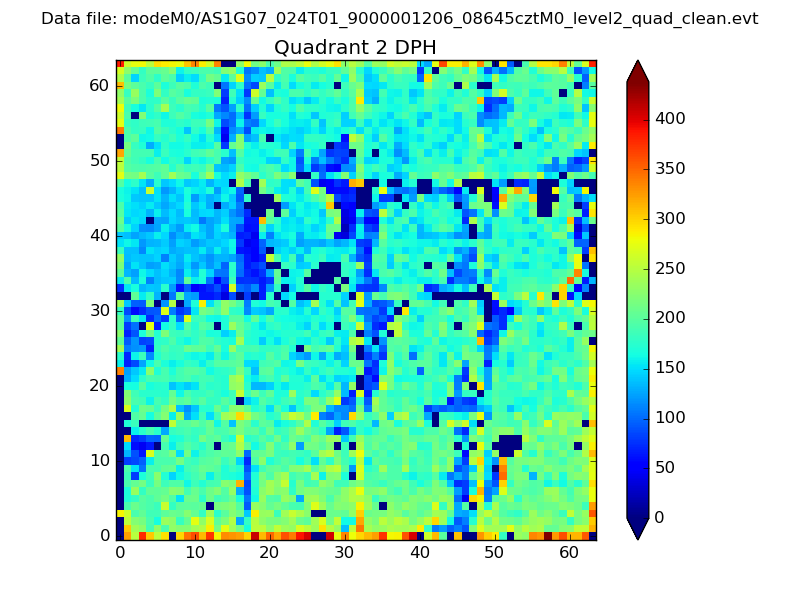
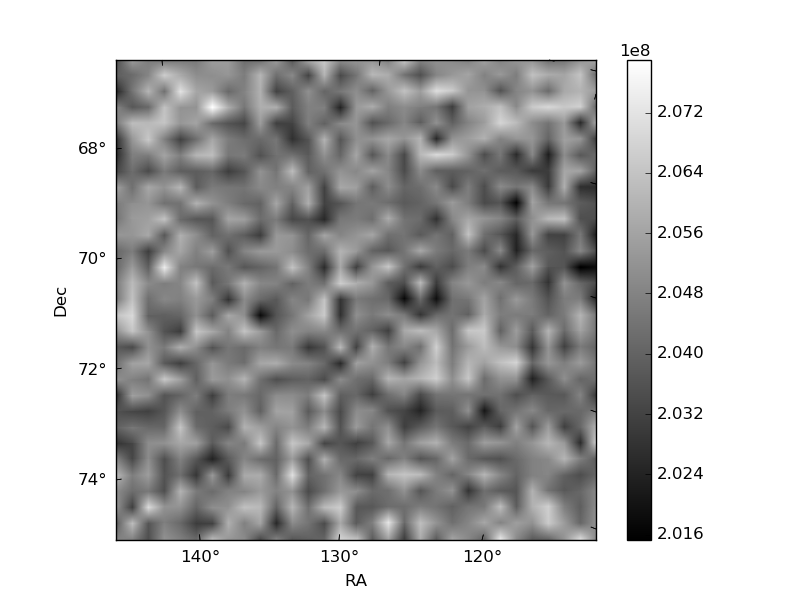
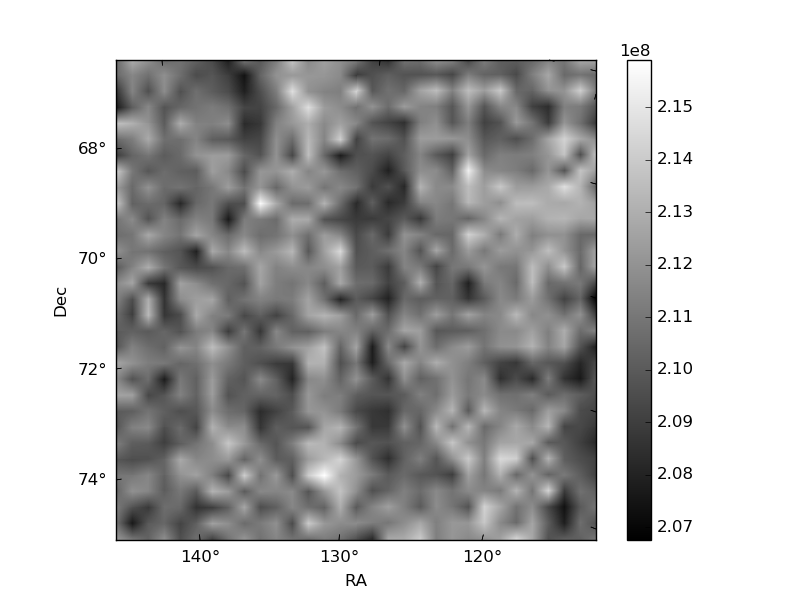
Histogram calculated using DETX and DETY for each event in the final _common_clean file
| Quadrant A | 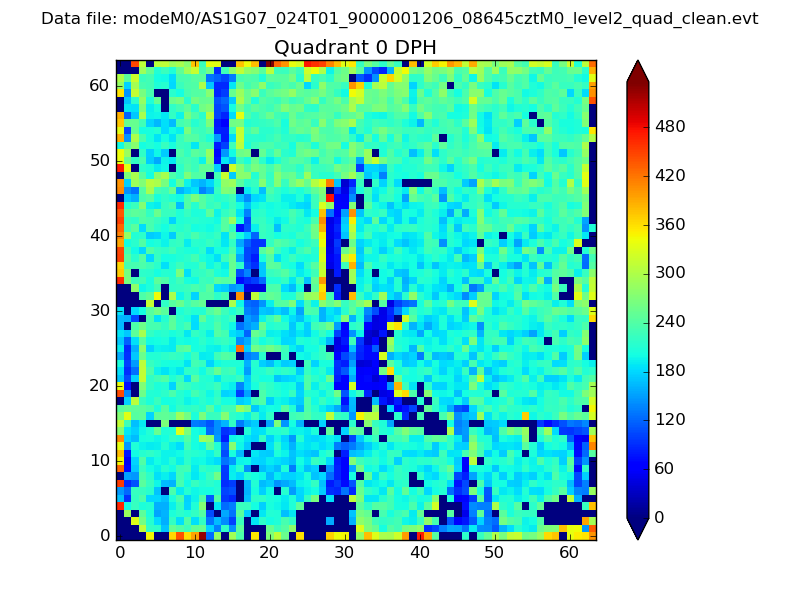 |
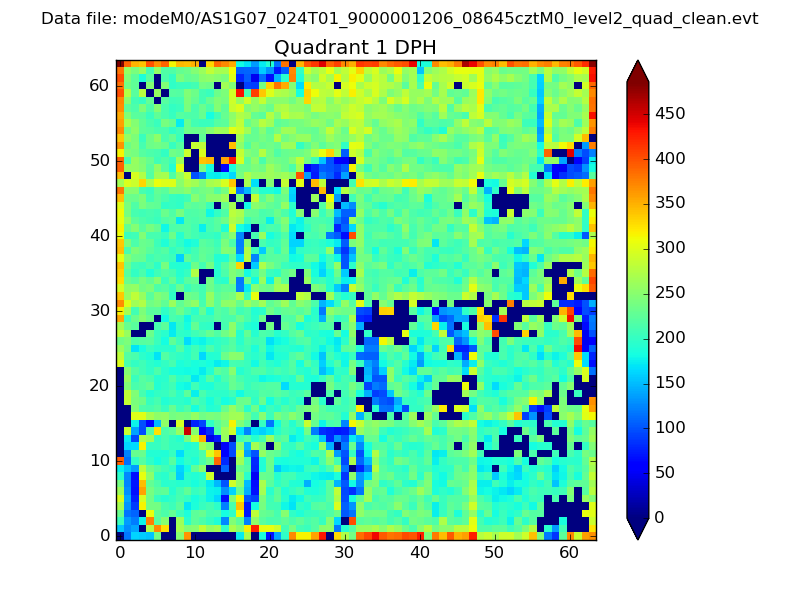 |
Quadrant B |
|---|---|---|---|
| Quadrant D | 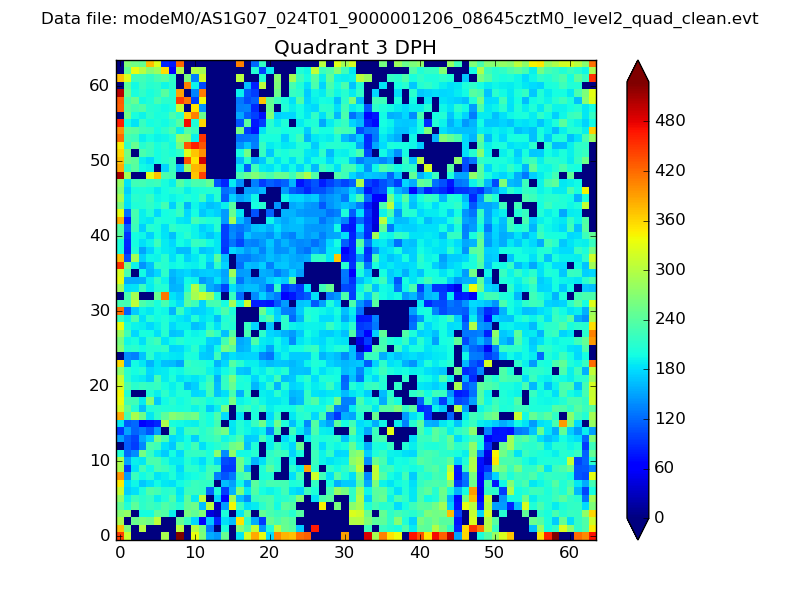 |
 |
Quadrant C |
| Plot type | Count rate plots | Images |
|---|---|---|
| Comparison with Poisson distribution Blue bars denote a histogram of data divided into 1 sec bins. Red curve is a Poisson curve with rate = median count rate of data. |
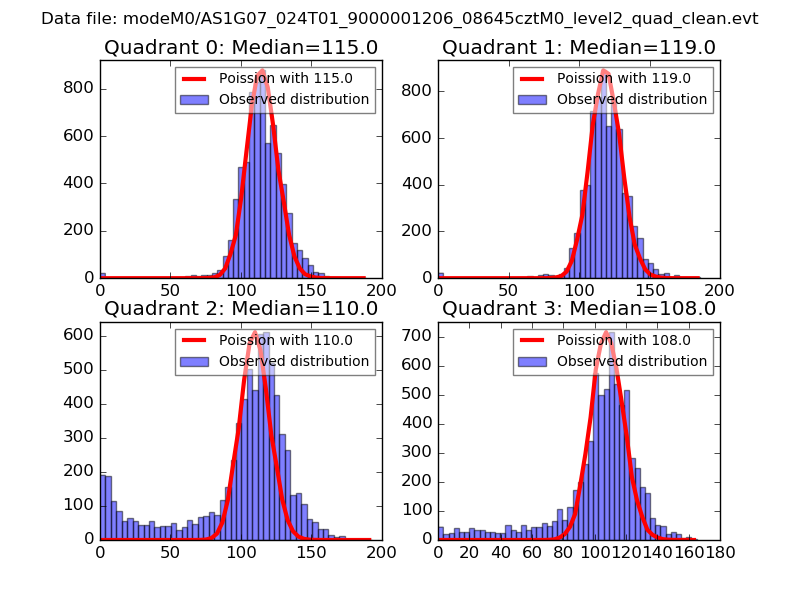 |
 |
| Quadrant-wise count rates Data is divided into 100 sec bins |
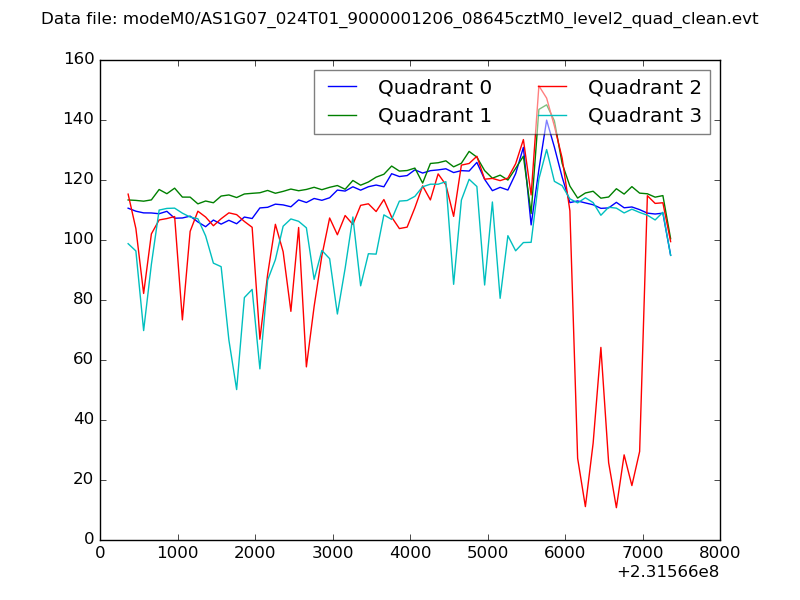 |
|
| Module-wise count rates for Quadrant A Data is divided into 100 sec bins |
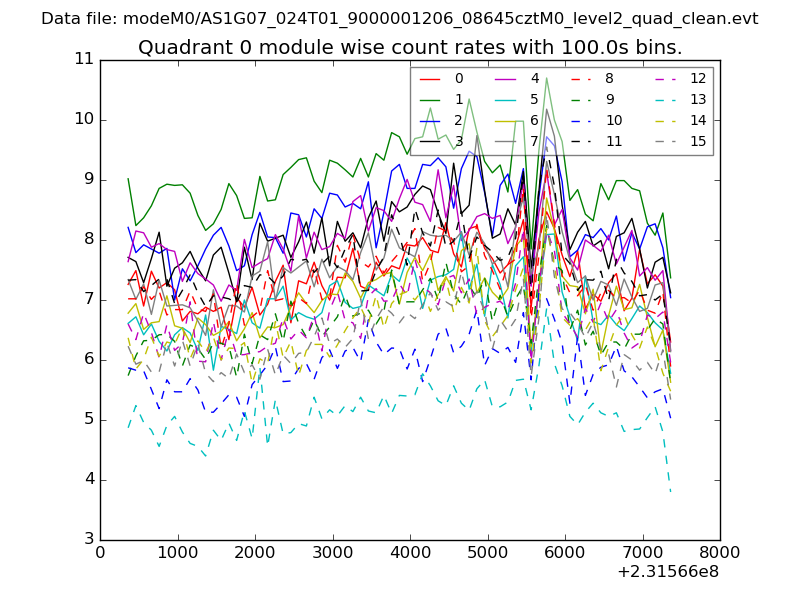 |
 |
| Module-wise count rates for Quadrant B Data is divided into 100 sec bins |
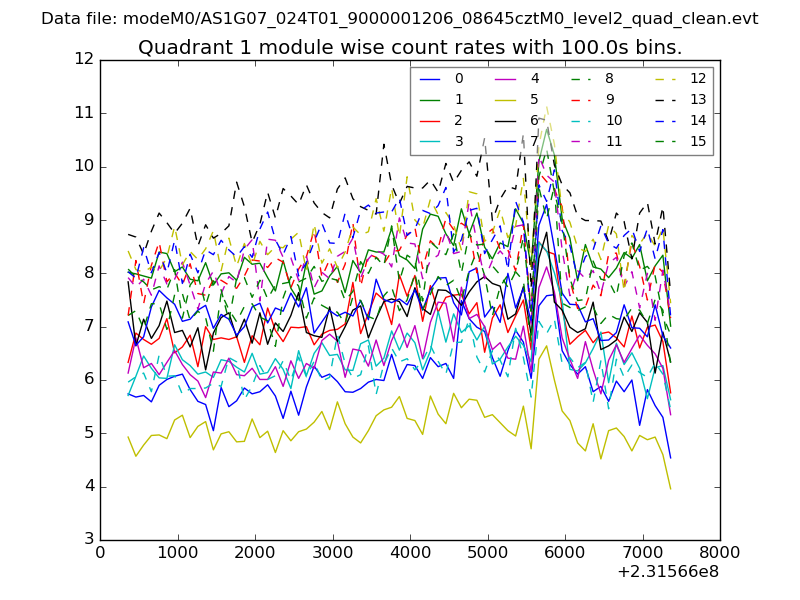 |
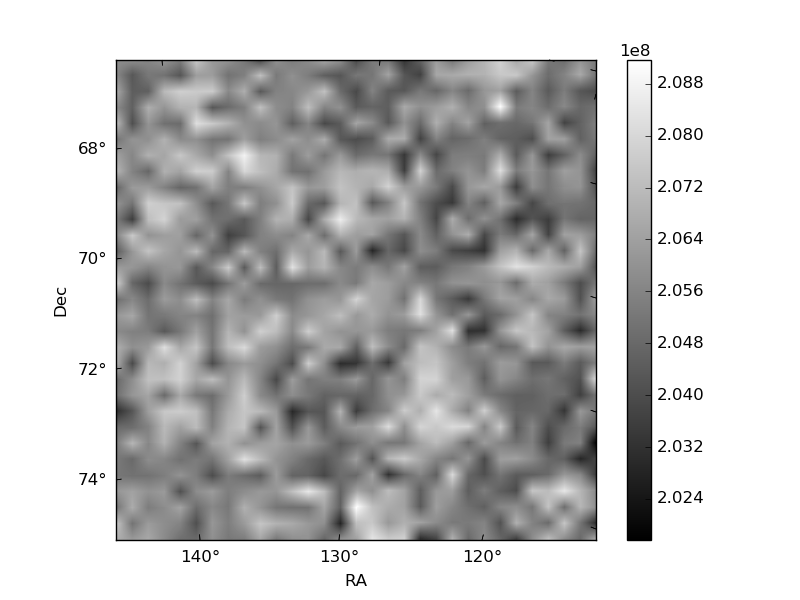 |
| Module-wise count rates for Quadrant C Data is divided into 100 sec bins |
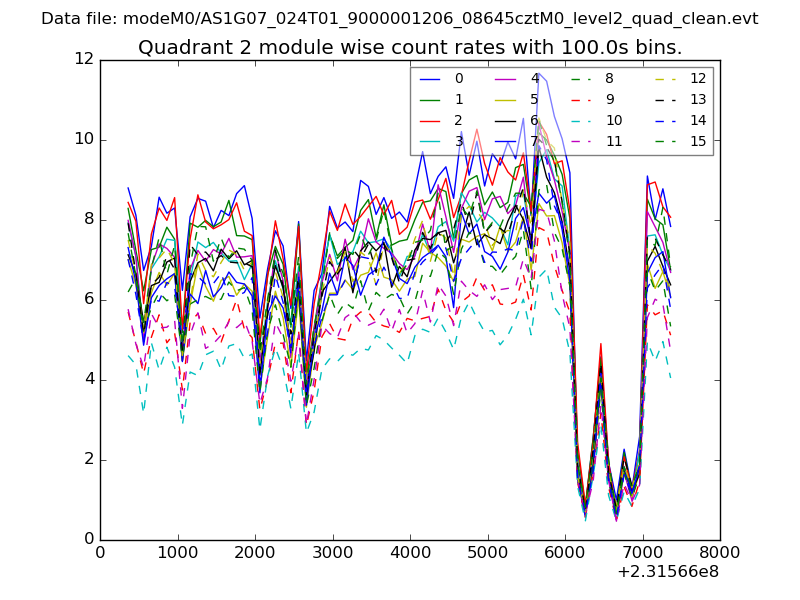 |
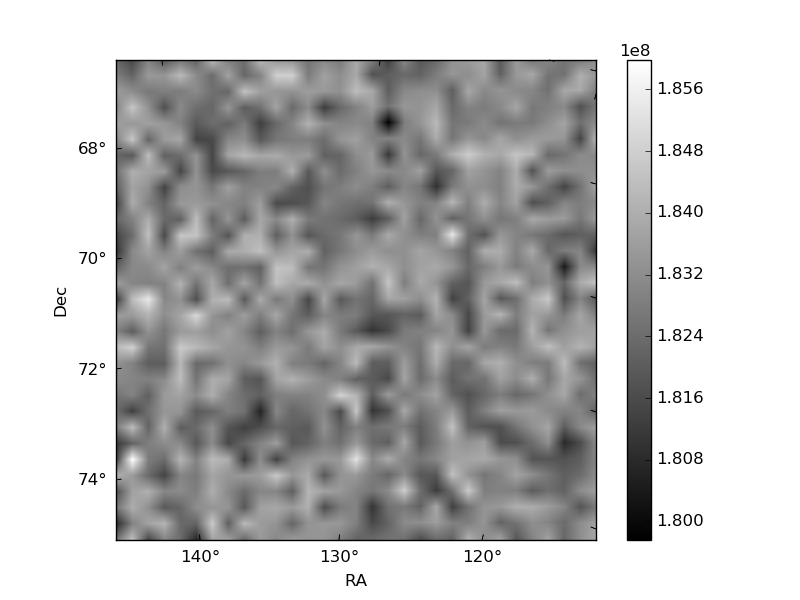 |
| Module-wise count rates for Quadrant D Data is divided into 100 sec bins |
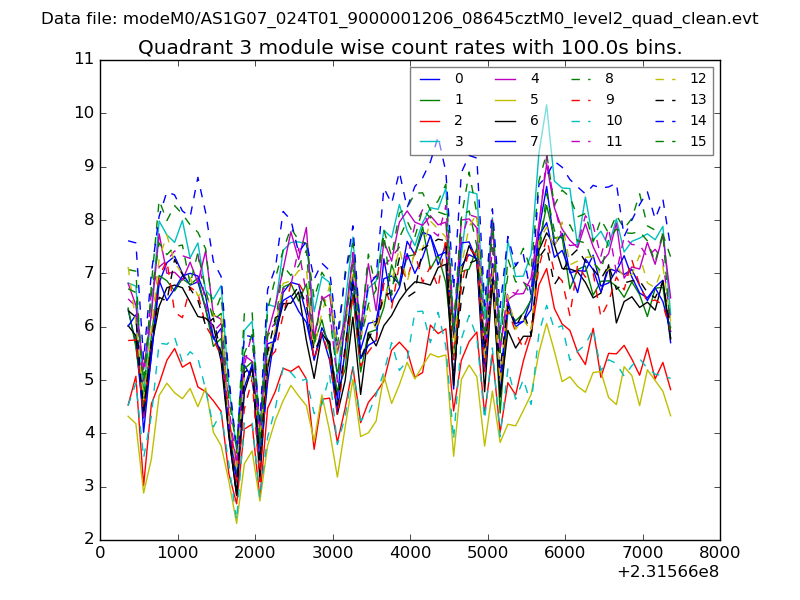 |
 |
| Parameter | Plot |
|---|---|
| CZT HV Monitor | 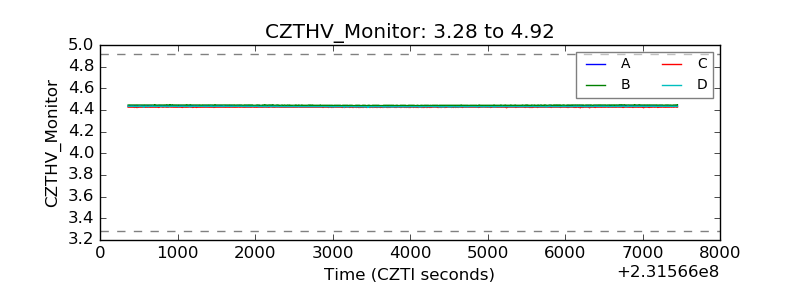 |
| D_VDD | 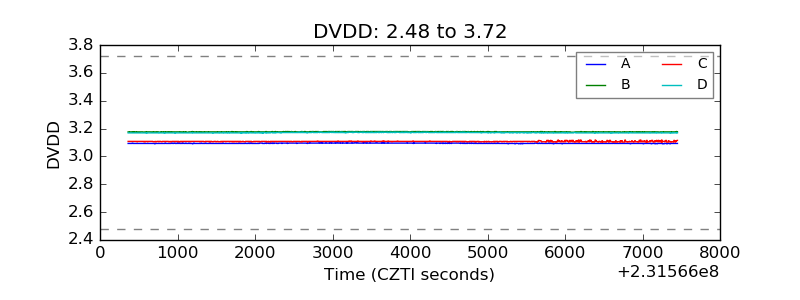 |
| Temperature 1 | 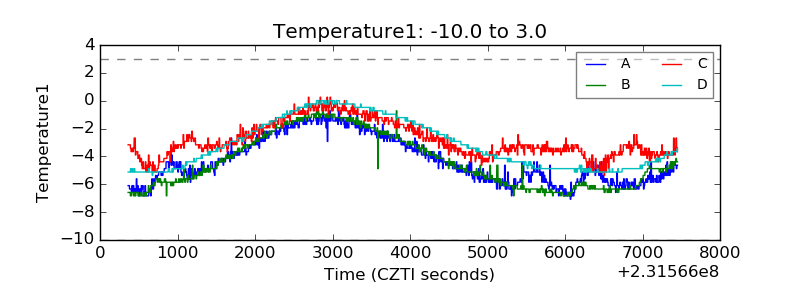 |
| Veto HV Monitor |  |
| Veto LLD | 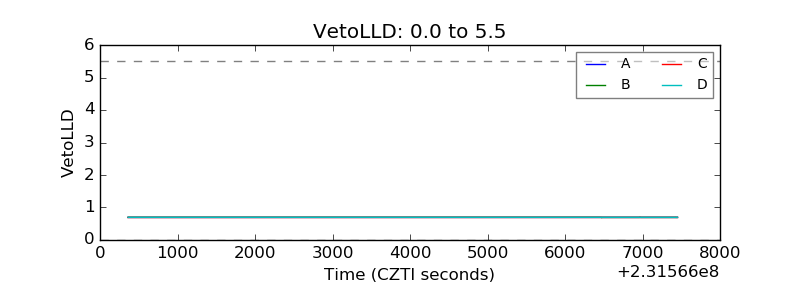 |
| Alpha Counter | 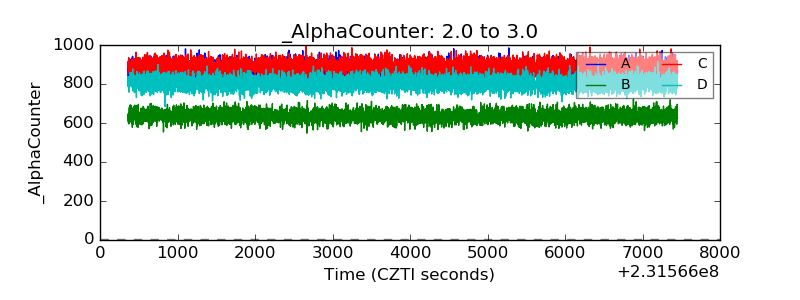 |
| _CPM_Rate | 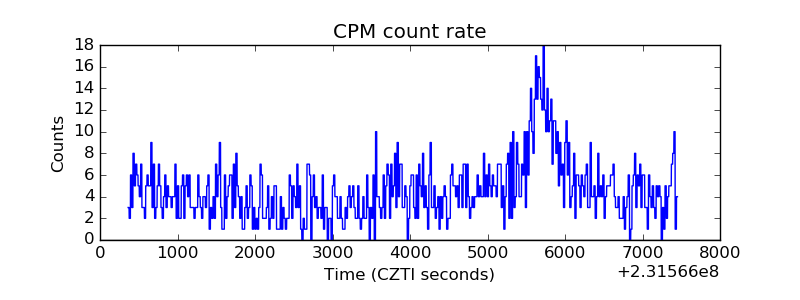 |
| CZT Counter | 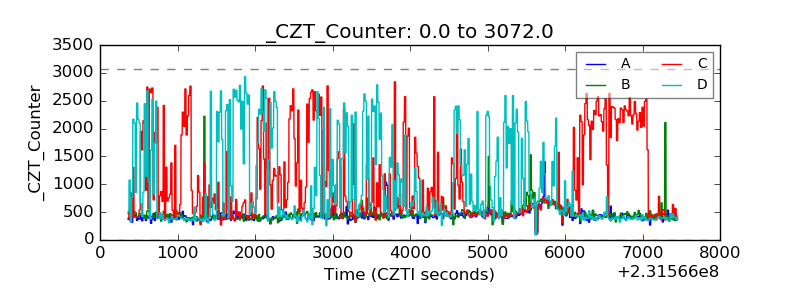 |
| +2.5 Volts monitor |  |
| +5 Volts monitor |  |
| _ROLL_ROT | 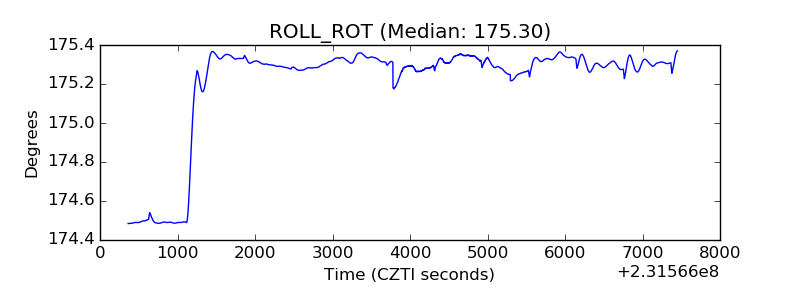 |
| _Roll_DEC | 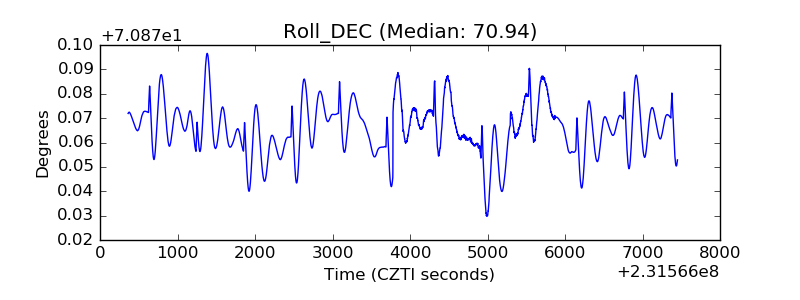 |
| _Roll_RA | 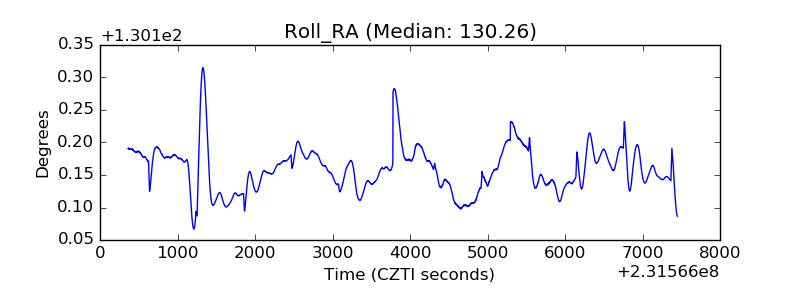 |
| Veto Counter | 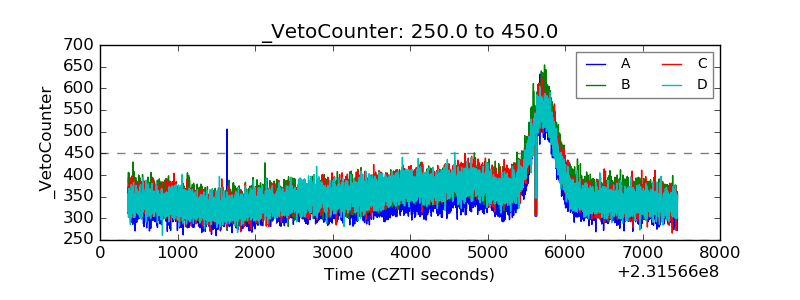 |