| Param | Original file | Final file |
|---|---|---|
| Filename | modeM0/AS1G07_024T01_9000001206_08646cztM0_level2.evt | modeM0/AS1G07_024T01_9000001206_08646cztM0_level2_quad_clean.evt |
| Size (bytes) | 485,478,720 | 120,240,000 |
| Size | 463.0 MB | 114.7 MB |
| Events in quadrant A | 3,082,080 | 800,239 |
| Events in quadrant B | 3,289,475 | 828,002 |
| Events in quadrant C | 4,402,281 | 756,628 |
| Events in quadrant D | 3,455,331 | 771,376 |
| Mode M0 | |||
|---|---|---|---|
| Quadrant | BADHDUFLAG | Total packets | Discarded packets |
| A | 0 | 14365 | 15 |
| B | 0 | 14581 | 20 |
| C | 0 | 18182 | 67 |
| D | 0 | 15594 | 47 |
| Mode M9 | |||
|---|---|---|---|
| Quadrant | BADHDUFLAG | Total packets | Discarded packets |
| A | 0 | 3 | 0 |
| B | 0 | 3 | 0 |
| C | 0 | 3 | 0 |
| D | 0 | 3 | 0 |
| Mode SS | |||
|---|---|---|---|
| Quadrant | BADHDUFLAG | Total packets | Discarded packets |
| A | 0 | 140 | 2 |
| B | 0 | 140 | 0 |
| C | 0 | 140 | 0 |
| D | 0 | 140 | 0 |
| Quadrant | Total seconds | Saturated seconds | Saturation percentage |
|---|---|---|---|
| A | 6978 | 117 | 1.676698% |
| B | 6975 | 102 | 1.462366% |
| C | 6967 | 618 | 8.870389% |
| D | 6967 | 104 | 1.492752% |
Noise dominated data is calculated using 1-second bins in cleaned event files. If a bin has >2000 counts, and if more than 50% of those come from <1% of pixels, then it is considered to be noise-dominated and hence unusable.
| Quadrant | # 1 sec bins | Bins with >0 counts | Bins with >2000 counts | High rate bins dominated by noise | Noise dominated (total time) | Noise dominated (detector-on time) | Marked lightcurve |
|---|---|---|---|---|---|---|---|
| A | 7195 | 6986 | 9 | 9 | 0.13% | 0.13% | 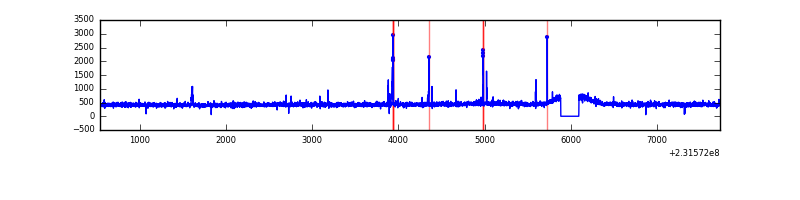 |
| B | 7195 | 6986 | 7 | 7 | 0.10% | 0.10% | 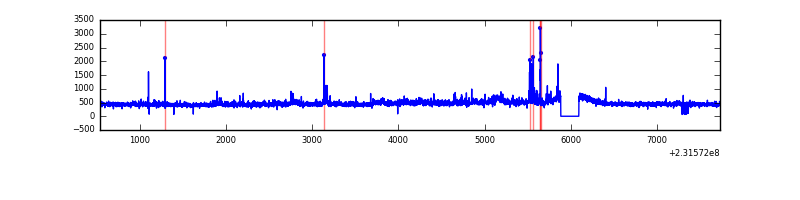 |
| C | 7195 | 6981 | 491 | 491 | 6.82% | 7.03% | 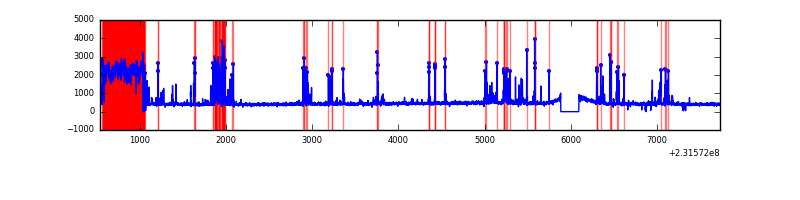 |
| D | 7195 | 6986 | 42 | 42 | 0.58% | 0.60% | 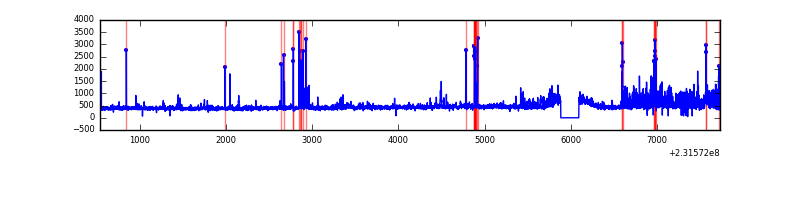 |
Top three noisy pixels from each quadrant. If the there are fewer than three noisy pixels in the level2.evt file, extra rows are filled as -1
| Pixel properties | Quadrant properties | ||||||
|---|---|---|---|---|---|---|---|
| Quadrant | DetID | PixID | Counts | Sigma | Mean | Median | Sigma |
| A | 15 | 174 | 51155 | 314.21 | 781 | 762 | 160.4 |
| A | 5 | 16 | 18175 | 108.57 | 781 | 762 | 160.4 |
| A | 0 | 226 | 7471 | 41.83 | 781 | 762 | 160.4 |
| B | 0 | 219 | 57430 | 375.02 | 791 | 772 | 151.1 |
| B | 4 | 48 | 33485 | 216.53 | 791 | 772 | 151.1 |
| B | 10 | 252 | 32536 | 210.25 | 791 | 772 | 151.1 |
| C | 4 | 254 | 1574077 | 9497.06 | 717 | 717 | 165.7 |
| C | 8 | 128 | 8298 | 45.76 | 717 | 717 | 165.7 |
| C | 4 | 238 | 6617 | 35.61 | 717 | 717 | 165.7 |
| D | 1 | 52 | 368109 | 1991.06 | 755 | 729 | 184.5 |
| D | 10 | 253 | 115715 | 623.18 | 755 | 729 | 184.5 |
| D | 7 | 71 | 32625 | 172.86 | 755 | 729 | 184.5 |
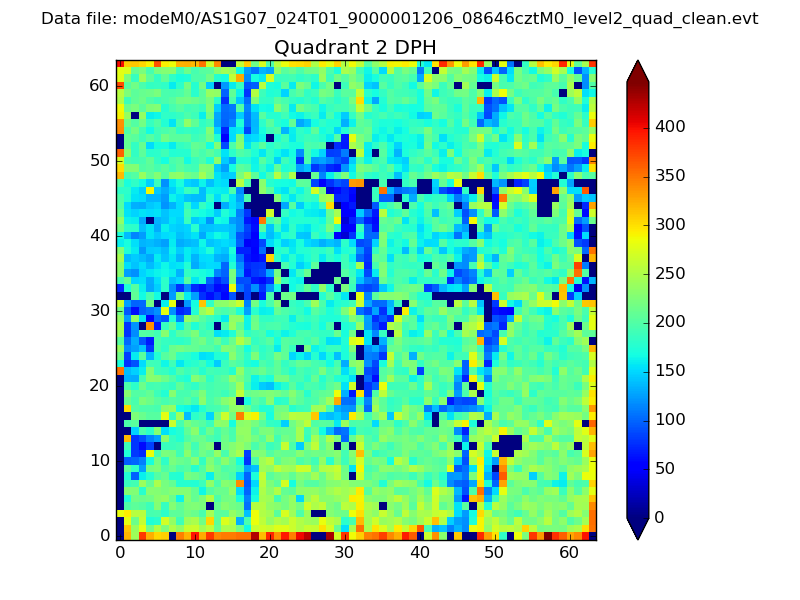
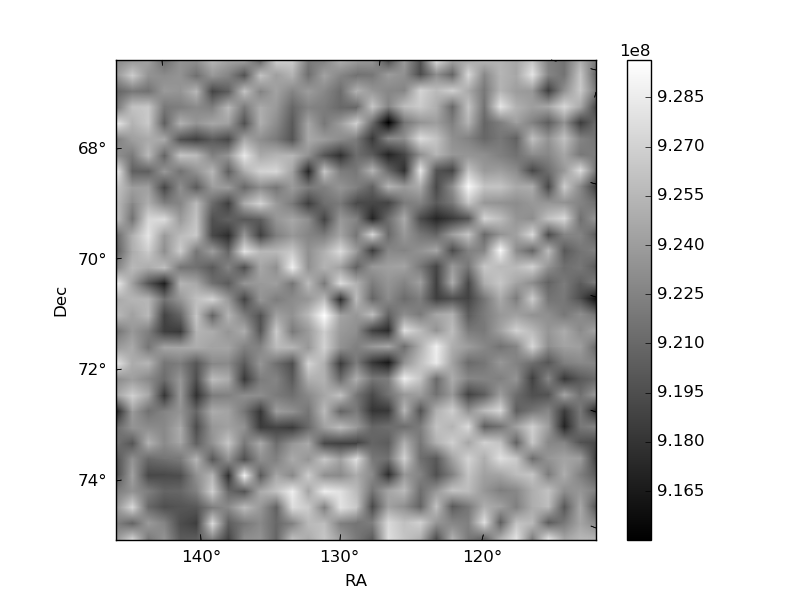
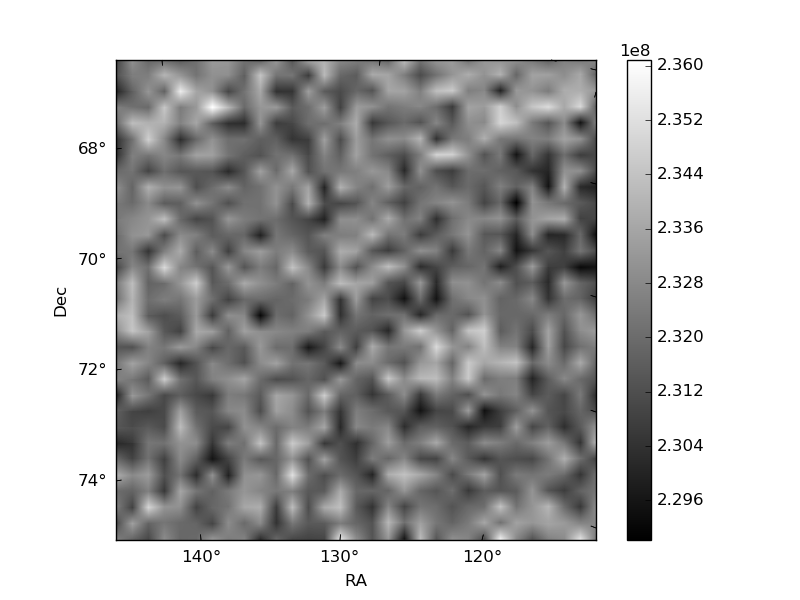
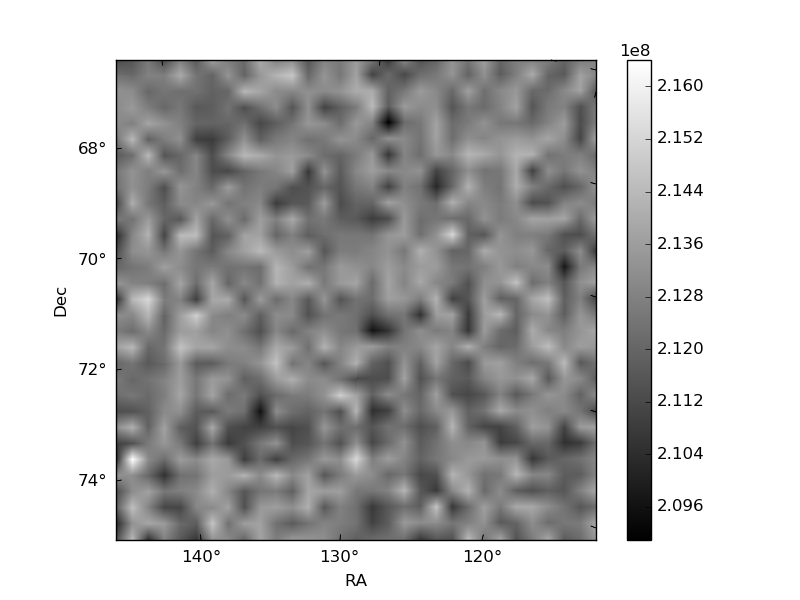
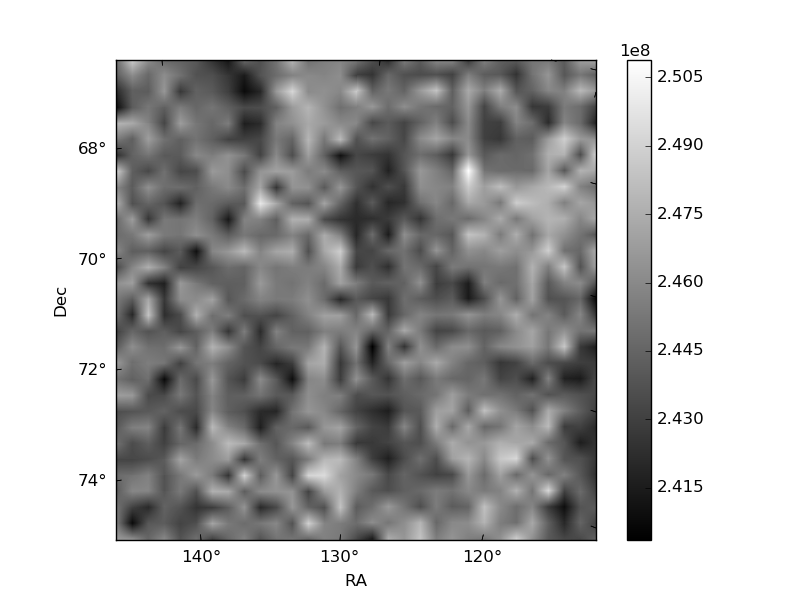
Histogram calculated using DETX and DETY for each event in the final _common_clean file
| Quadrant A | 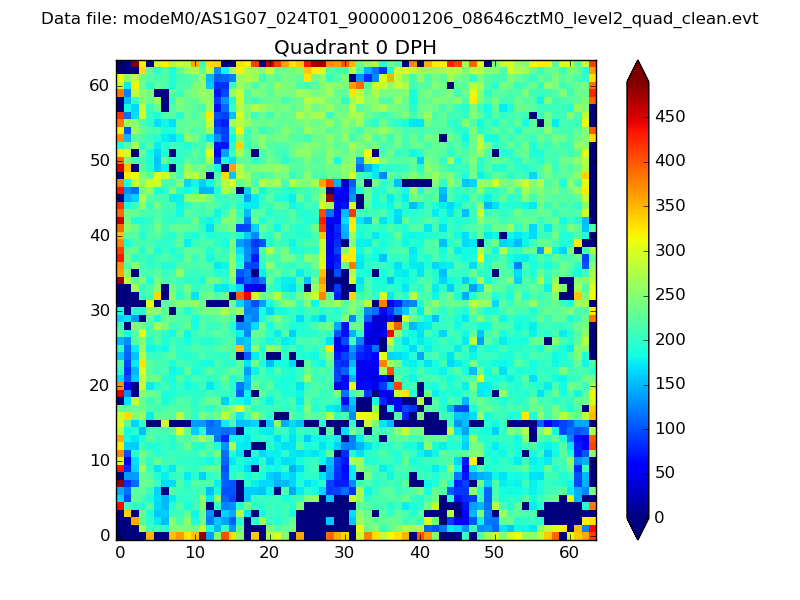 |
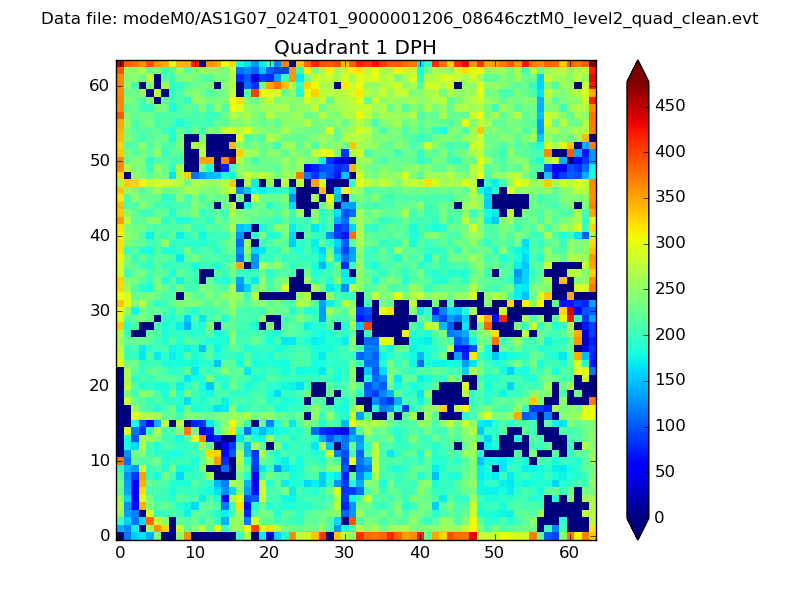 |
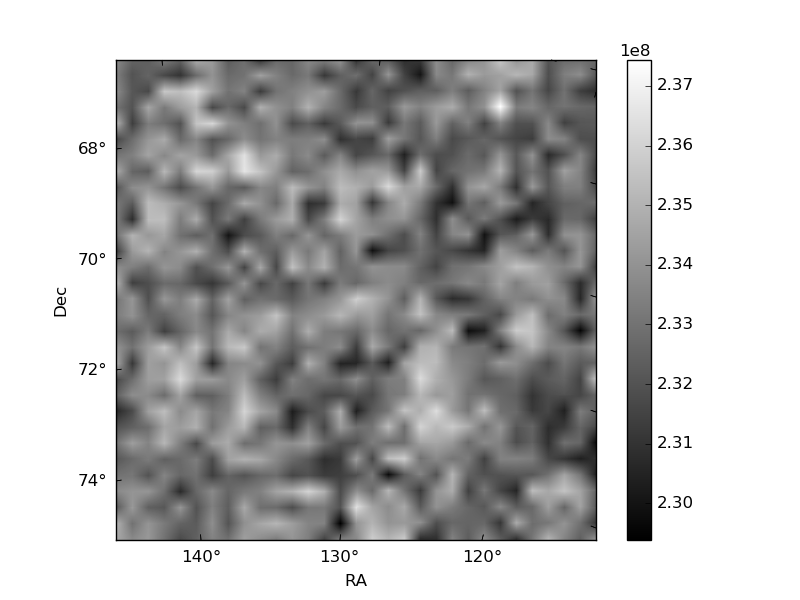
Quadrant B |
|---|---|---|---|
| Quadrant D | 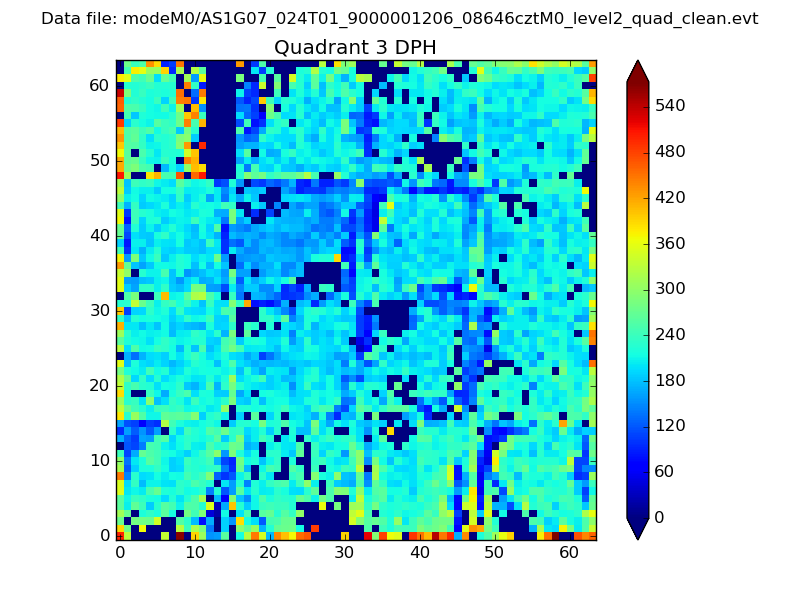 |
 |
Quadrant C |
| Plot type | Count rate plots | Images |
|---|---|---|
| Comparison with Poisson distribution Blue bars denote a histogram of data divided into 1 sec bins. Red curve is a Poisson curve with rate = median count rate of data. |
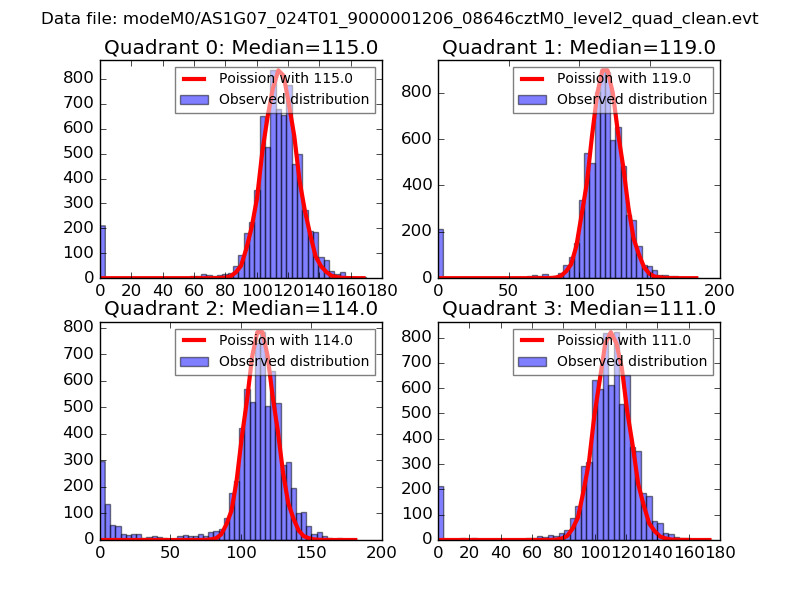 |
 |
| Quadrant-wise count rates Data is divided into 100 sec bins |
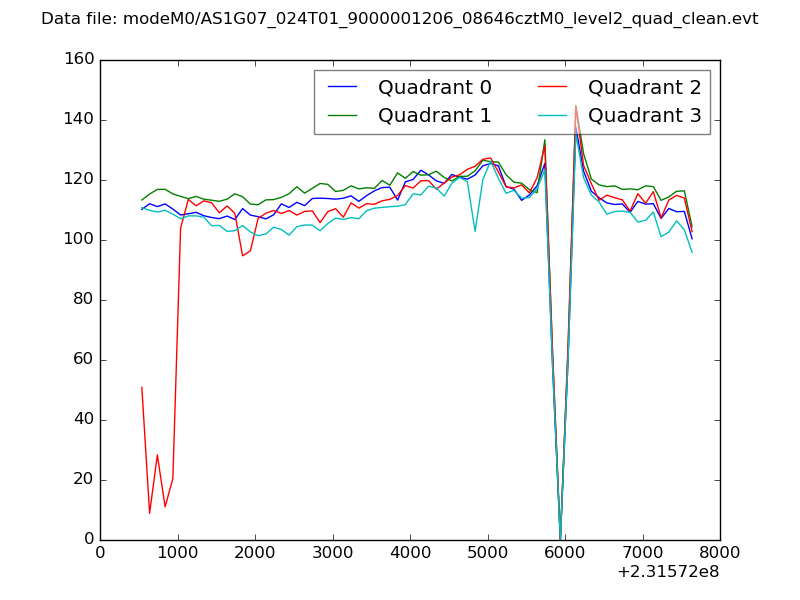 |
|
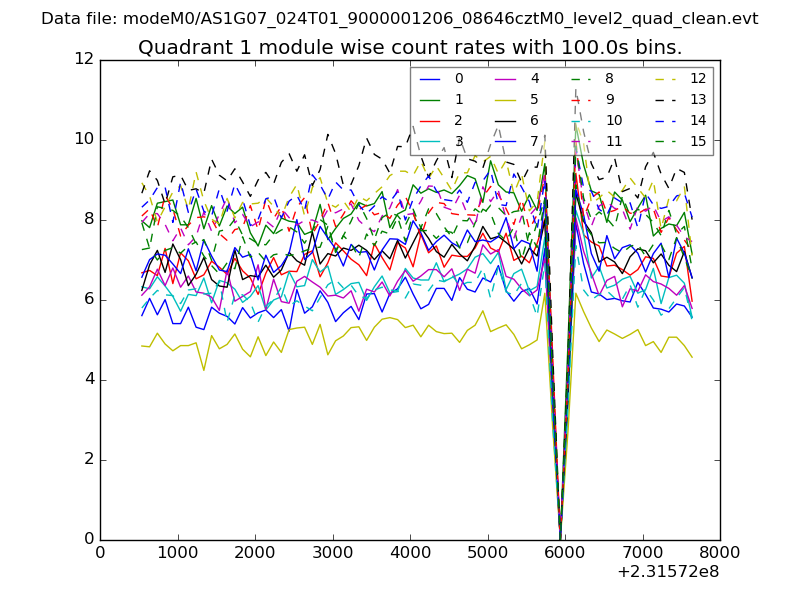
| Module-wise count rates for Quadrant A Data is divided into 100 sec bins |
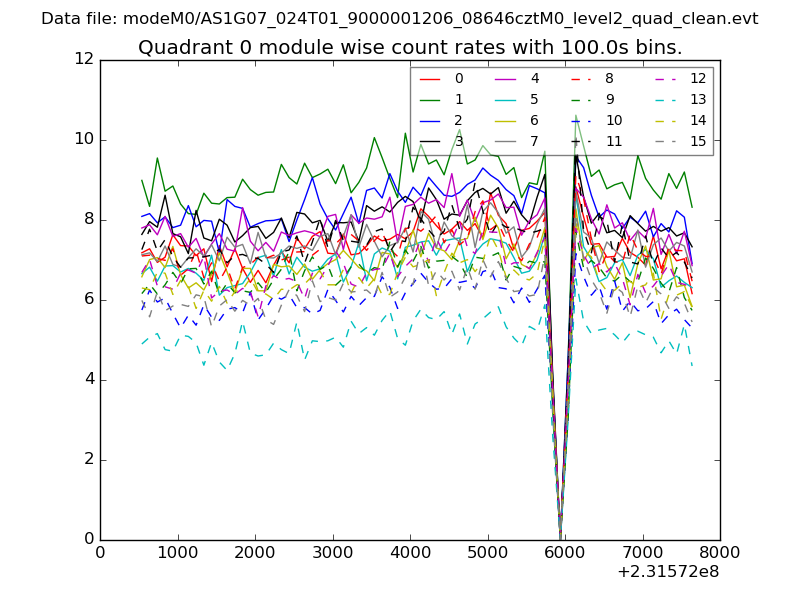 |
 |
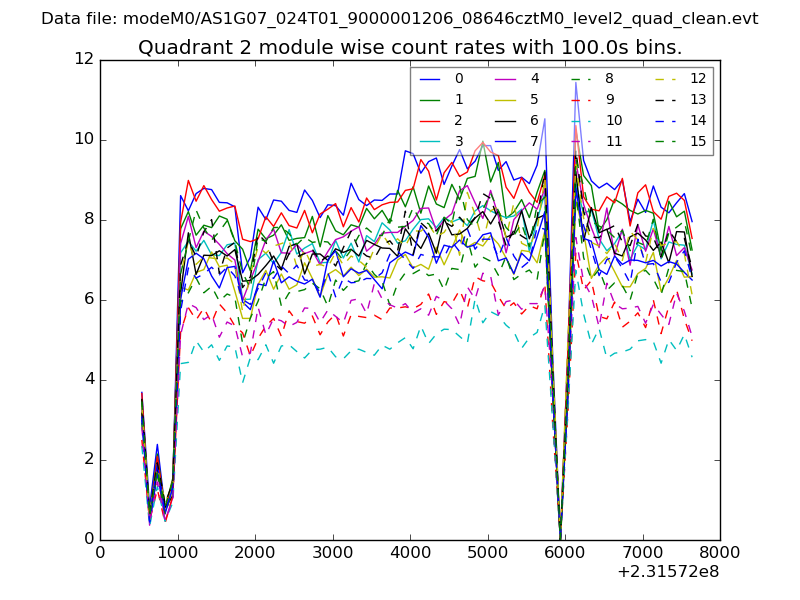
| Module-wise count rates for Quadrant B Data is divided into 100 sec bins |
 |
 |
| Module-wise count rates for Quadrant C Data is divided into 100 sec bins |
 |
 |
| Module-wise count rates for Quadrant D Data is divided into 100 sec bins |
 |
 |
| Parameter | Plot |
|---|---|
| CZT HV Monitor | 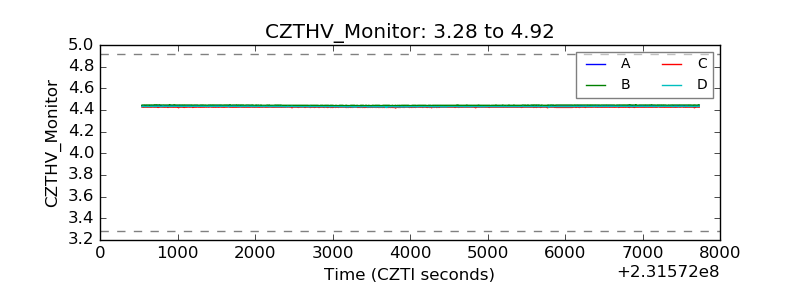 |
| D_VDD |  |
| Temperature 1 | 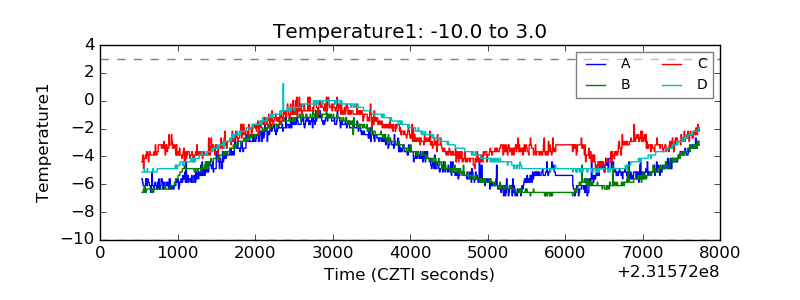 |
| Veto HV Monitor | 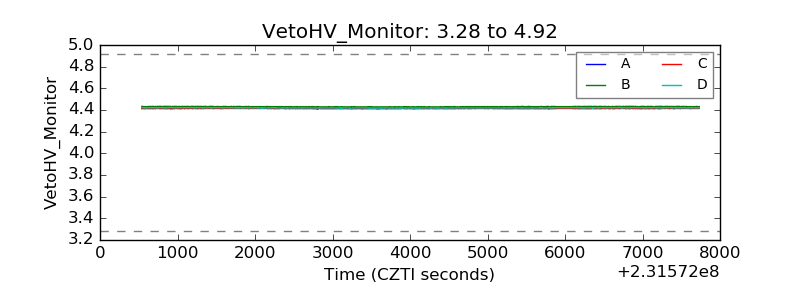 |
| Veto LLD | 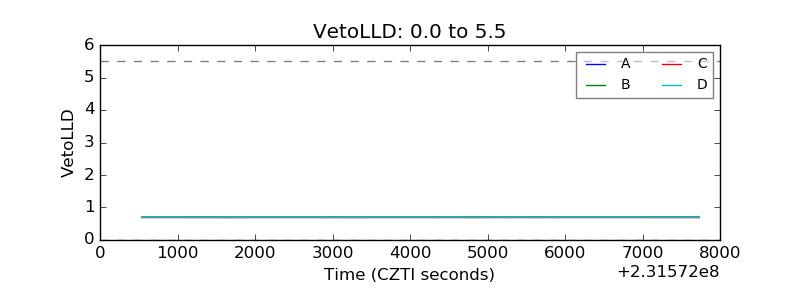 |
| Alpha Counter | 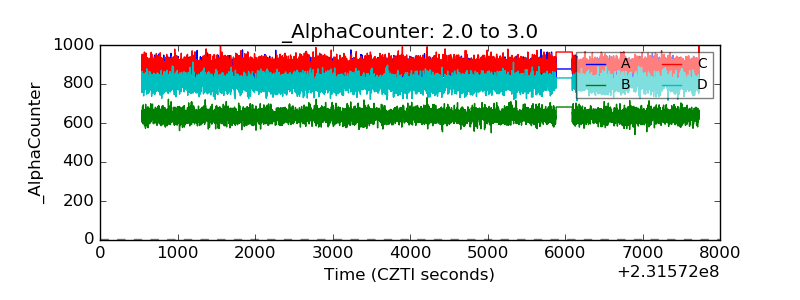 |
| _CPM_Rate | 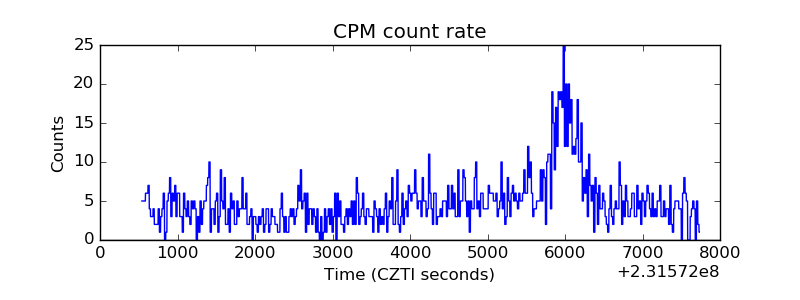 |
| CZT Counter | 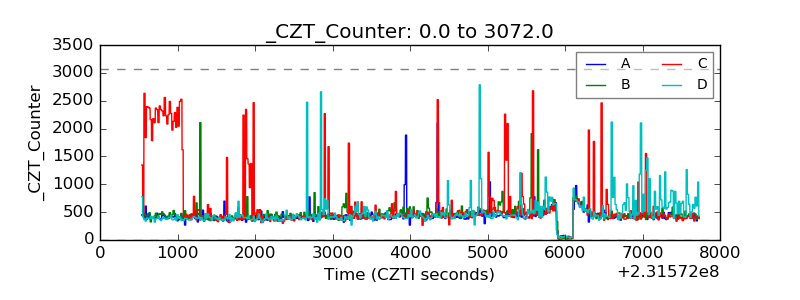 |
| +2.5 Volts monitor |  |
| +5 Volts monitor |  |
| _ROLL_ROT | 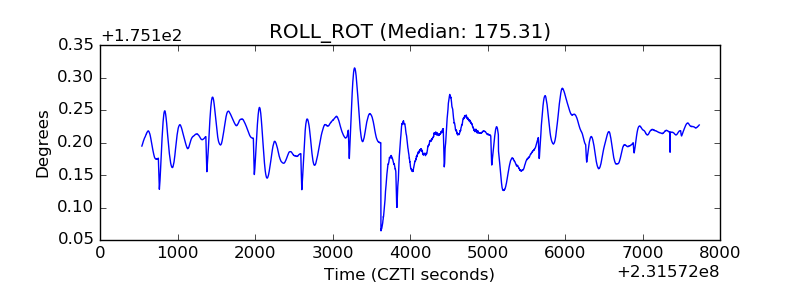 |
| _Roll_DEC | 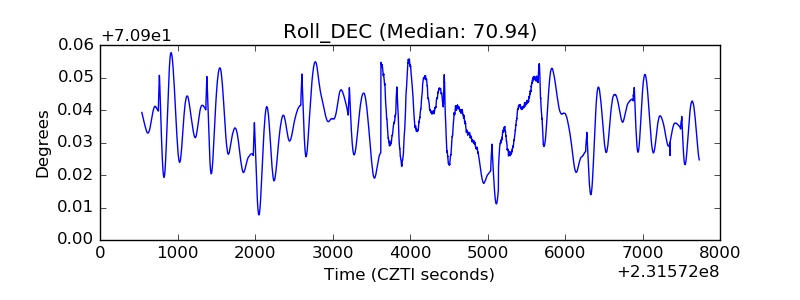 |
| _Roll_RA | 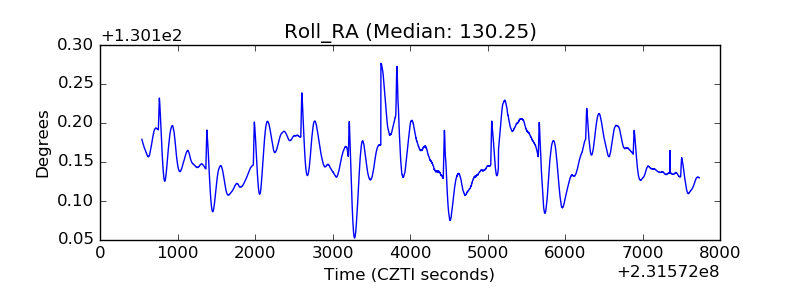 |
| Veto Counter |  |