| Param | Original file | Final file |
|---|---|---|
| Filename | modeM0/AS1G07_024T01_9000001206_08649cztM0_level2.evt | modeM0/AS1G07_024T01_9000001206_08649cztM0_level2_quad_clean.evt |
| Size (bytes) | 383,760,000 | 95,834,880 |
| Size | 366.0 MB | 91.4 MB |
| Events in quadrant A | 2,380,891 | 633,318 |
| Events in quadrant B | 2,730,091 | 649,654 |
| Events in quadrant C | 2,961,424 | 624,643 |
| Events in quadrant D | 3,172,166 | 606,654 |
| Mode M0 | |||
|---|---|---|---|
| Quadrant | BADHDUFLAG | Total packets | Discarded packets |
| A | 0 | 11175 | 1 |
| B | 0 | 11814 | 0 |
| C | 0 | 12847 | 11 |
| D | 0 | 13438 | 9 |
| Mode SS | |||
|---|---|---|---|
| Quadrant | BADHDUFLAG | Total packets | Discarded packets |
| A | 0 | 112 | 0 |
| B | 0 | 112 | 0 |
| C | 0 | 112 | 0 |
| D | 0 | 112 | 0 |
| Quadrant | Total seconds | Saturated seconds | Saturation percentage |
|---|---|---|---|
| A | 5545 | 5 | 0.090171% |
| B | 5545 | 62 | 1.118124% |
| C | 5540 | 146 | 2.635379% |
| D | 5542 | 55 | 0.992422% |
Noise dominated data is calculated using 1-second bins in cleaned event files. If a bin has >2000 counts, and if more than 50% of those come from <1% of pixels, then it is considered to be noise-dominated and hence unusable.
| Quadrant | # 1 sec bins | Bins with >0 counts | Bins with >2000 counts | High rate bins dominated by noise | Noise dominated (total time) | Noise dominated (detector-on time) | Marked lightcurve |
|---|---|---|---|---|---|---|---|
| A | 5545 | 5545 | 4 | 4 | 0.07% | 0.07% | 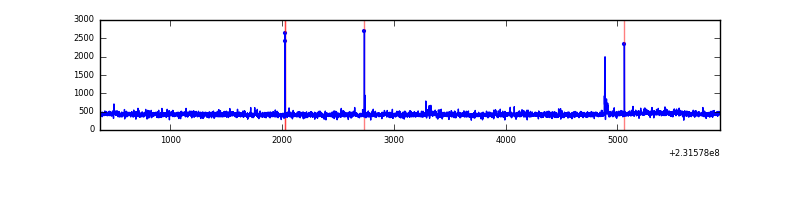 |
| B | 5545 | 5545 | 36 | 36 | 0.65% | 0.65% | 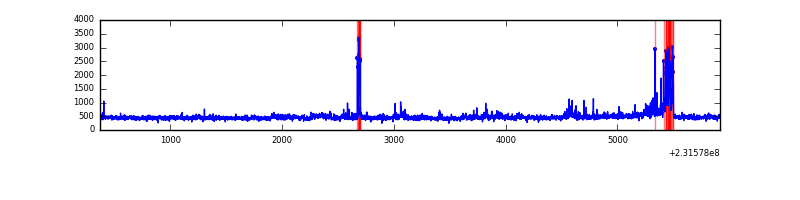 |
| C | 5545 | 5545 | 124 | 124 | 2.24% | 2.24% | 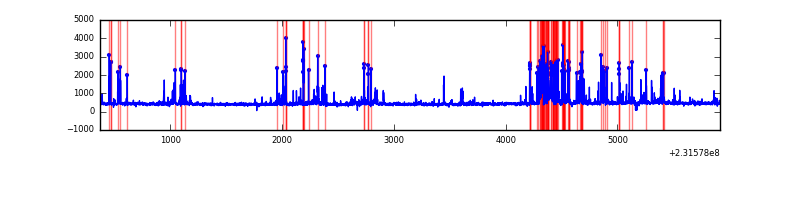 |
| D | 5545 | 5545 | 49 | 49 | 0.88% | 0.88% | 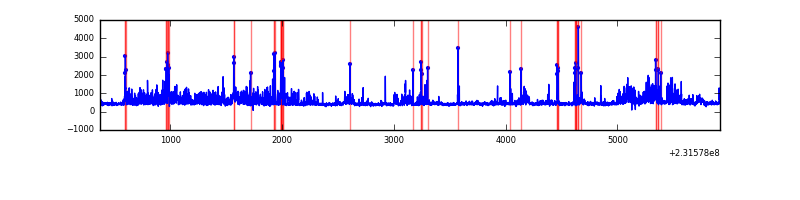 |
Top three noisy pixels from each quadrant. If the there are fewer than three noisy pixels in the level2.evt file, extra rows are filled as -1
| Pixel properties | Quadrant properties | ||||||
|---|---|---|---|---|---|---|---|
| Quadrant | DetID | PixID | Counts | Sigma | Mean | Median | Sigma |
| A | 15 | 174 | 21935 | 171.51 | 605 | 589 | 124.5 |
| A | 8 | 5 | 21474 | 167.8 | 605 | 589 | 124.5 |
| A | 5 | 16 | 7110 | 52.39 | 605 | 589 | 124.5 |
| B | 4 | 48 | 146762 | 1239.55 | 614 | 600 | 117.9 |
| B | 0 | 219 | 87096 | 733.54 | 614 | 600 | 117.9 |
| B | 0 | 228 | 40993 | 342.56 | 614 | 600 | 117.9 |
| C | 4 | 254 | 676081 | 4968.15 | 583 | 585 | 136.0 |
| C | 4 | 238 | 5692 | 37.56 | 583 | 585 | 136.0 |
| C | 13 | 61 | 4537 | 29.07 | 583 | 585 | 136.0 |
| D | 1 | 52 | 727540 | 5084.18 | 586 | 567 | 143.0 |
| D | 10 | 253 | 63053 | 437.0 | 586 | 567 | 143.0 |
| D | 7 | 71 | 38326 | 264.07 | 586 | 567 | 143.0 |
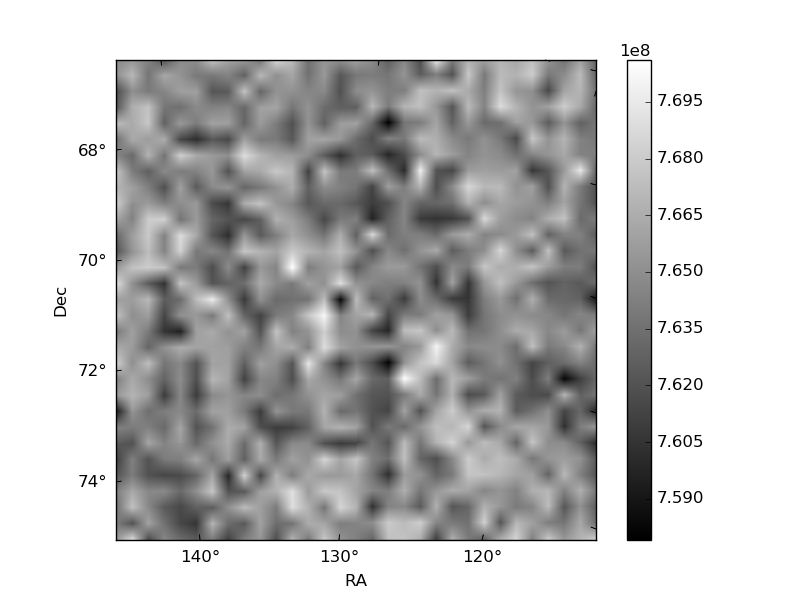
Histogram calculated using DETX and DETY for each event in the final _common_clean file
| Quadrant A | 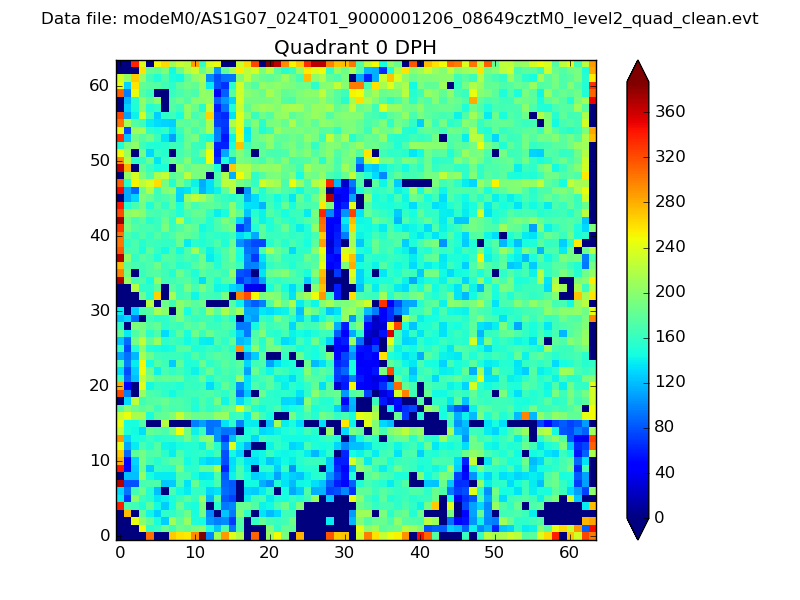 |
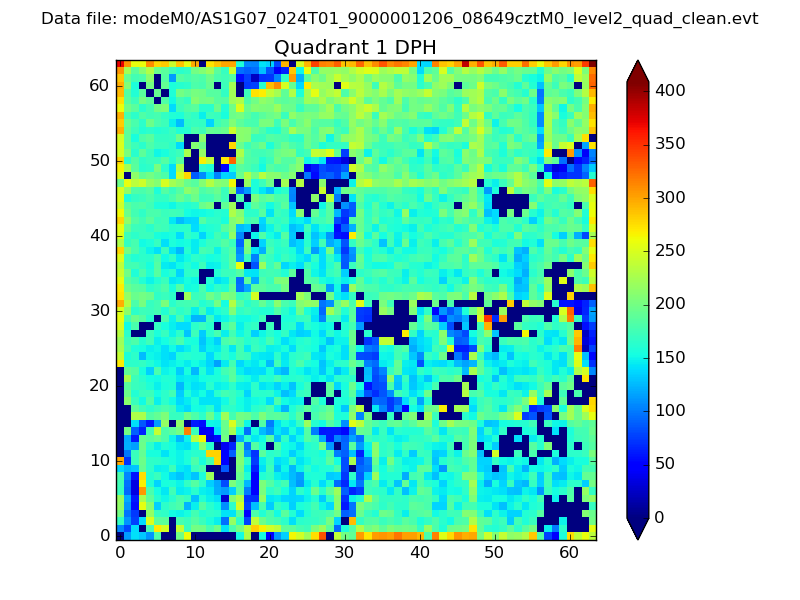 |
Quadrant B |
|---|---|---|---|
| Quadrant D | 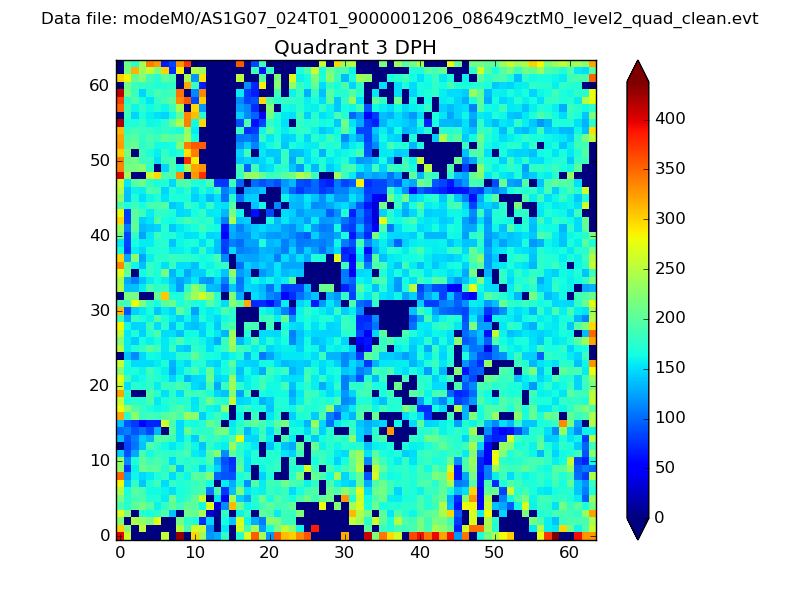 |
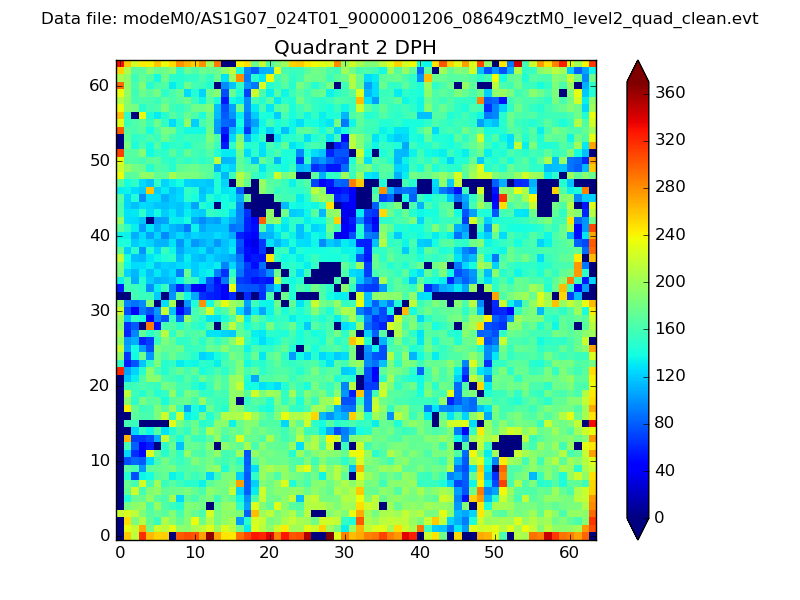 |
Quadrant C |
| Plot type | Count rate plots | Images |
|---|---|---|
| Comparison with Poisson distribution Blue bars denote a histogram of data divided into 1 sec bins. Red curve is a Poisson curve with rate = median count rate of data. |
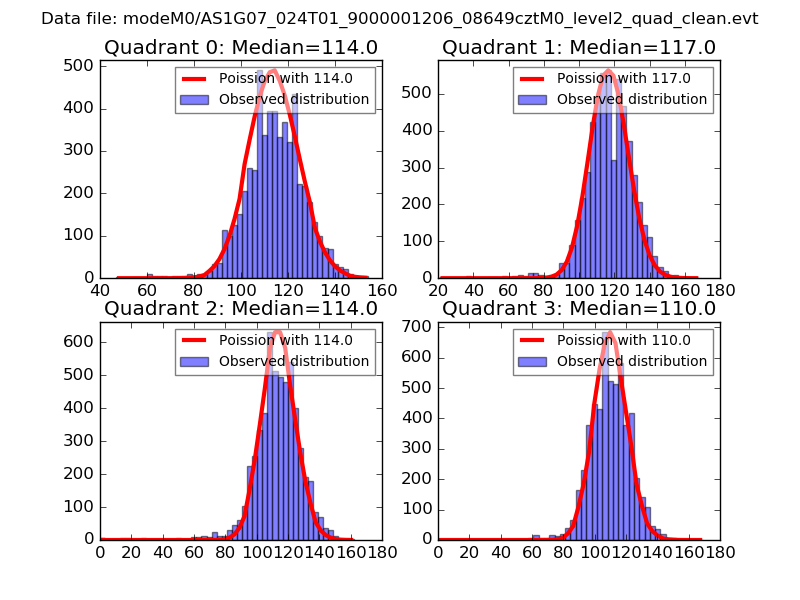 |
 |
| Quadrant-wise count rates Data is divided into 100 sec bins |
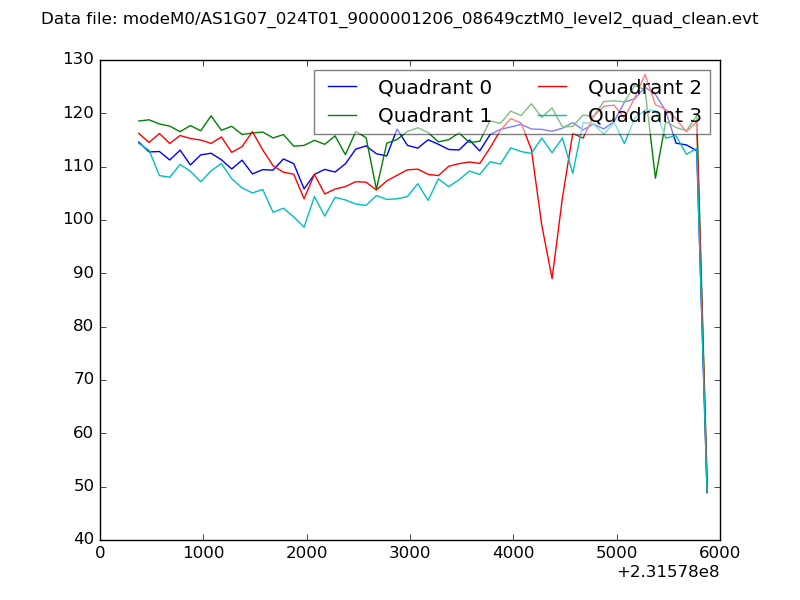 |
|
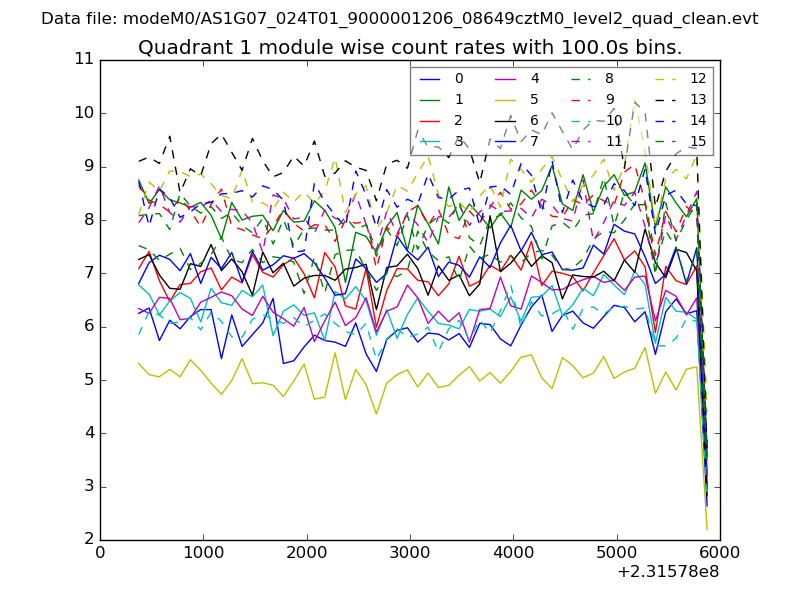
| Module-wise count rates for Quadrant A Data is divided into 100 sec bins |
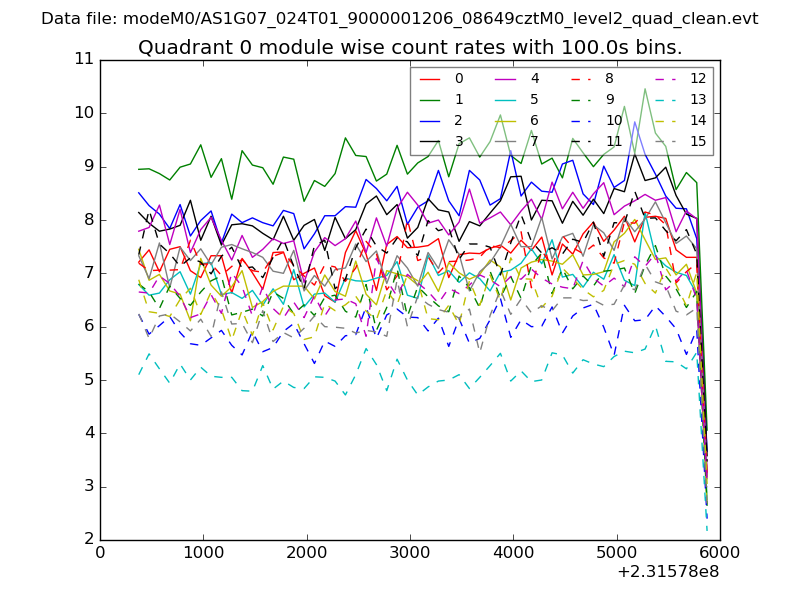 |
 |
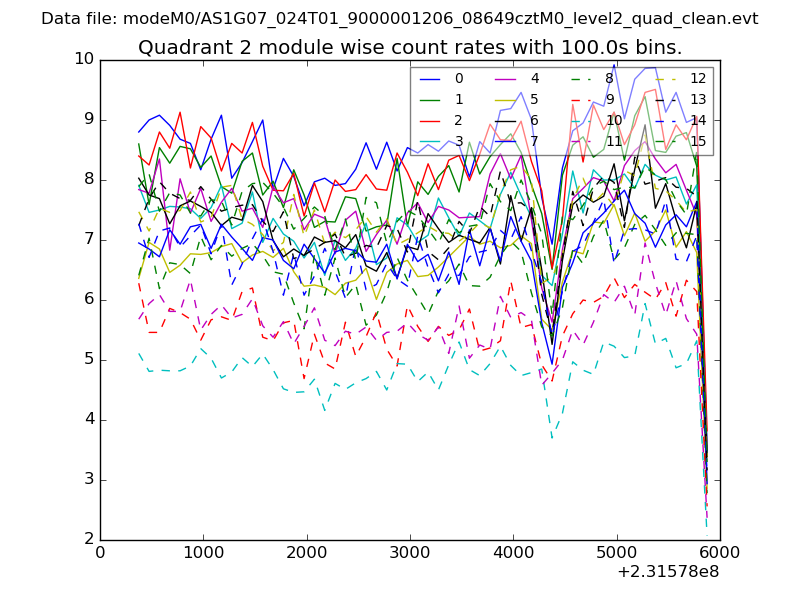
| Module-wise count rates for Quadrant B Data is divided into 100 sec bins |
 |
 |
| Module-wise count rates for Quadrant C Data is divided into 100 sec bins |
 |
 |
| Module-wise count rates for Quadrant D Data is divided into 100 sec bins |
 |
 |
| Parameter | Plot |
|---|---|
| CZT HV Monitor | 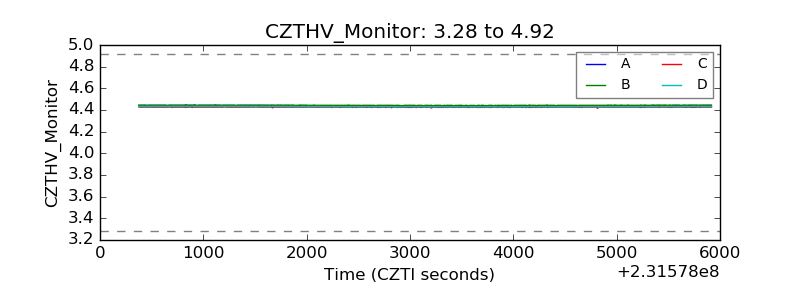 |
| D_VDD | 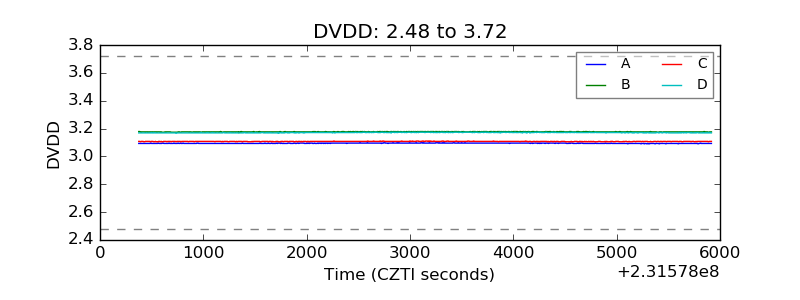 |
| Temperature 1 |  |
| Veto HV Monitor | 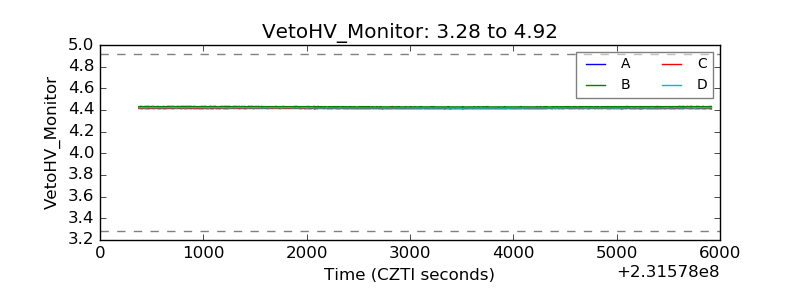 |
| Veto LLD | 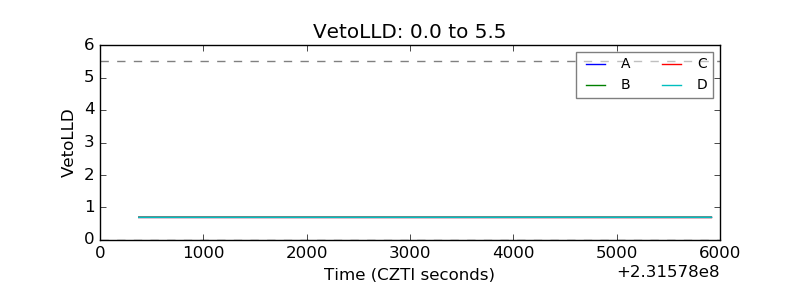 |
| Alpha Counter | 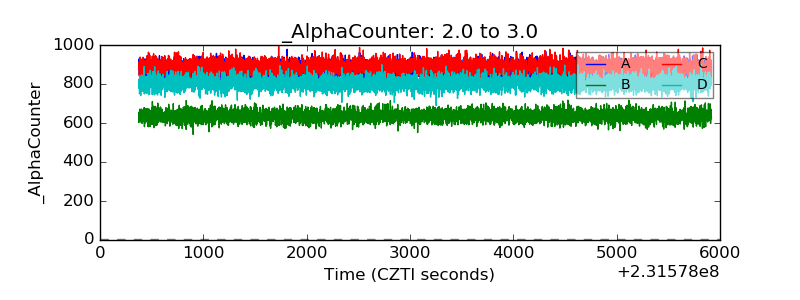 |
| _CPM_Rate | 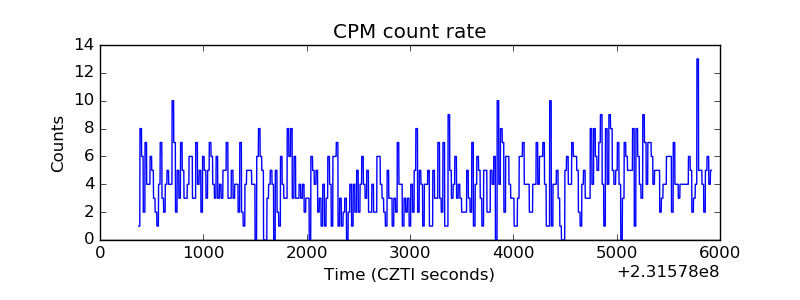 |
| CZT Counter | 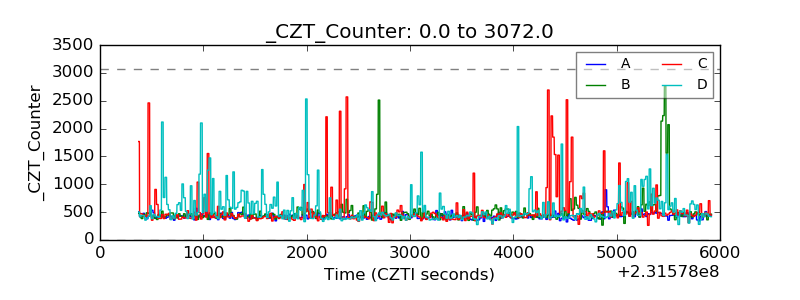 |
| +2.5 Volts monitor |  |
| +5 Volts monitor |  |
| _ROLL_ROT |  |
| _Roll_DEC |  |
| _Roll_RA | 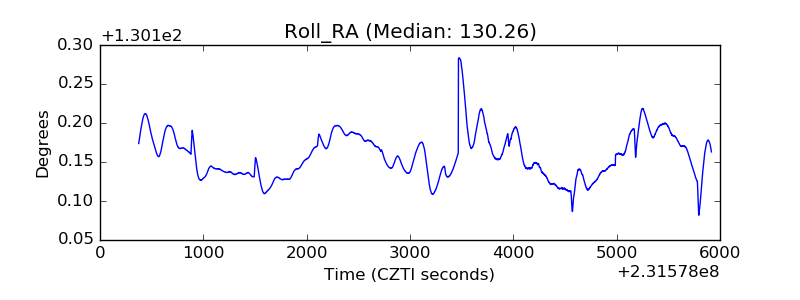 |
| Veto Counter |  |