| Param | Original file | Final file |
|---|---|---|
| Filename | modeM0/AS1G07_024T01_9000001206_08653cztM0_level2.evt | modeM0/AS1G07_024T01_9000001206_08653cztM0_level2_quad_clean.evt |
| Size (bytes) | 435,283,200 | 119,764,800 |
| Size | 415.1 MB | 114.2 MB |
| Events in quadrant A | 2,886,886 | 798,188 |
| Events in quadrant B | 3,164,785 | 822,114 |
| Events in quadrant C | 2,949,414 | 813,921 |
| Events in quadrant D | 3,758,405 | 758,889 |
| Mode M0 | |||
|---|---|---|---|
| Quadrant | BADHDUFLAG | Total packets | Discarded packets |
| A | 0 | 12899 | 2 |
| B | 0 | 13673 | 1 |
| C | 0 | 13012 | 1 |
| D | 0 | 15558 | 1 |
| Mode M9 | |||
|---|---|---|---|
| Quadrant | BADHDUFLAG | Total packets | Discarded packets |
| A | 0 | 12 | 0 |
| B | 0 | 12 | 0 |
| C | 0 | 12 | 0 |
| D | 0 | 12 | 0 |
| Mode SS | |||
|---|---|---|---|
| Quadrant | BADHDUFLAG | Total packets | Discarded packets |
| A | 0 | 126 | 0 |
| B | 0 | 126 | 0 |
| C | 0 | 126 | 0 |
| D | 0 | 126 | 0 |
| Quadrant | Total seconds | Saturated seconds | Saturation percentage |
|---|---|---|---|
| A | 6223 | 25 | 0.401735% |
| B | 6223 | 59 | 0.948096% |
| C | 6223 | 42 | 0.674916% |
| D | 6223 | 279 | 4.483368% |
Noise dominated data is calculated using 1-second bins in cleaned event files. If a bin has >2000 counts, and if more than 50% of those come from <1% of pixels, then it is considered to be noise-dominated and hence unusable.
| Quadrant | # 1 sec bins | Bins with >0 counts | Bins with >2000 counts | High rate bins dominated by noise | Noise dominated (total time) | Noise dominated (detector-on time) | Marked lightcurve |
|---|---|---|---|---|---|---|---|
| A | 7408 | 6223 | 3 | 3 | 0.04% | 0.05% | 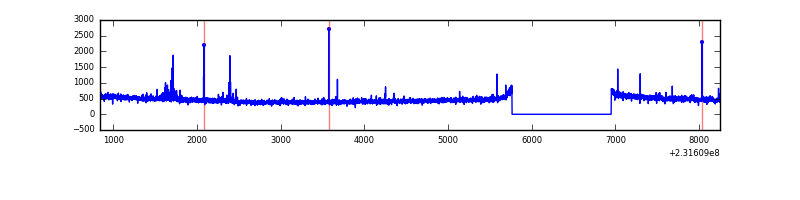 |
| B | 7408 | 6223 | 15 | 15 | 0.20% | 0.24% | 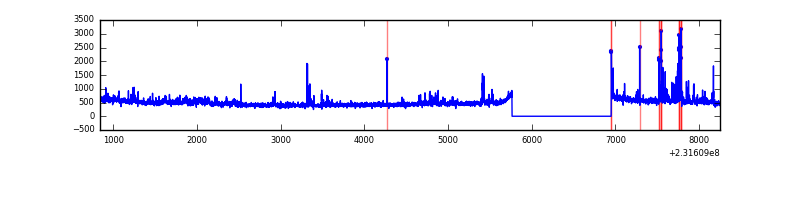 |
| C | 7408 | 6223 | 5 | 5 | 0.07% | 0.08% | 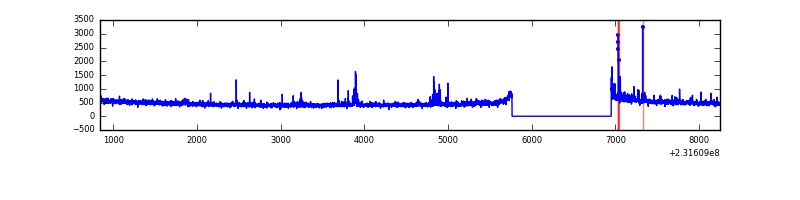 |
| D | 7407 | 6222 | 234 | 234 | 3.16% | 3.76% | 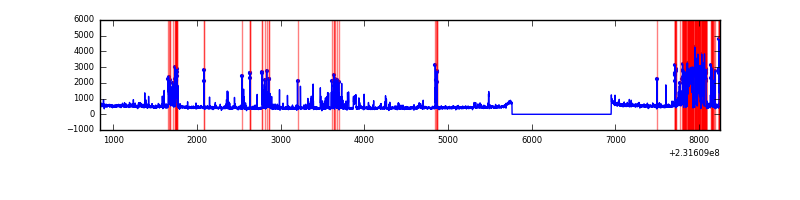 |
Top three noisy pixels from each quadrant. If the there are fewer than three noisy pixels in the level2.evt file, extra rows are filled as -1
| Pixel properties | Quadrant properties | ||||||
|---|---|---|---|---|---|---|---|
| Quadrant | DetID | PixID | Counts | Sigma | Mean | Median | Sigma |
| A | 8 | 5 | 56252 | 379.01 | 725 | 710 | 146.5 |
| A | 15 | 174 | 28442 | 189.24 | 725 | 710 | 146.5 |
| A | 0 | 226 | 6776 | 41.39 | 725 | 710 | 146.5 |
| B | 10 | 246 | 99701 | 721.84 | 738 | 720 | 137.1 |
| B | 0 | 219 | 65454 | 472.09 | 738 | 720 | 137.1 |
| B | 0 | 168 | 41673 | 298.66 | 738 | 720 | 137.1 |
| C | 4 | 254 | 97884 | 587.64 | 723 | 727 | 165.3 |
| C | 14 | 67 | 14941 | 85.97 | 723 | 727 | 165.3 |
| C | 14 | 234 | 13279 | 75.92 | 723 | 727 | 165.3 |
| D | 10 | 253 | 614074 | 3584.53 | 707 | 685 | 171.1 |
| D | 12 | 233 | 168218 | 979.03 | 707 | 685 | 171.1 |
| D | 1 | 52 | 145787 | 847.95 | 707 | 685 | 171.1 |
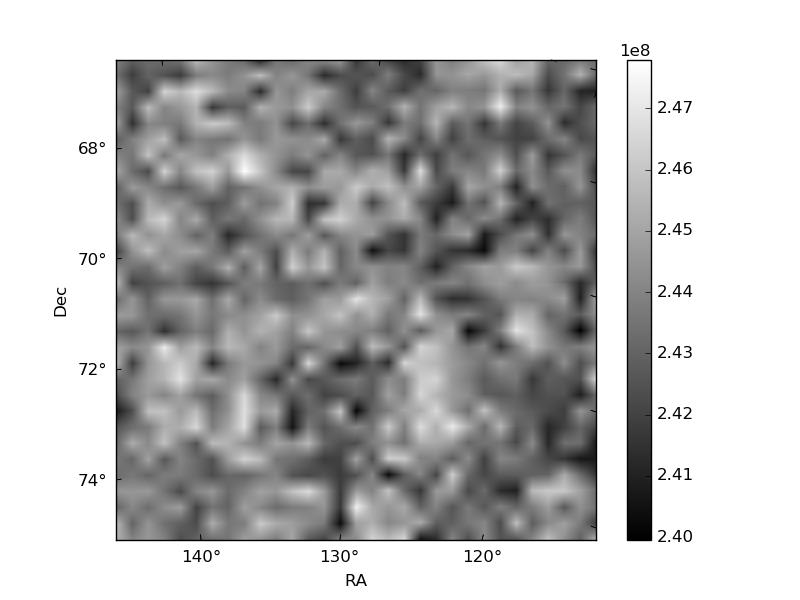
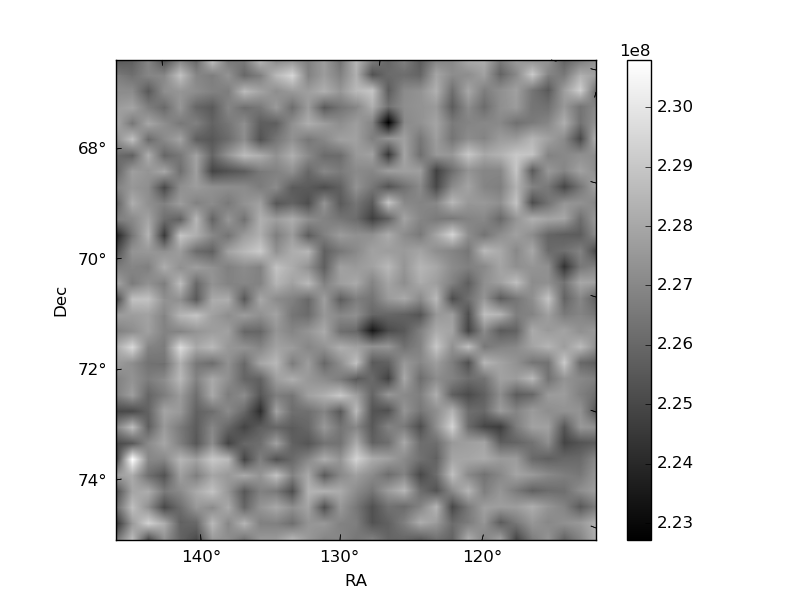
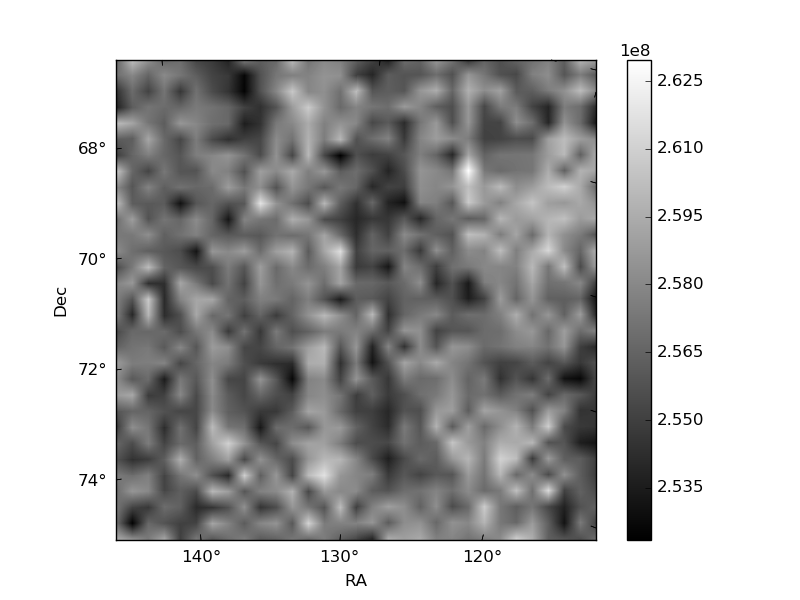
Histogram calculated using DETX and DETY for each event in the final _common_clean file
| Quadrant A | 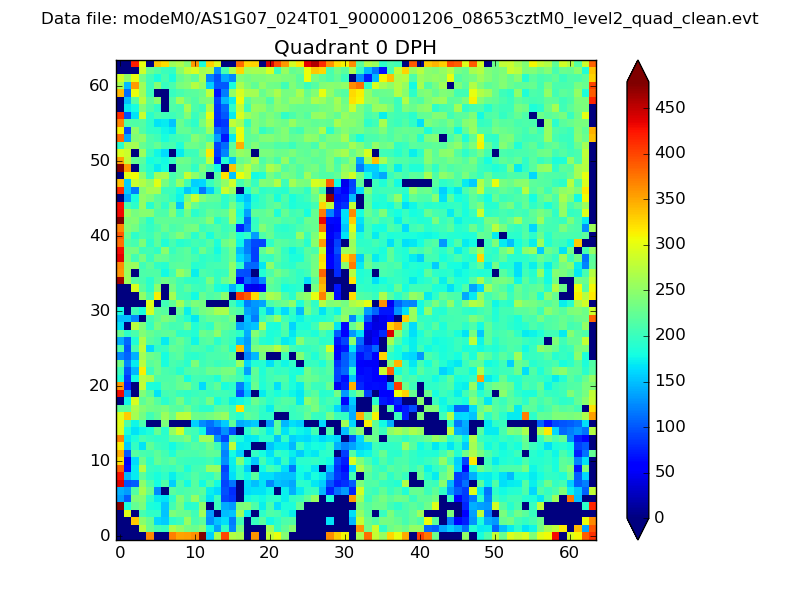 |
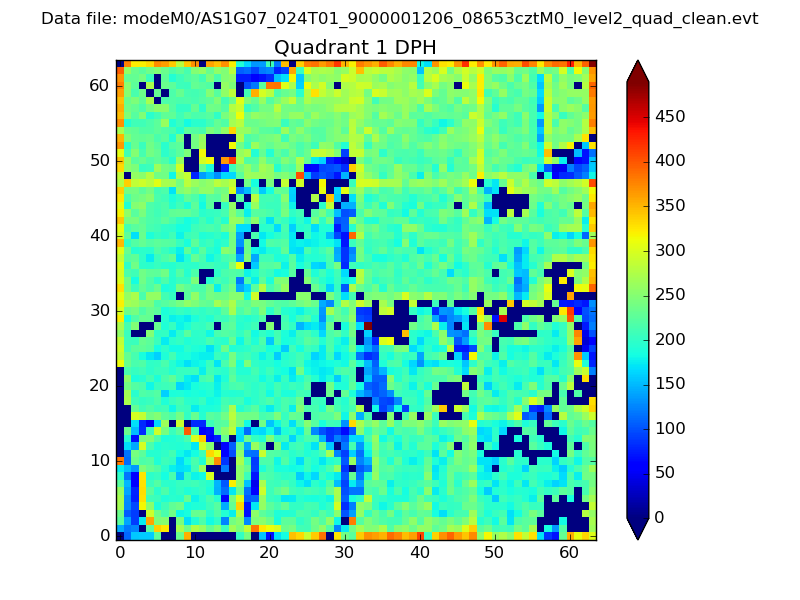 |
Quadrant B |
|---|---|---|---|
| Quadrant D | 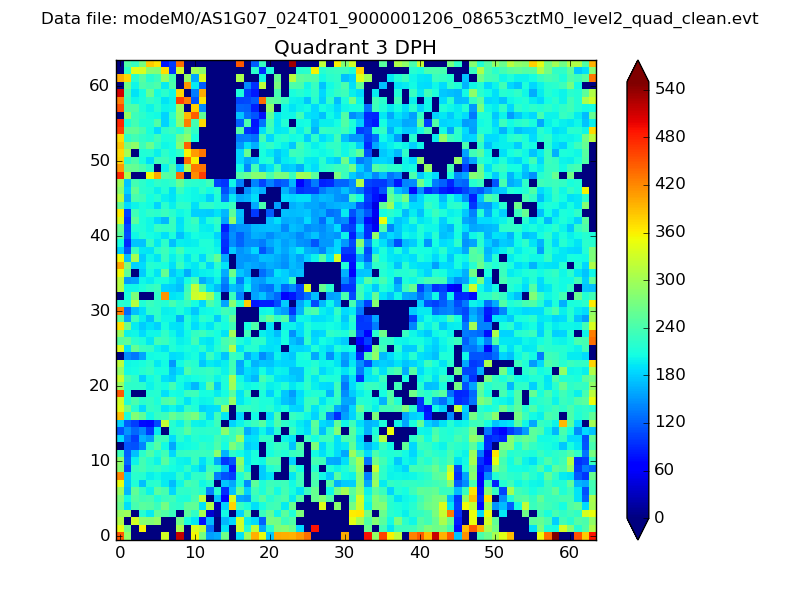 |
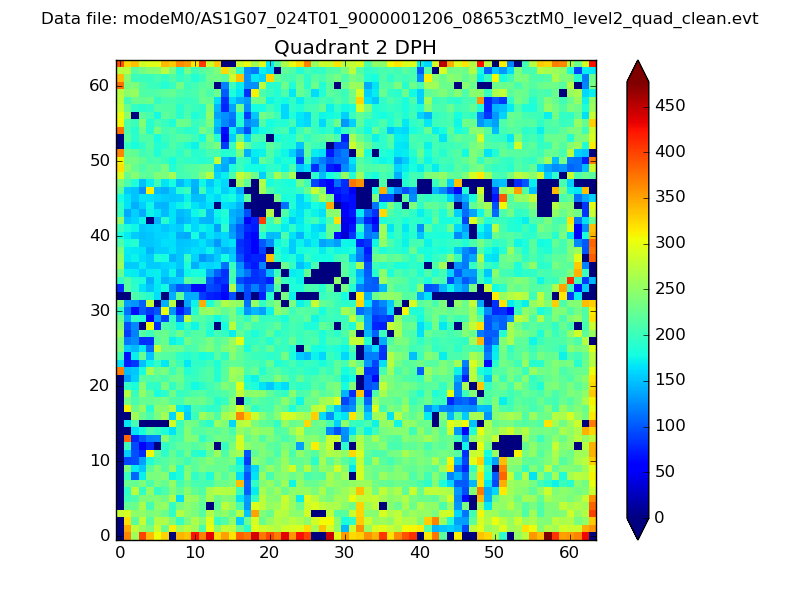 |
Quadrant C |
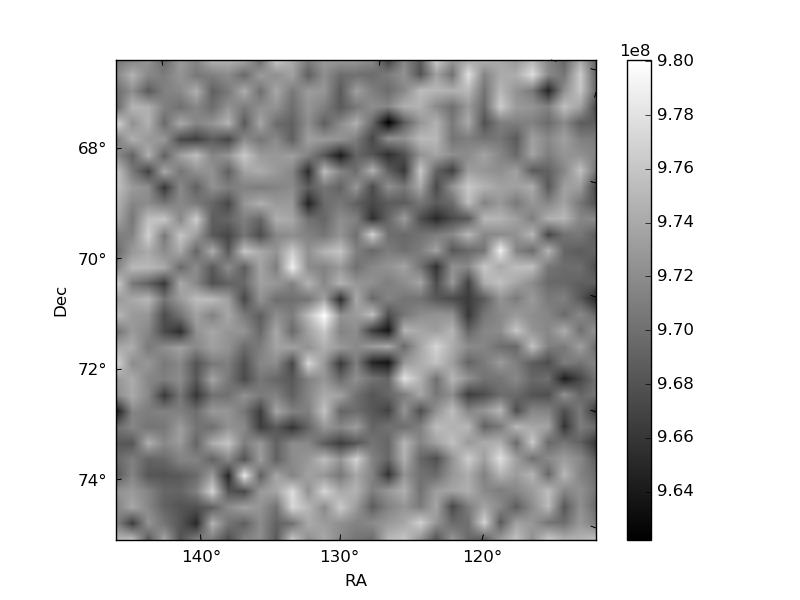
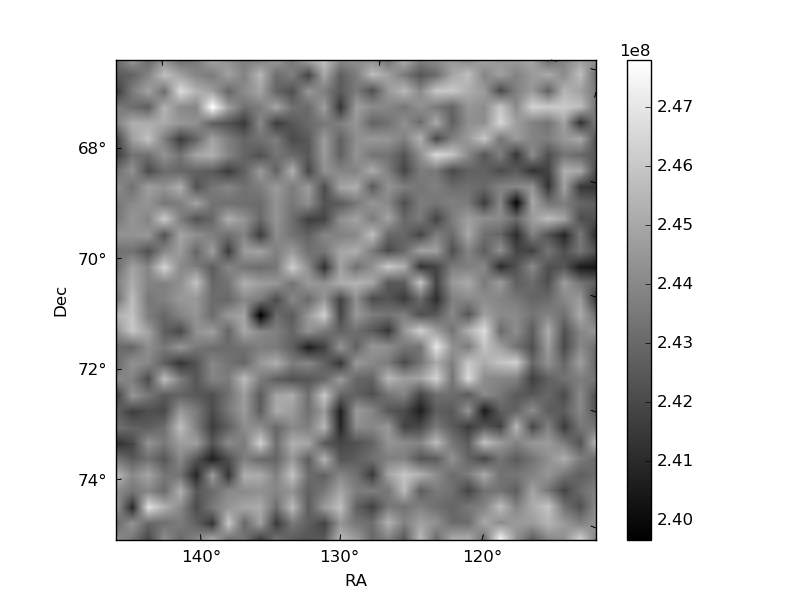
| Plot type | Count rate plots | Images |
|---|---|---|
| Comparison with Poisson distribution Blue bars denote a histogram of data divided into 1 sec bins. Red curve is a Poisson curve with rate = median count rate of data. |
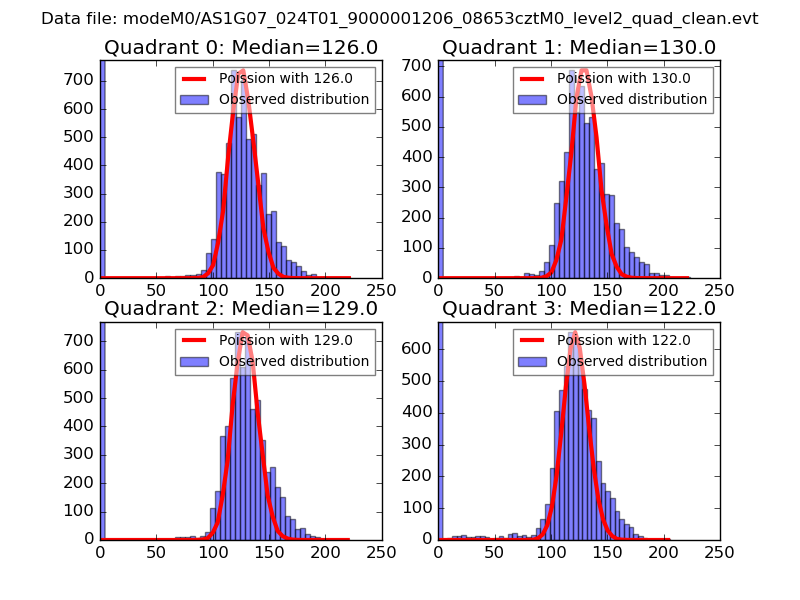 |
 |
| Quadrant-wise count rates Data is divided into 100 sec bins |
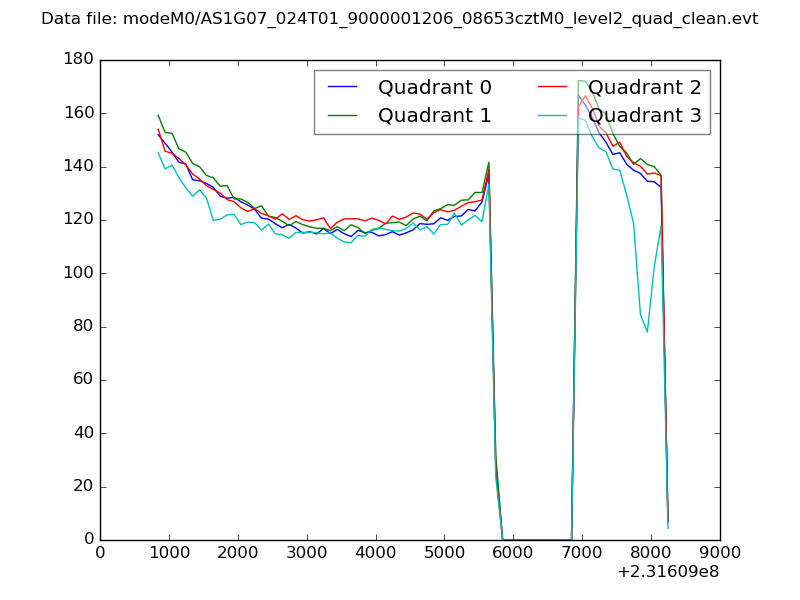 |
|
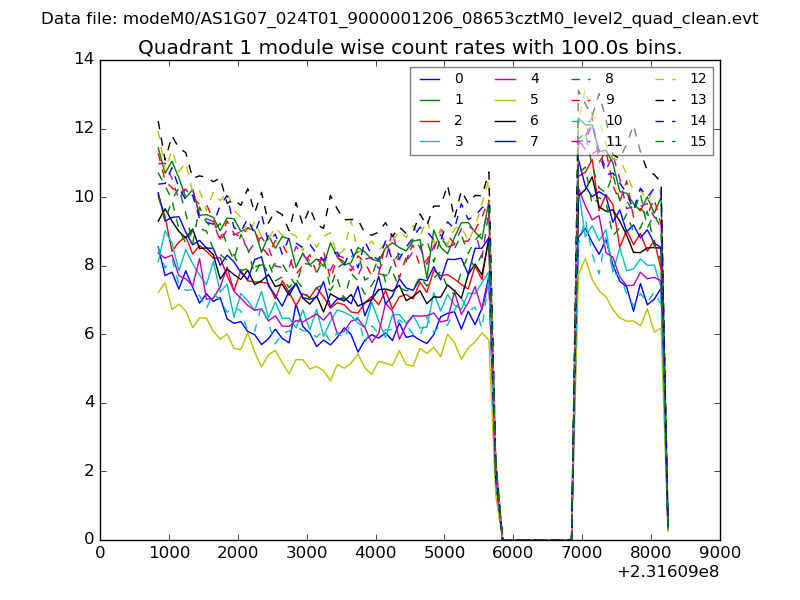
| Module-wise count rates for Quadrant A Data is divided into 100 sec bins |
 |
 |
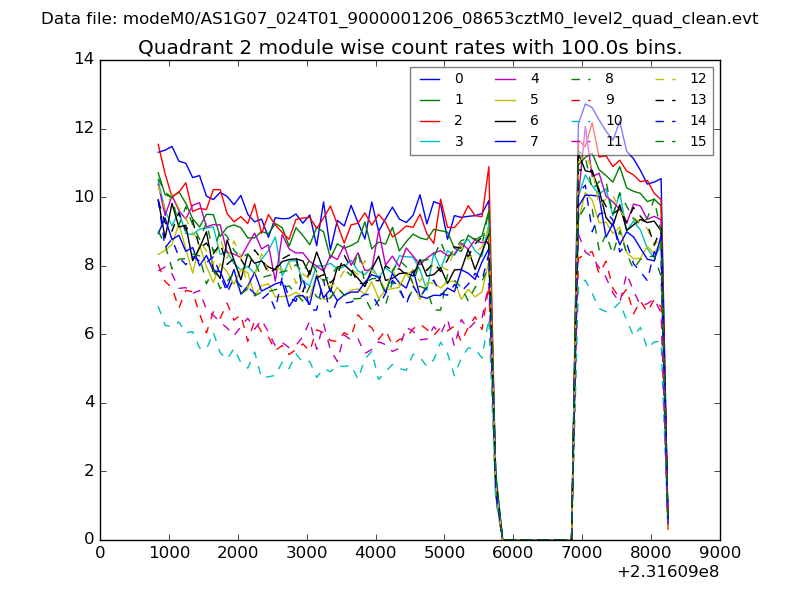
| Module-wise count rates for Quadrant B Data is divided into 100 sec bins |
 |
 |
| Module-wise count rates for Quadrant C Data is divided into 100 sec bins |
 |
 |
| Module-wise count rates for Quadrant D Data is divided into 100 sec bins |
 |
 |
| Parameter | Plot |
|---|---|
| CZT HV Monitor | 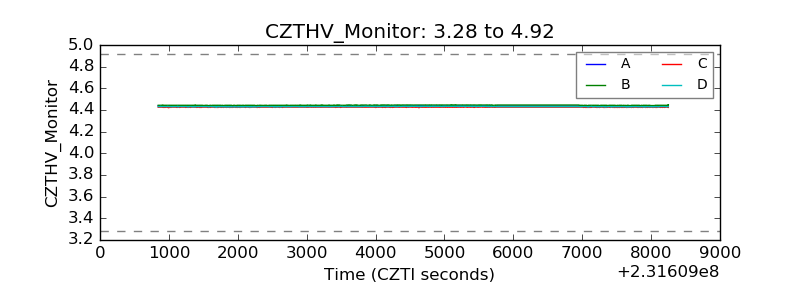 |
| D_VDD | 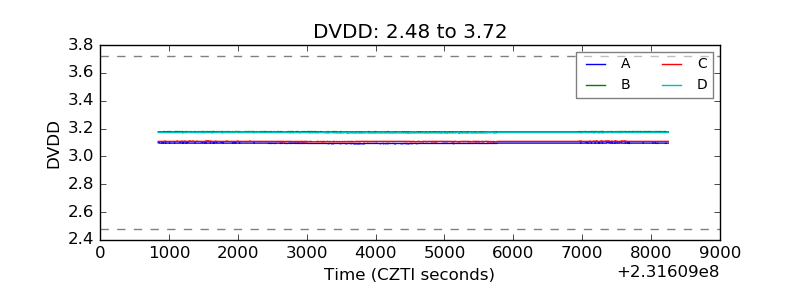 |
| Temperature 1 |  |
| Veto HV Monitor | 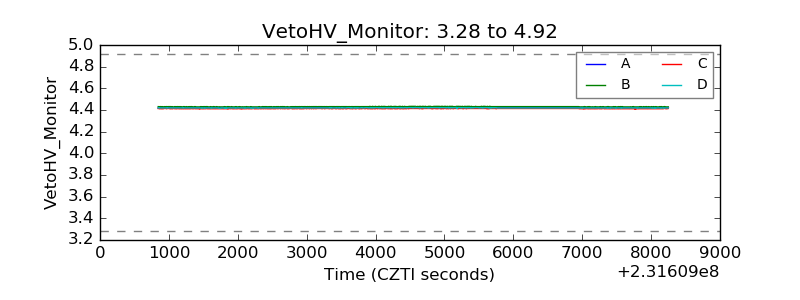 |
| Veto LLD | 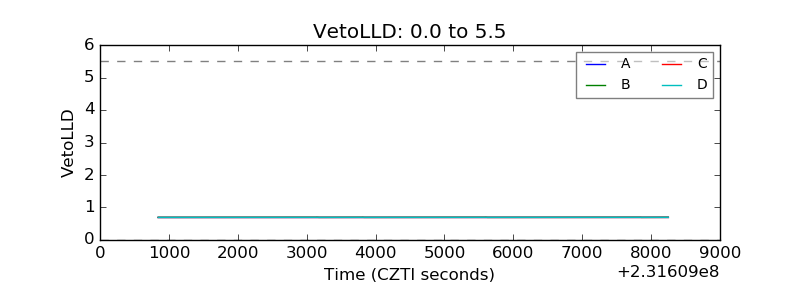 |
| Alpha Counter | 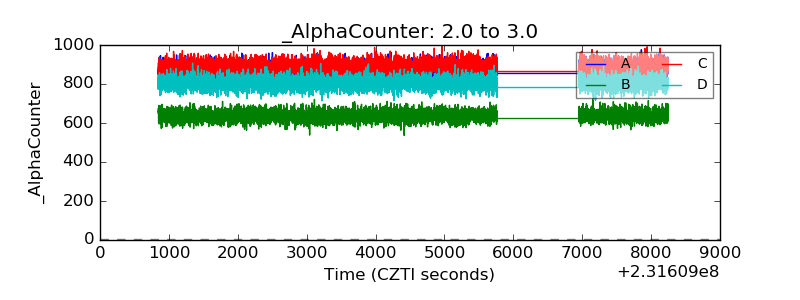 |
| _CPM_Rate | 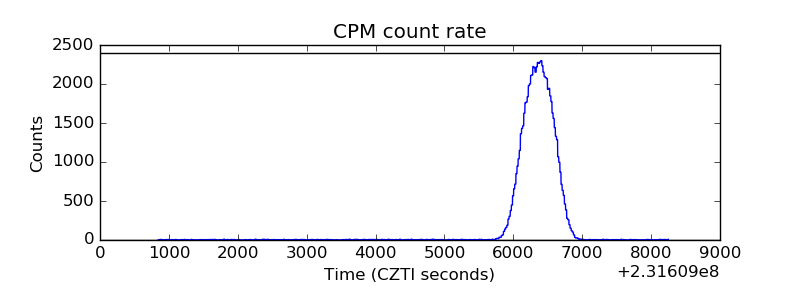 |
| CZT Counter | 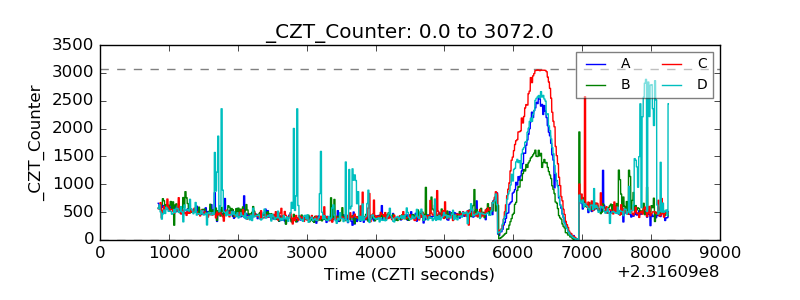 |
| +2.5 Volts monitor |  |
| +5 Volts monitor |  |
| _ROLL_ROT |  |
| _Roll_DEC | 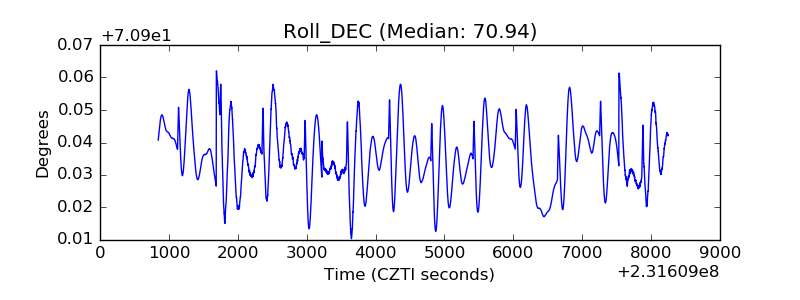 |
| _Roll_RA | 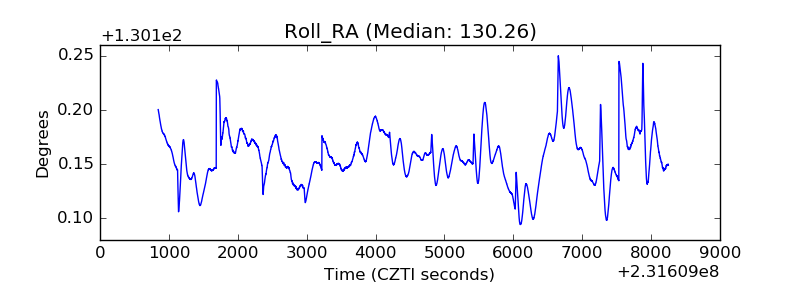 |
| Veto Counter |  |