| Param | Original file | Final file |
|---|---|---|
| Filename | modeM0/AS1G07_024T01_9000001206_08654cztM0_level2.evt | modeM0/AS1G07_024T01_9000001206_08654cztM0_level2_quad_clean.evt |
| Size (bytes) | 454,530,240 | 123,768,000 |
| Size | 433.5 MB | 118.0 MB |
| Events in quadrant A | 2,966,749 | 821,953 |
| Events in quadrant B | 3,382,217 | 854,812 |
| Events in quadrant C | 3,115,114 | 850,106 |
| Events in quadrant D | 3,876,805 | 785,659 |
| Mode M0 | |||
|---|---|---|---|
| Quadrant | BADHDUFLAG | Total packets | Discarded packets |
| A | 0 | 13053 | 3 |
| B | 0 | 14237 | 2 |
| C | 0 | 13545 | 2 |
| D | 0 | 15991 | 2 |
| Mode M9 | |||
|---|---|---|---|
| Quadrant | BADHDUFLAG | Total packets | Discarded packets |
| A | 0 | 13 | 0 |
| B | 0 | 13 | 0 |
| C | 0 | 13 | 0 |
| D | 0 | 13 | 0 |
| Mode SS | |||
|---|---|---|---|
| Quadrant | BADHDUFLAG | Total packets | Discarded packets |
| A | 0 | 128 | 0 |
| B | 0 | 128 | 0 |
| C | 0 | 128 | 0 |
| D | 0 | 128 | 0 |
| Quadrant | Total seconds | Saturated seconds | Saturation percentage |
|---|---|---|---|
| A | 6245 | 33 | 0.528423% |
| B | 6245 | 79 | 1.265012% |
| C | 6245 | 53 | 0.848679% |
| D | 6245 | 295 | 4.723779% |
Noise dominated data is calculated using 1-second bins in cleaned event files. If a bin has >2000 counts, and if more than 50% of those come from <1% of pixels, then it is considered to be noise-dominated and hence unusable.
| Quadrant | # 1 sec bins | Bins with >0 counts | Bins with >2000 counts | High rate bins dominated by noise | Noise dominated (total time) | Noise dominated (detector-on time) | Marked lightcurve |
|---|---|---|---|---|---|---|---|
| A | 7525 | 6246 | 4 | 4 | 0.05% | 0.06% | 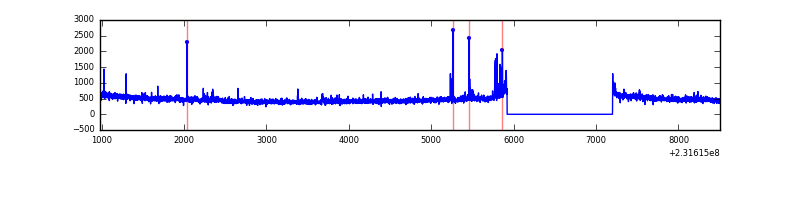 |
| B | 7525 | 6246 | 38 | 38 | 0.50% | 0.61% | 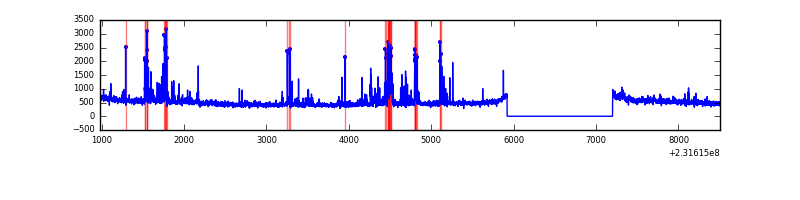 |
| C | 7525 | 6245 | 21 | 21 | 0.28% | 0.34% |  |
| D | 7525 | 6246 | 261 | 261 | 3.47% | 4.18% | 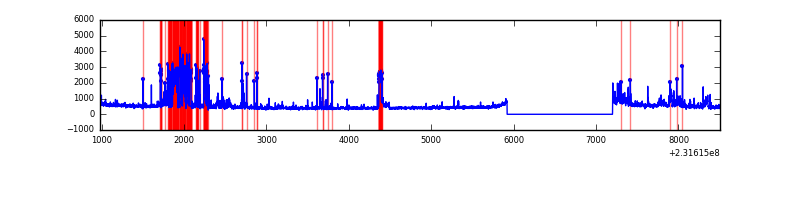 |
Top three noisy pixels from each quadrant. If the there are fewer than three noisy pixels in the level2.evt file, extra rows are filled as -1
| Pixel properties | Quadrant properties | ||||||
|---|---|---|---|---|---|---|---|
| Quadrant | DetID | PixID | Counts | Sigma | Mean | Median | Sigma |
| A | 8 | 5 | 109918 | 739.39 | 735 | 720 | 147.7 |
| A | 5 | 16 | 20050 | 130.88 | 735 | 720 | 147.7 |
| A | 13 | 251 | 9472 | 59.26 | 735 | 720 | 147.7 |
| B | 4 | 48 | 201104 | 1447.97 | 755 | 737 | 138.4 |
| B | 10 | 246 | 105369 | 756.13 | 755 | 737 | 138.4 |
| B | 0 | 219 | 58817 | 419.72 | 755 | 737 | 138.4 |
| C | 4 | 254 | 206246 | 1224.32 | 739 | 745 | 167.8 |
| C | 14 | 234 | 13222 | 74.33 | 739 | 745 | 167.8 |
| C | 13 | 61 | 5738 | 29.75 | 739 | 745 | 167.8 |
| D | 10 | 253 | 684998 | 3938.38 | 718 | 695 | 173.8 |
| D | 12 | 233 | 191243 | 1096.66 | 718 | 695 | 173.8 |
| D | 2 | 14 | 135949 | 778.43 | 718 | 695 | 173.8 |
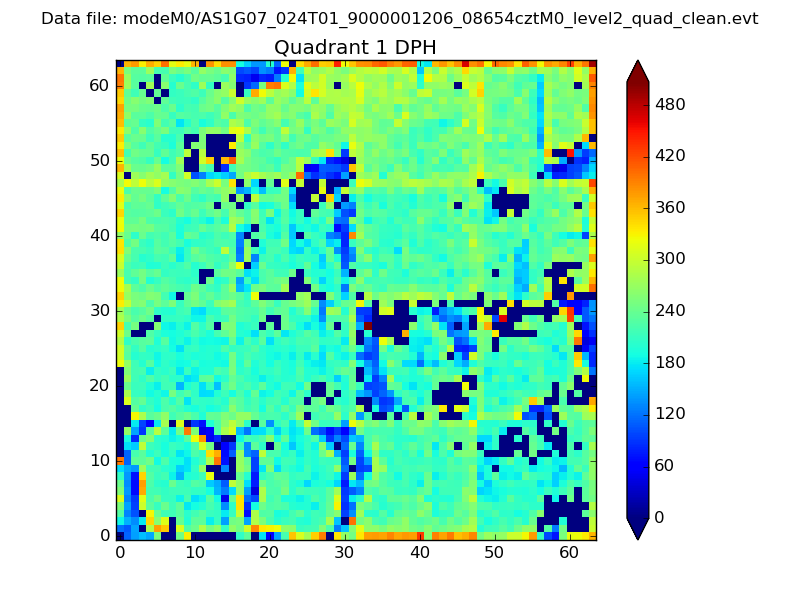
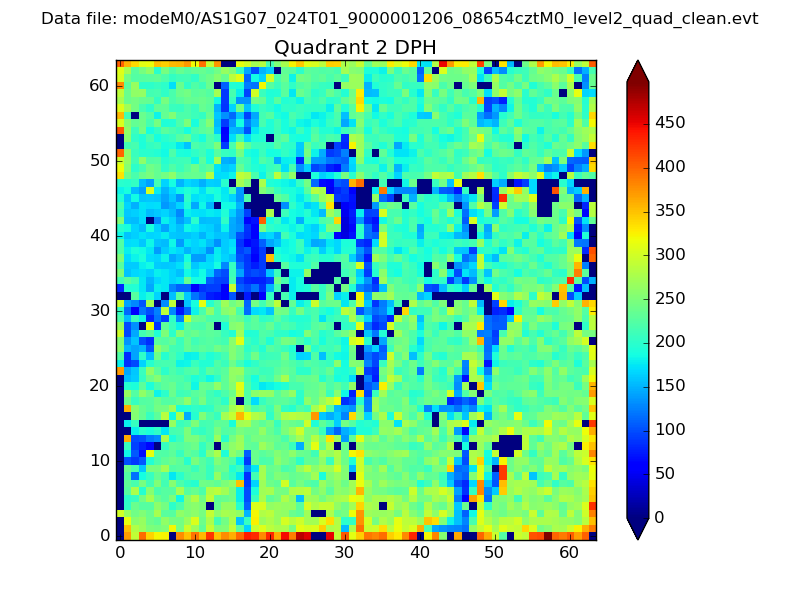
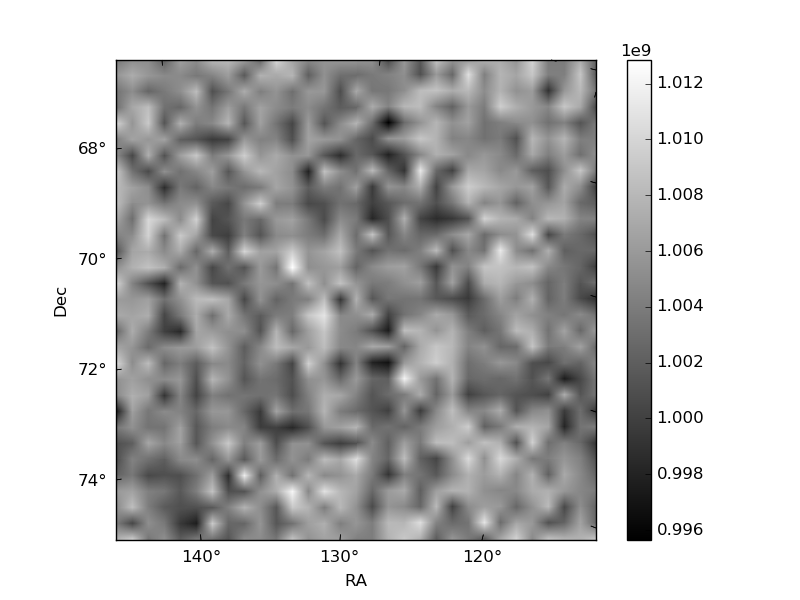
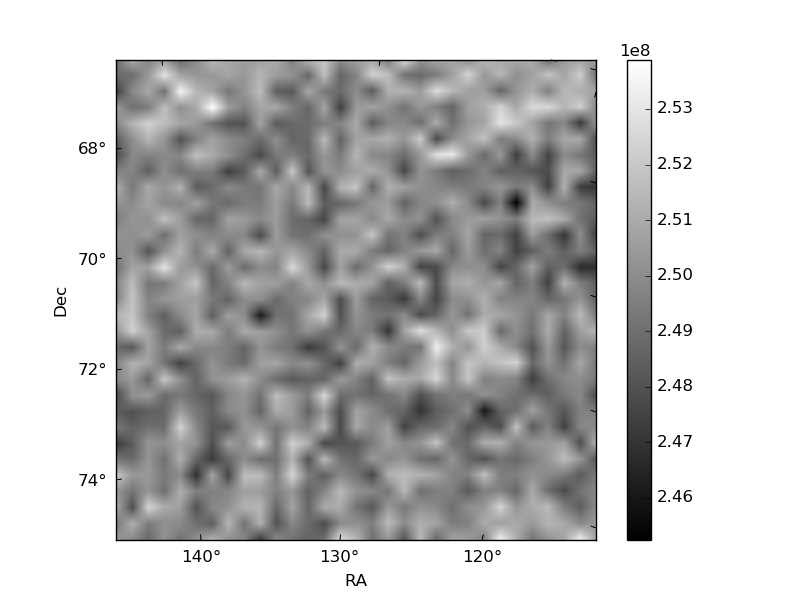
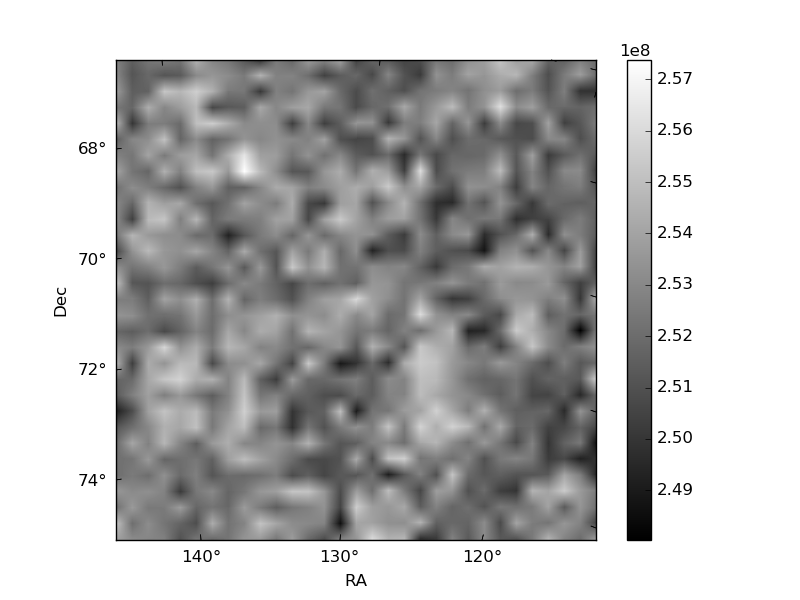
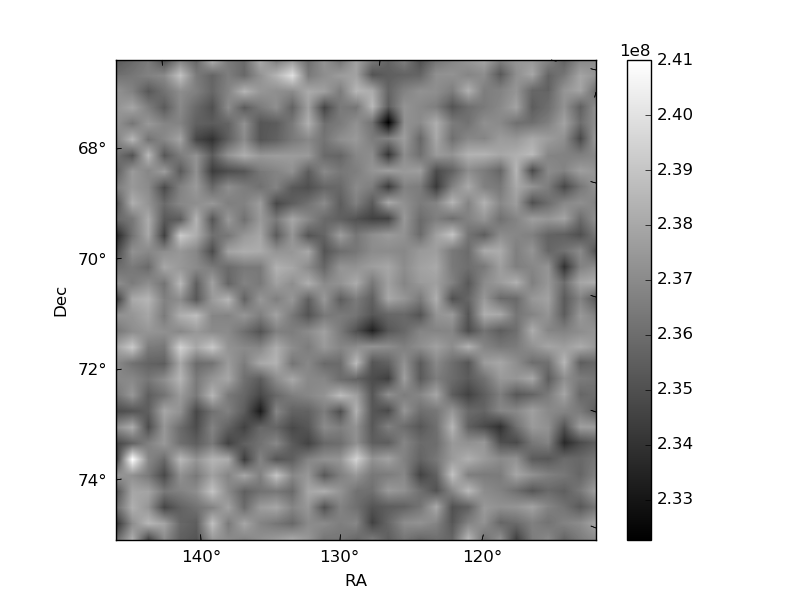
Histogram calculated using DETX and DETY for each event in the final _common_clean file
| Quadrant A | 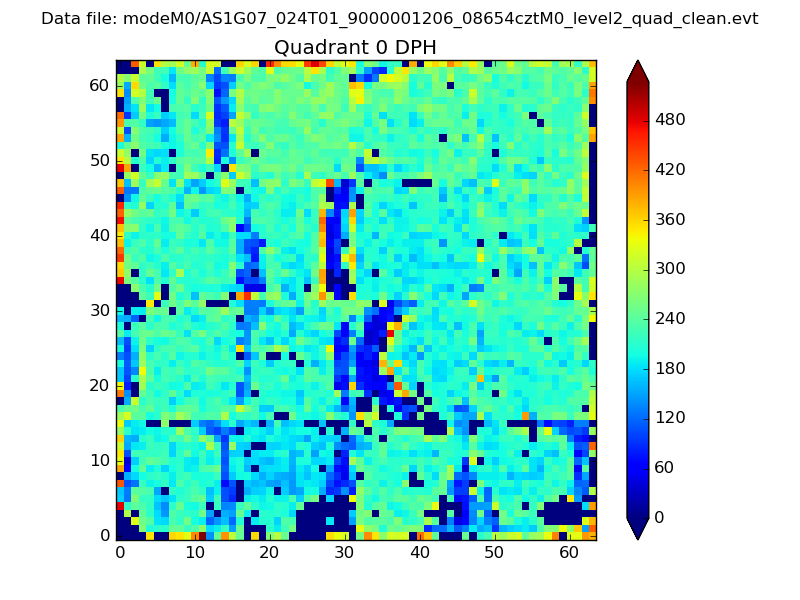 |
 |
Quadrant B |
|---|---|---|---|
| Quadrant D | 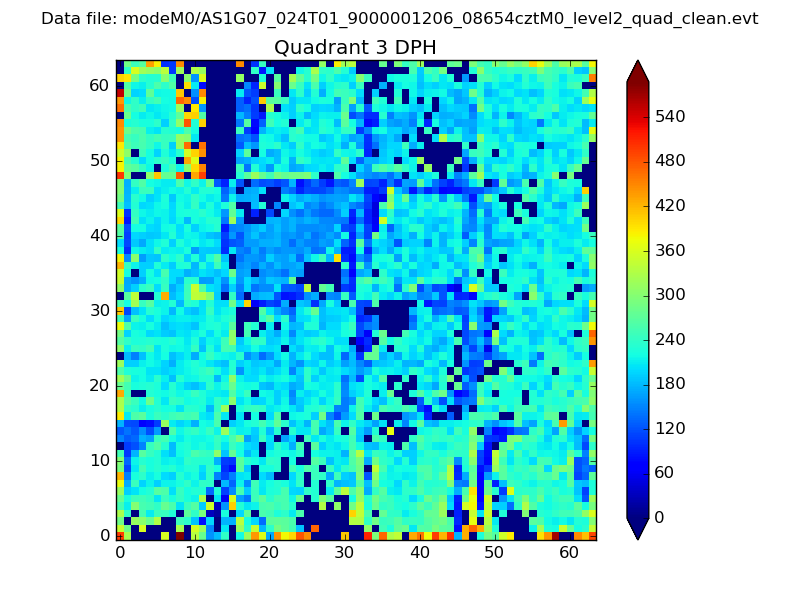 |
 |
Quadrant C |
| Plot type | Count rate plots | Images |
|---|---|---|
| Comparison with Poisson distribution Blue bars denote a histogram of data divided into 1 sec bins. Red curve is a Poisson curve with rate = median count rate of data. |
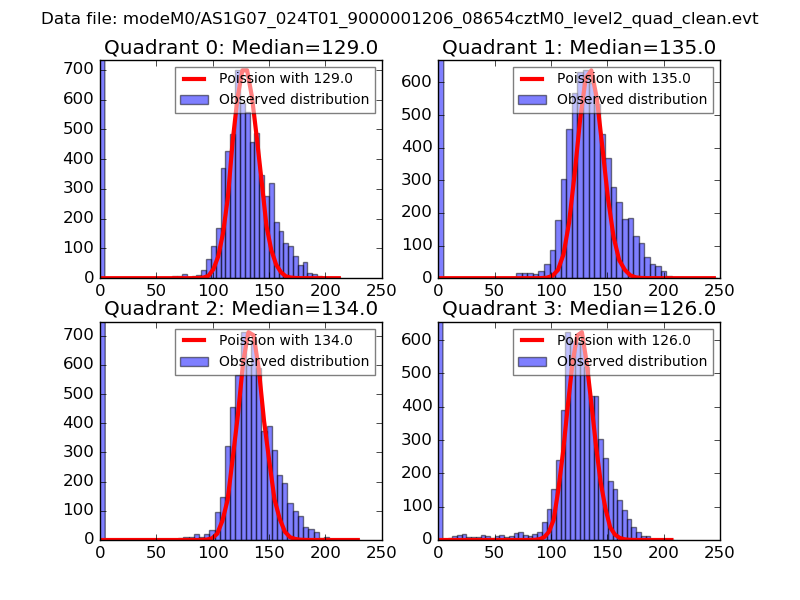 |
 |
| Quadrant-wise count rates Data is divided into 100 sec bins |
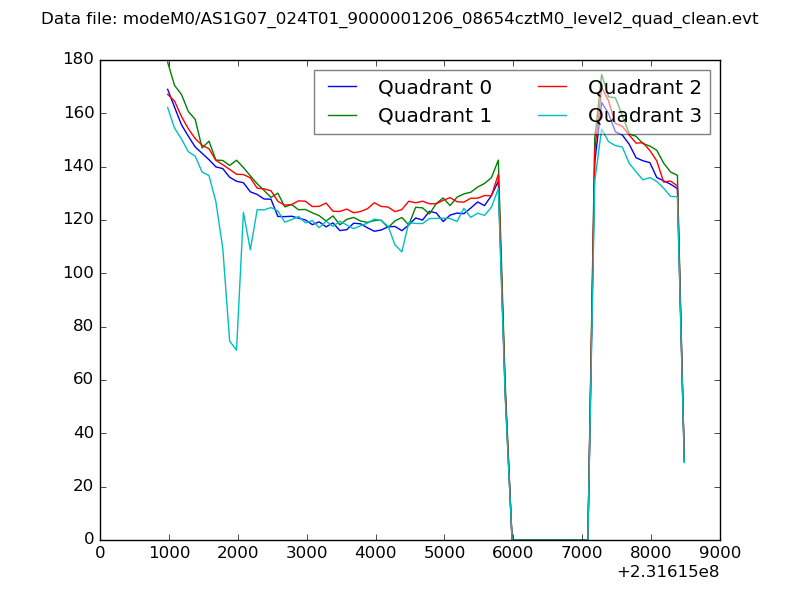 |
|
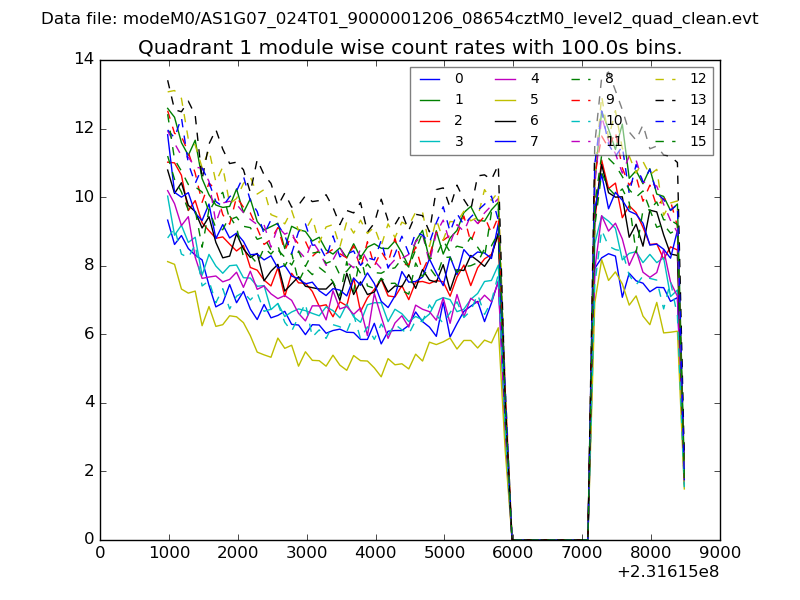
| Module-wise count rates for Quadrant A Data is divided into 100 sec bins |
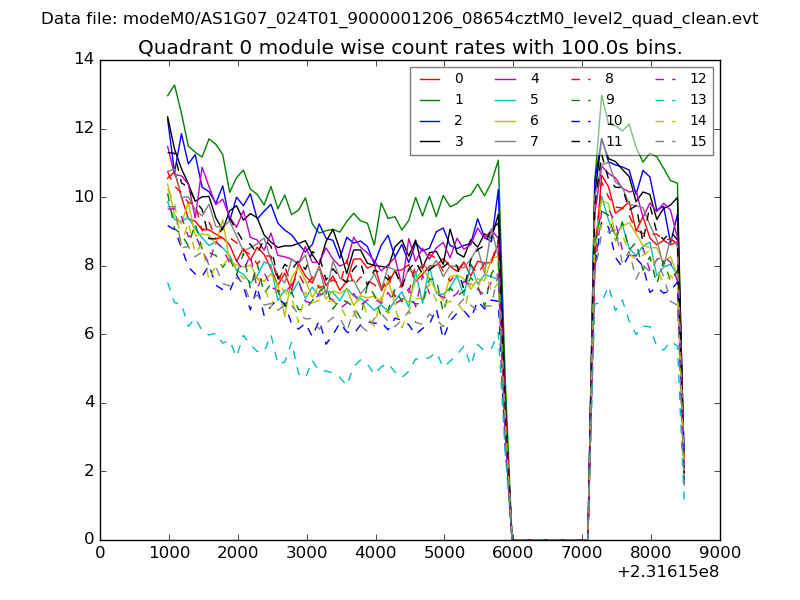 |
 |
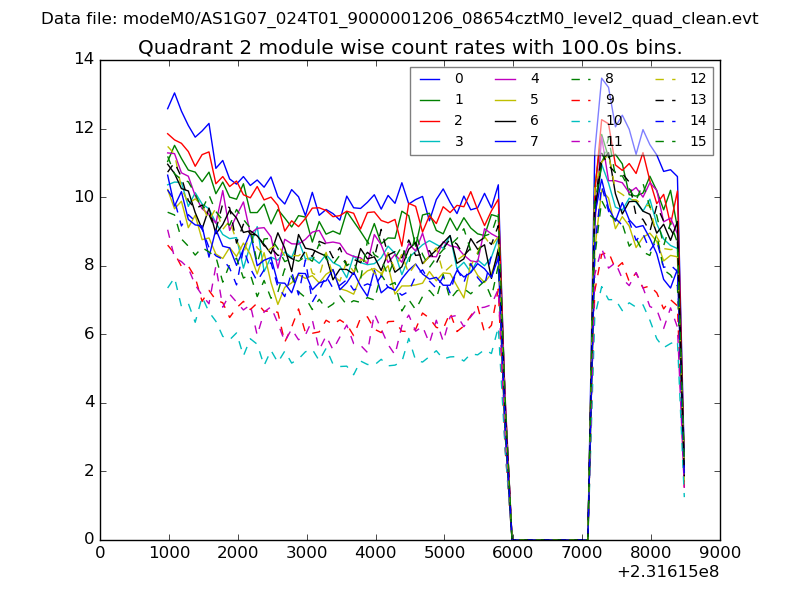
| Module-wise count rates for Quadrant B Data is divided into 100 sec bins |
 |
 |
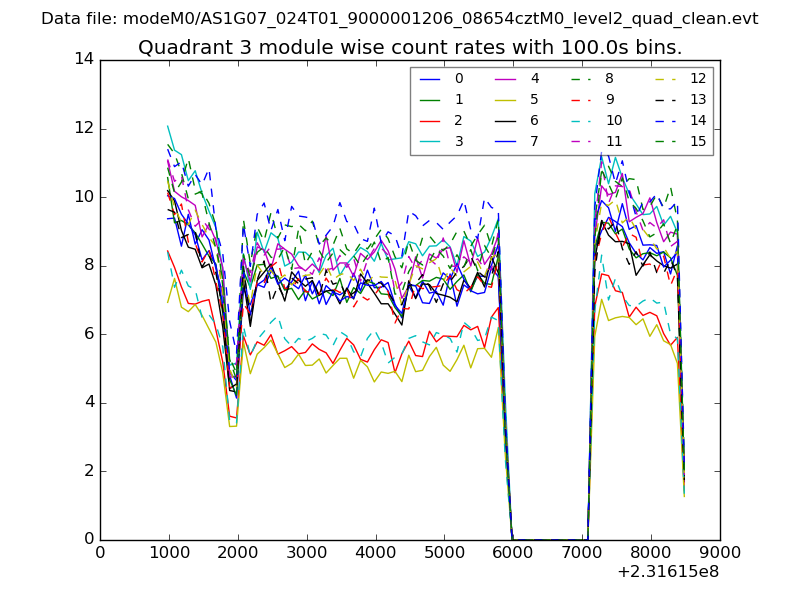
| Module-wise count rates for Quadrant C Data is divided into 100 sec bins |
 |
 |
| Module-wise count rates for Quadrant D Data is divided into 100 sec bins |
 |
 |
| Parameter | Plot |
|---|---|
| CZT HV Monitor | 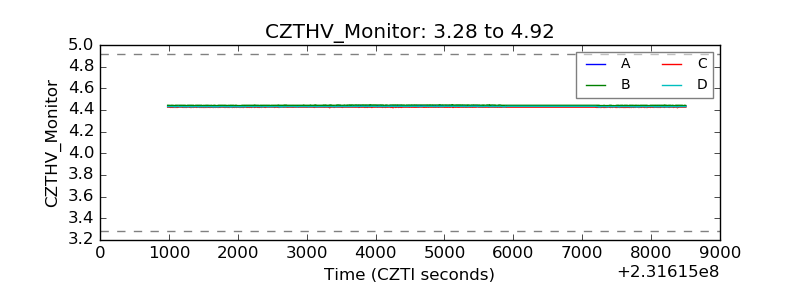 |
| D_VDD |  |
| Temperature 1 | 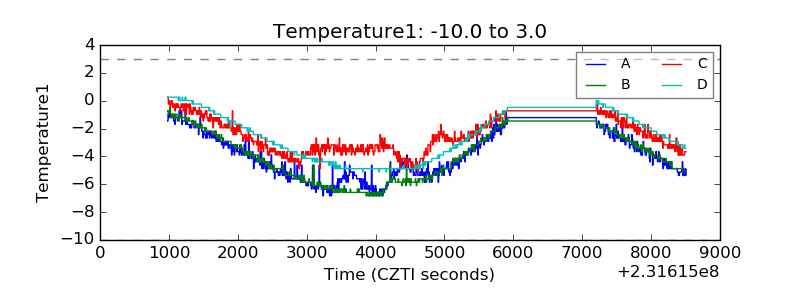 |
| Veto HV Monitor | 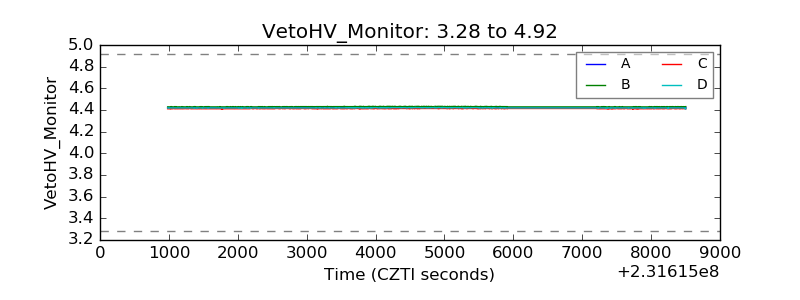 |
| Veto LLD | 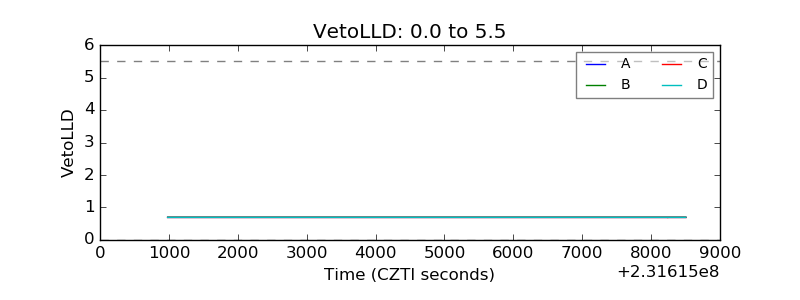 |
| Alpha Counter | 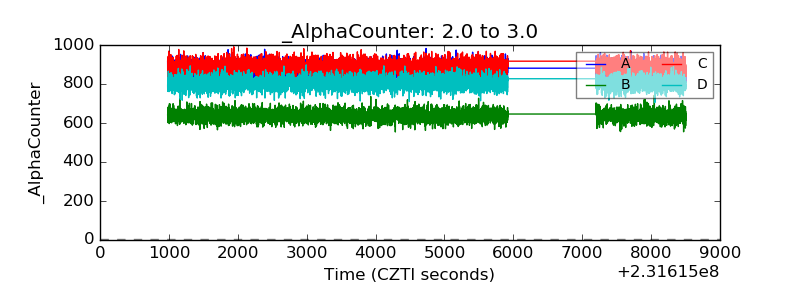 |
| _CPM_Rate | 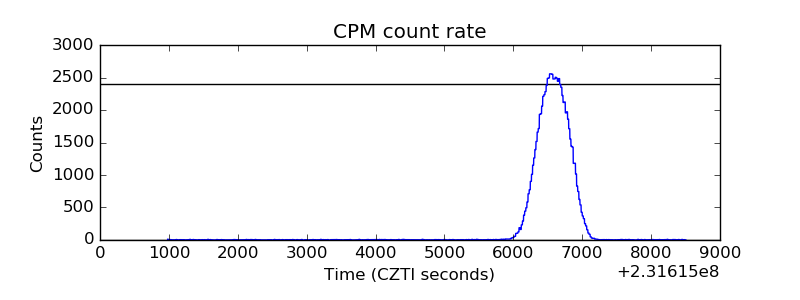 |
| CZT Counter |  |
| +2.5 Volts monitor |  |
| +5 Volts monitor |  |
| _ROLL_ROT | 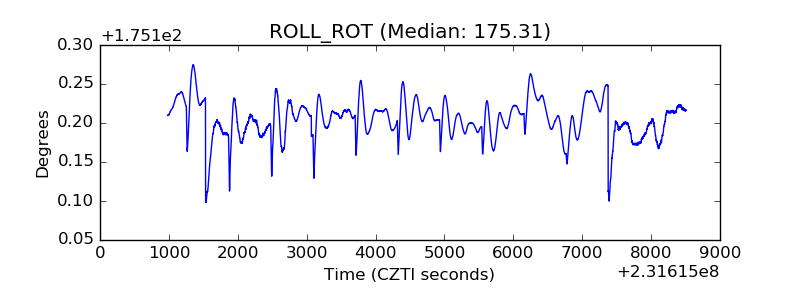 |
| _Roll_DEC | 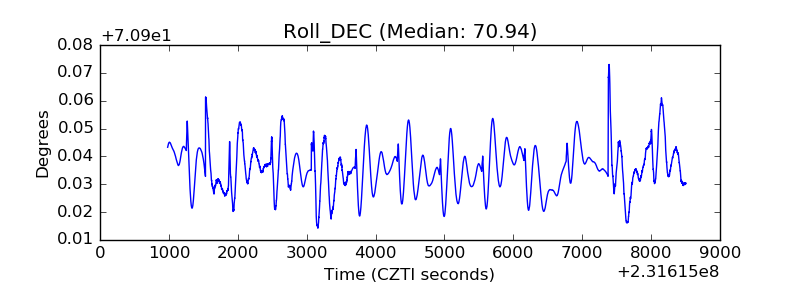 |
| _Roll_RA | 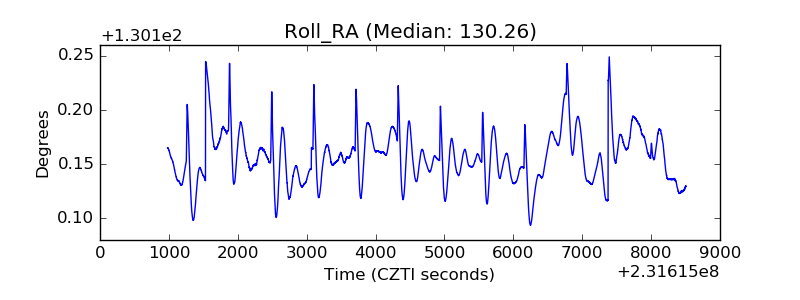 |
| Veto Counter | 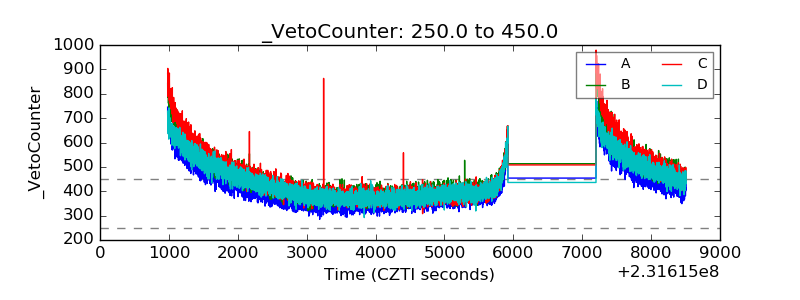 |