| Param | Original file | Final file |
|---|---|---|
| Filename | modeM0/AS1G07_024T01_9000001206_08655cztM0_level2.evt | modeM0/AS1G07_024T01_9000001206_08655cztM0_level2_quad_clean.evt |
| Size (bytes) | 463,590,720 | 124,781,760 |
| Size | 442.1 MB | 119.0 MB |
| Events in quadrant A | 2,918,571 | 835,101 |
| Events in quadrant B | 3,136,409 | 871,191 |
| Events in quadrant C | 3,120,106 | 862,978 |
| Events in quadrant D | 4,434,105 | 767,960 |
| Mode M0 | |||
|---|---|---|---|
| Quadrant | BADHDUFLAG | Total packets | Discarded packets |
| A | 0 | 13090 | 3 |
| B | 0 | 13655 | 2 |
| C | 0 | 13618 | 2 |
| D | 0 | 17772 | 2 |
| Mode M9 | |||
|---|---|---|---|
| Quadrant | BADHDUFLAG | Total packets | Discarded packets |
| A | 0 | 14 | 0 |
| B | 0 | 14 | 0 |
| C | 0 | 14 | 0 |
| D | 0 | 15 | 0 |
| Mode SS | |||
|---|---|---|---|
| Quadrant | BADHDUFLAG | Total packets | Discarded packets |
| A | 0 | 128 | 0 |
| B | 0 | 128 | 0 |
| C | 0 | 128 | 0 |
| D | 0 | 128 | 0 |
| Quadrant | Total seconds | Saturated seconds | Saturation percentage |
|---|---|---|---|
| A | 6337 | 26 | 0.410289% |
| B | 6337 | 36 | 0.568092% |
| C | 6337 | 50 | 0.789017% |
| D | 6337 | 605 | 9.547104% |
Noise dominated data is calculated using 1-second bins in cleaned event files. If a bin has >2000 counts, and if more than 50% of those come from <1% of pixels, then it is considered to be noise-dominated and hence unusable.
| Quadrant | # 1 sec bins | Bins with >0 counts | Bins with >2000 counts | High rate bins dominated by noise | Noise dominated (total time) | Noise dominated (detector-on time) | Marked lightcurve |
|---|---|---|---|---|---|---|---|
| A | 7622 | 6338 | 0 | 0 | 0.00% | 0.00% | 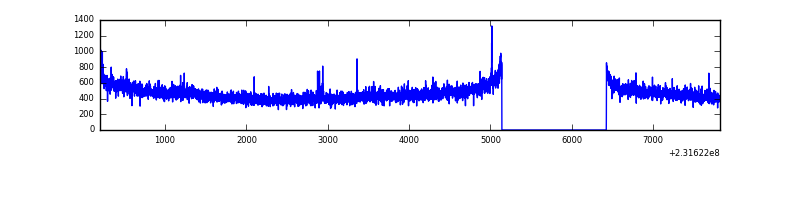 |
| B | 7622 | 6338 | 2 | 2 | 0.03% | 0.03% | 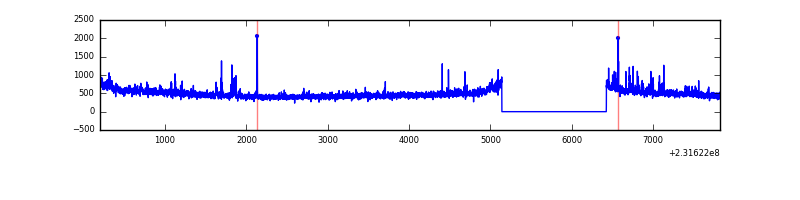 |
| C | 7622 | 6337 | 16 | 16 | 0.21% | 0.25% | 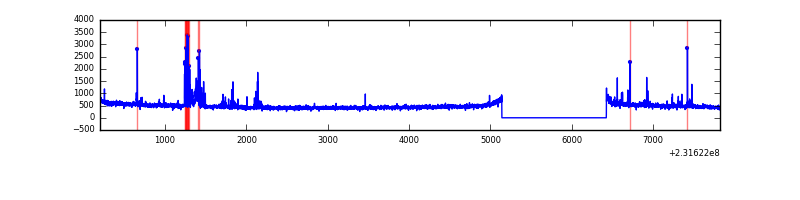 |
| D | 7621 | 6336 | 418 | 418 | 5.48% | 6.60% | 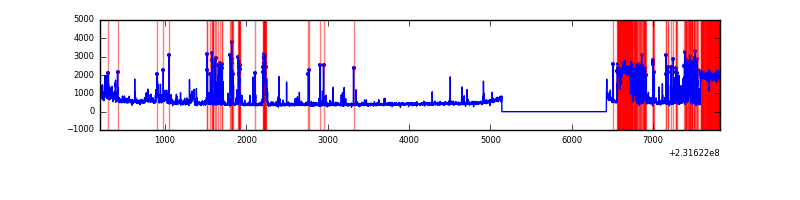 |
Top three noisy pixels from each quadrant. If the there are fewer than three noisy pixels in the level2.evt file, extra rows are filled as -1
| Pixel properties | Quadrant properties | ||||||
|---|---|---|---|---|---|---|---|
| Quadrant | DetID | PixID | Counts | Sigma | Mean | Median | Sigma |
| A | 8 | 5 | 60546 | 403.53 | 741 | 726 | 148.2 |
| A | 0 | 226 | 6986 | 42.23 | 741 | 726 | 148.2 |
| A | 12 | 194 | 6631 | 39.83 | 741 | 726 | 148.2 |
| B | 0 | 219 | 42837 | 300.42 | 762 | 746 | 140.1 |
| B | 0 | 230 | 18667 | 127.91 | 762 | 746 | 140.1 |
| B | 10 | 246 | 17816 | 121.83 | 762 | 746 | 140.1 |
| C | 4 | 254 | 146328 | 854.18 | 745 | 749 | 170.4 |
| C | 1 | 16 | 35041 | 201.21 | 745 | 749 | 170.4 |
| C | 8 | 128 | 9664 | 52.31 | 745 | 749 | 170.4 |
| D | 13 | 137 | 1004670 | 5941.28 | 698 | 676 | 169.0 |
| D | 2 | 152 | 334517 | 1975.55 | 698 | 676 | 169.0 |
| D | 12 | 233 | 220665 | 1301.82 | 698 | 676 | 169.0 |
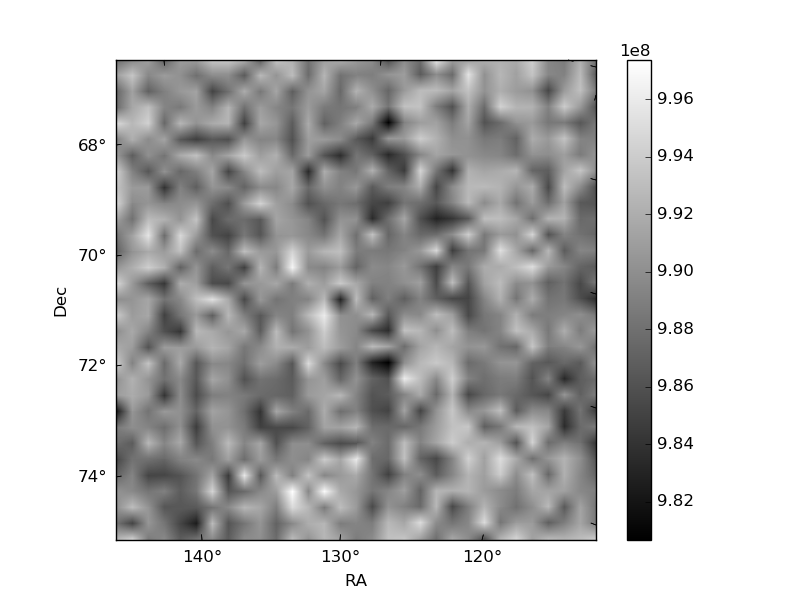
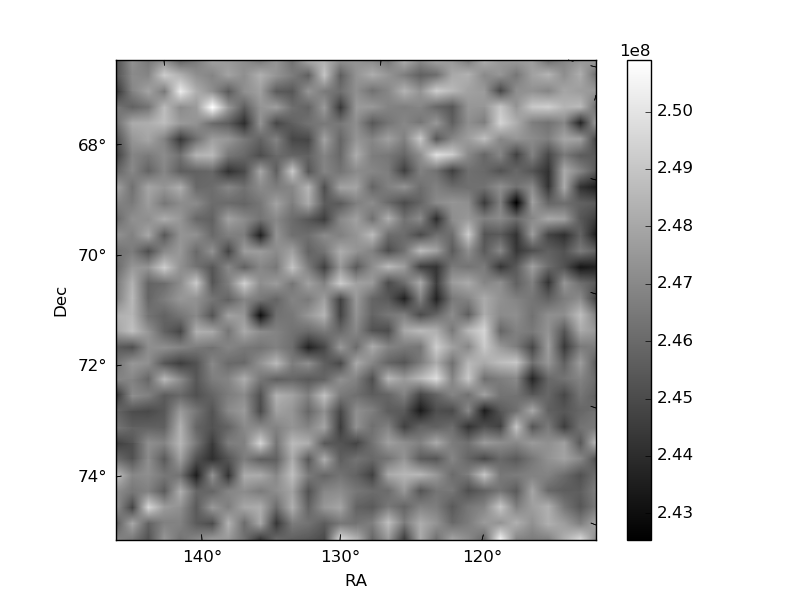
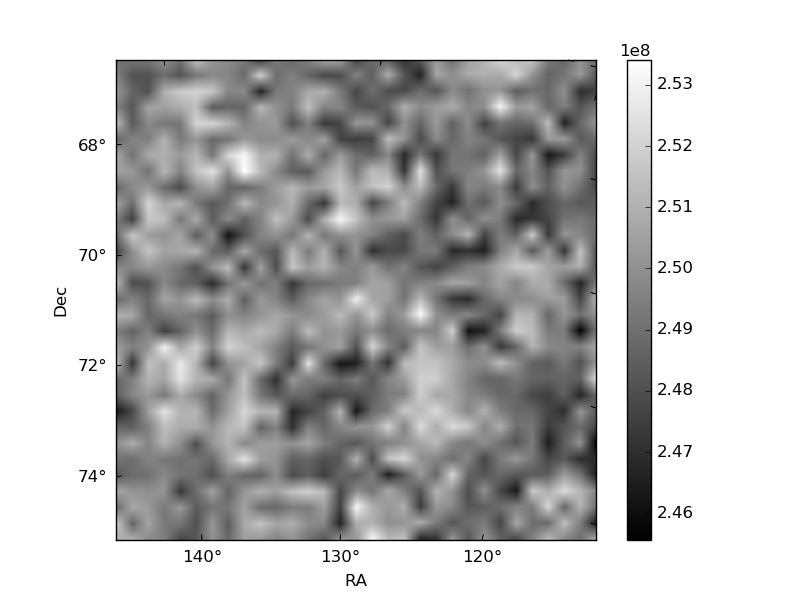
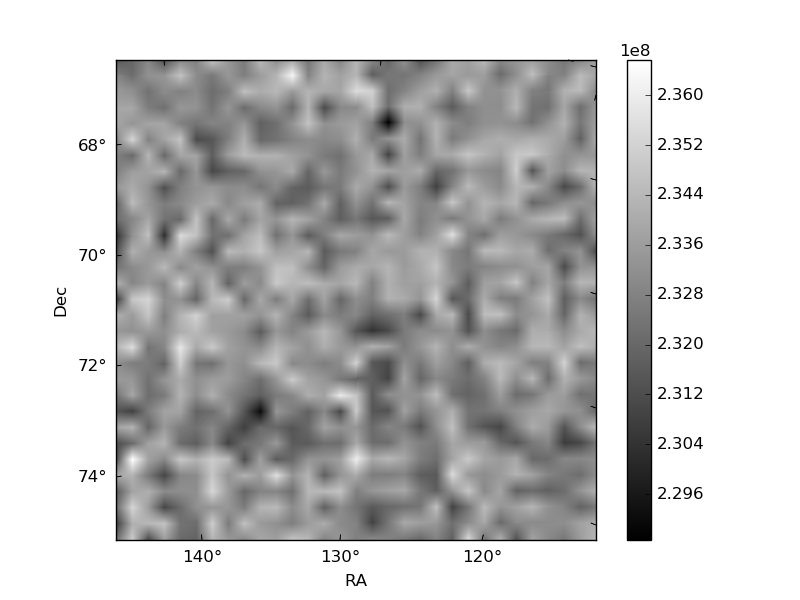
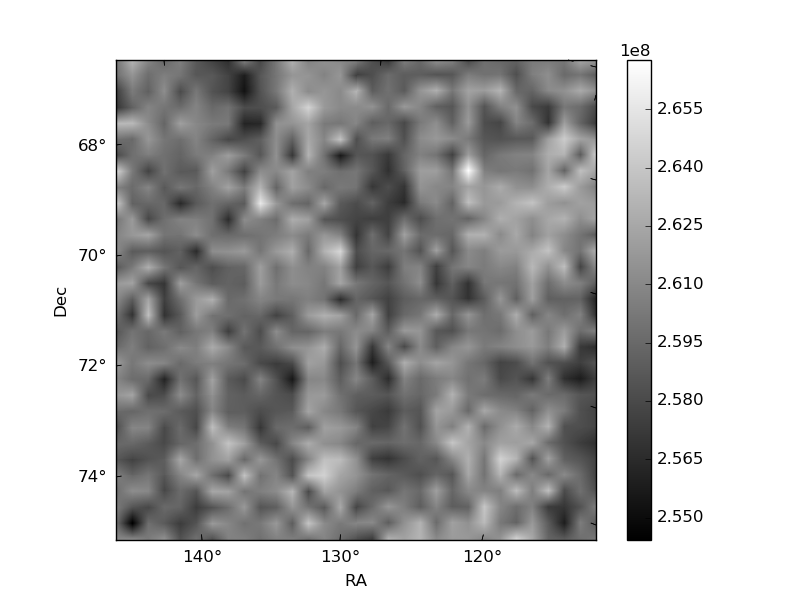
Histogram calculated using DETX and DETY for each event in the final _common_clean file
| Quadrant A | 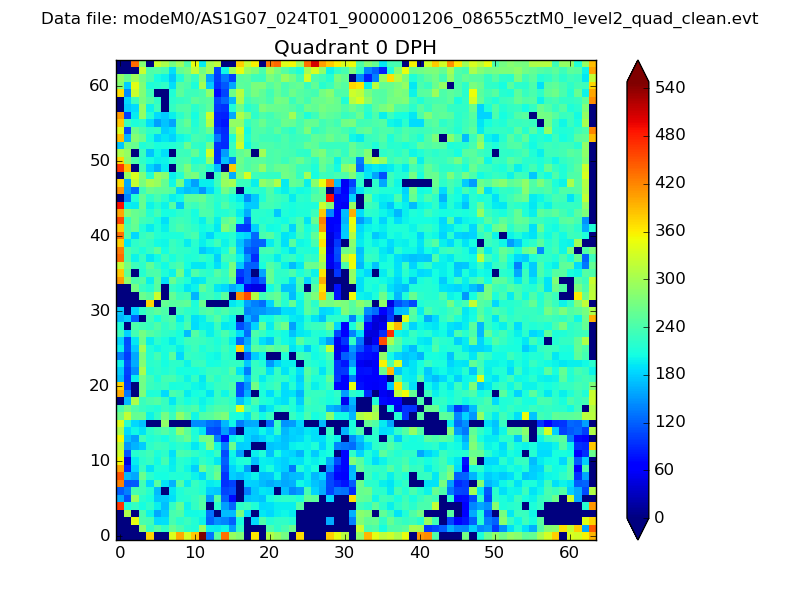 |
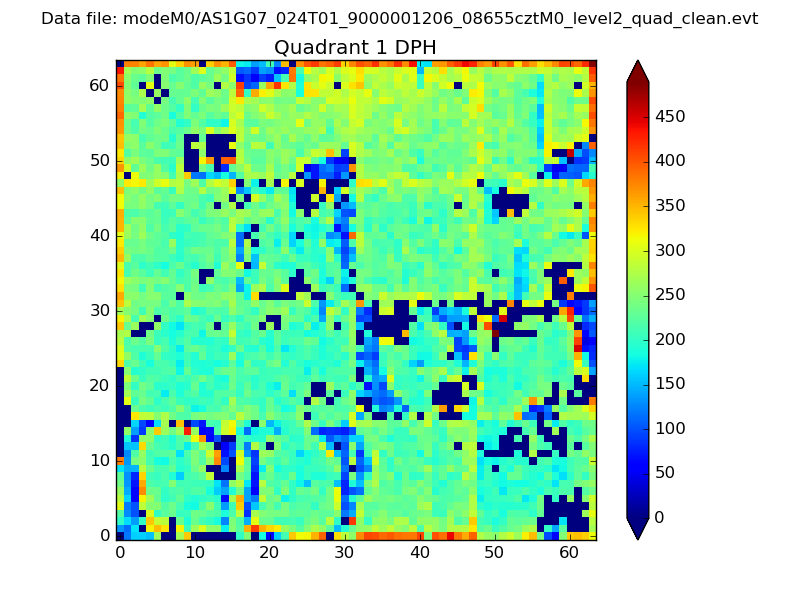 |
Quadrant B |
|---|---|---|---|
| Quadrant D | 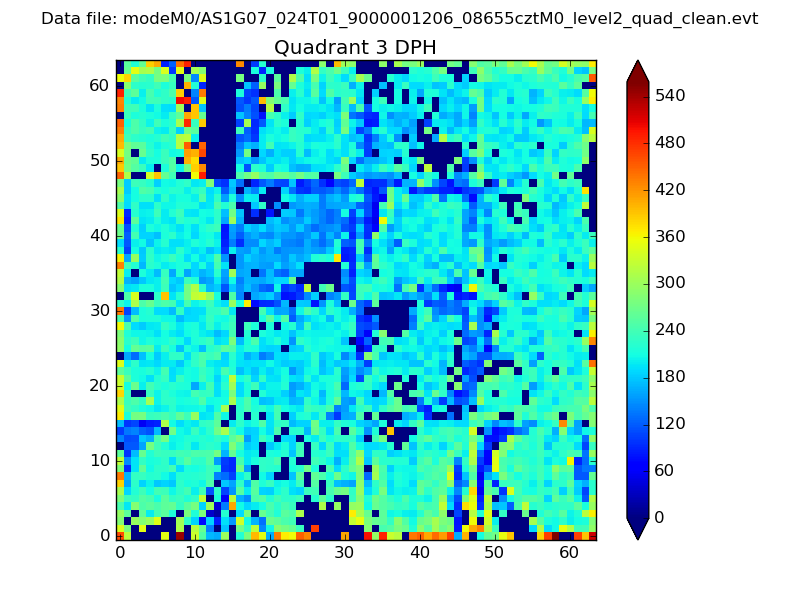 |
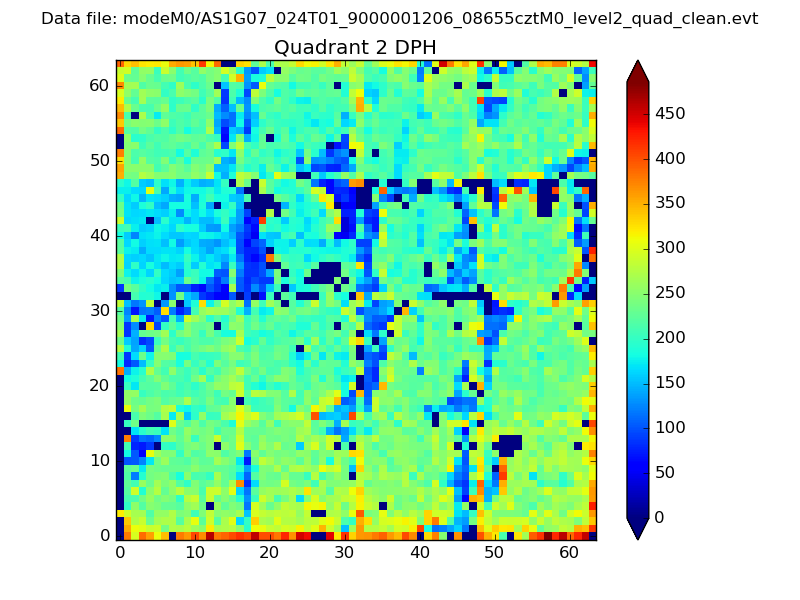 |
Quadrant C |
| Plot type | Count rate plots | Images |
|---|---|---|
| Comparison with Poisson distribution Blue bars denote a histogram of data divided into 1 sec bins. Red curve is a Poisson curve with rate = median count rate of data. |
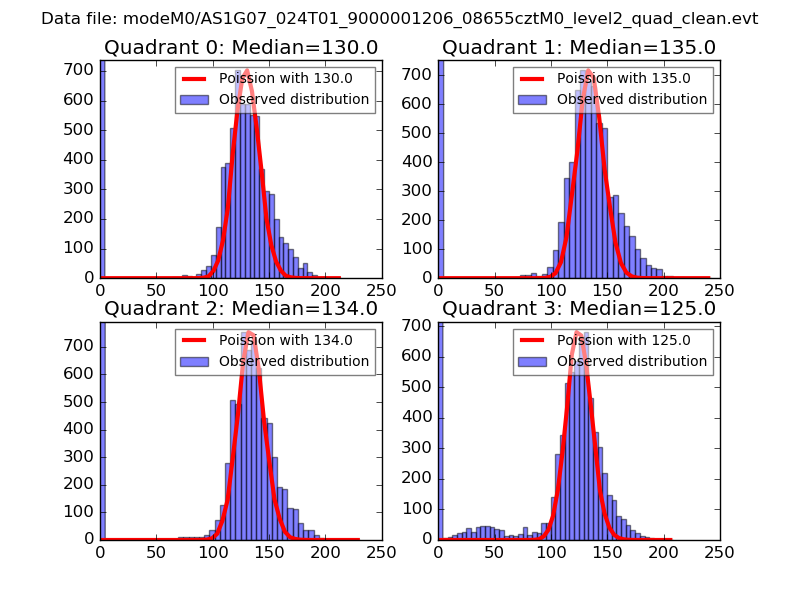 |
 |
| Quadrant-wise count rates Data is divided into 100 sec bins |
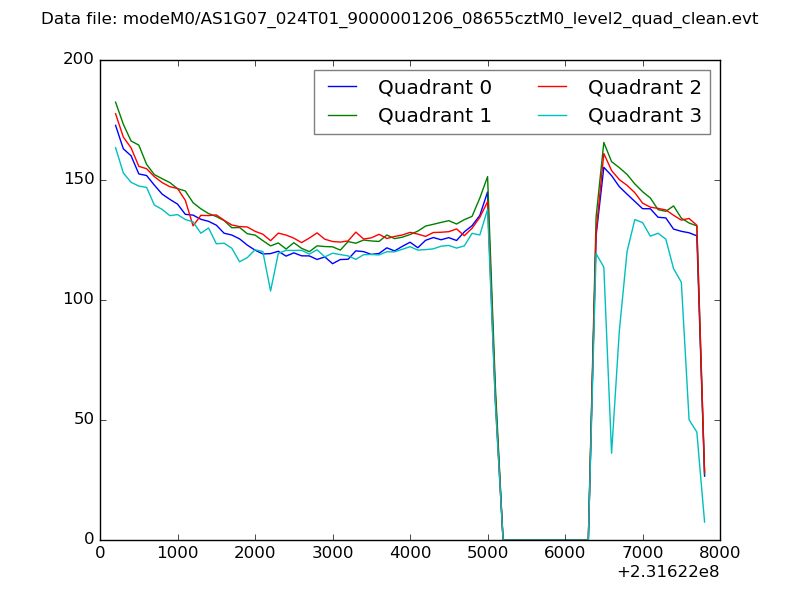 |
|
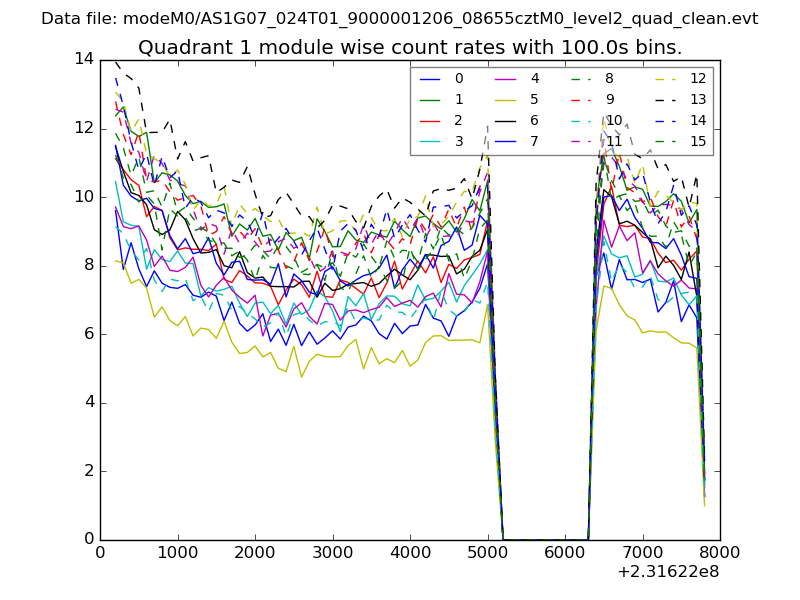
| Module-wise count rates for Quadrant A Data is divided into 100 sec bins |
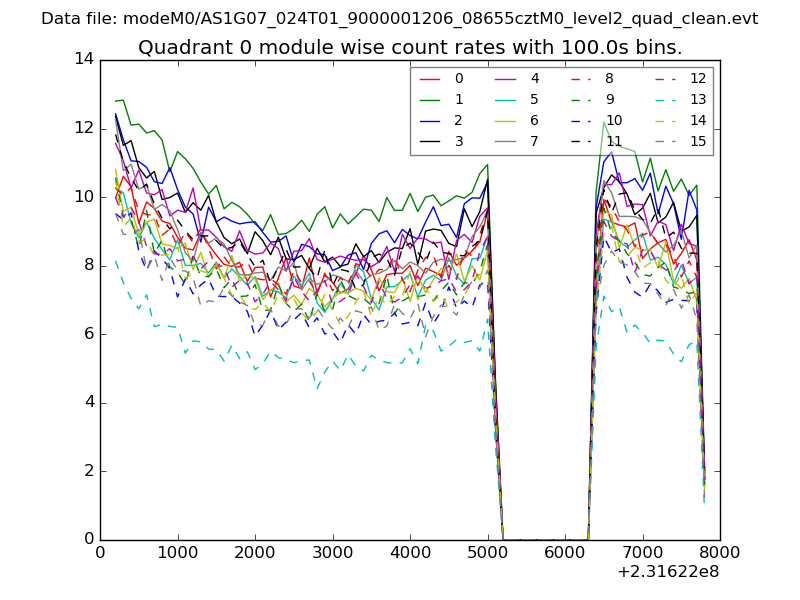 |
 |
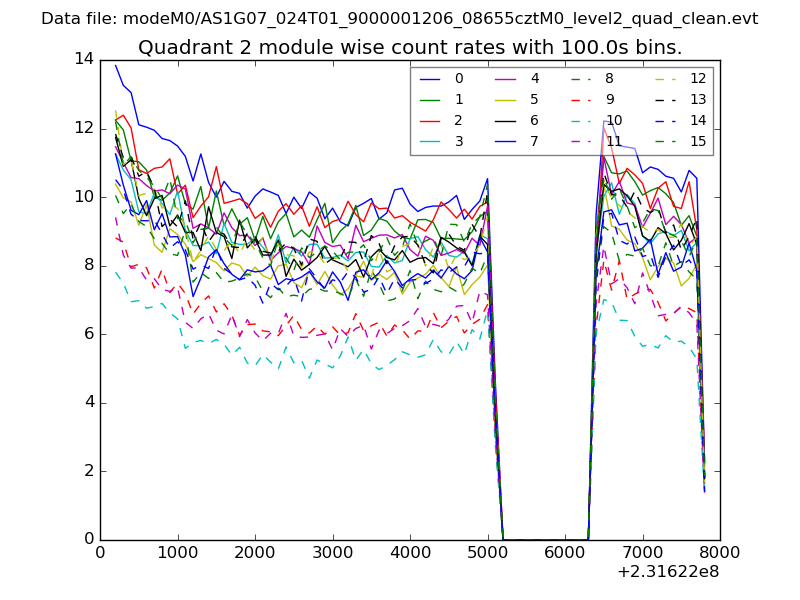
| Module-wise count rates for Quadrant B Data is divided into 100 sec bins |
 |
 |
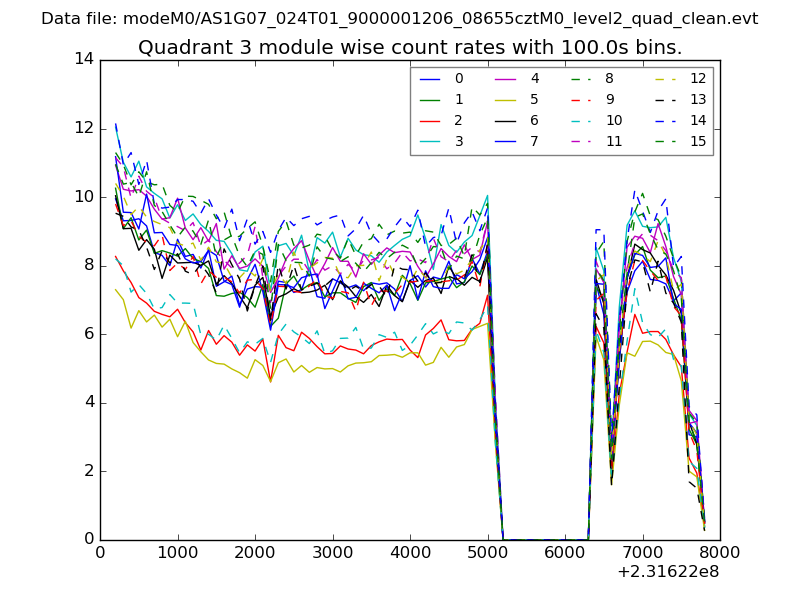
| Module-wise count rates for Quadrant C Data is divided into 100 sec bins |
 |
 |
| Module-wise count rates for Quadrant D Data is divided into 100 sec bins |
 |
 |
| Parameter | Plot |
|---|---|
| CZT HV Monitor | 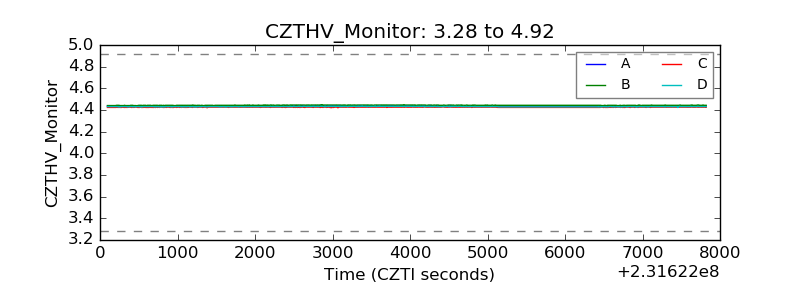 |
| D_VDD | 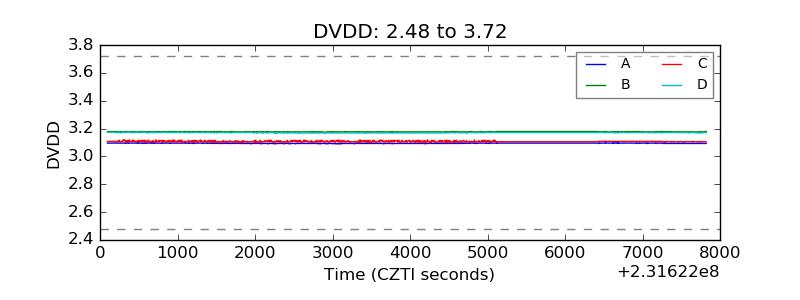 |
| Temperature 1 | 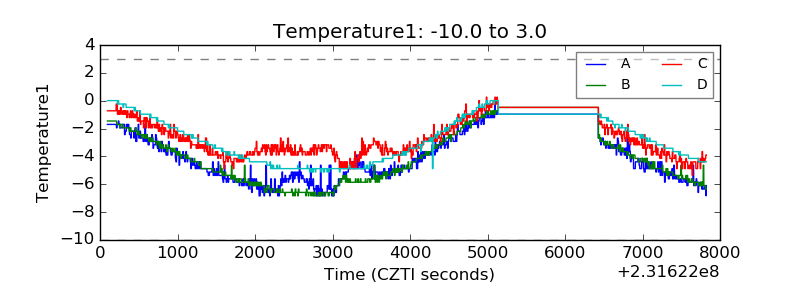 |
| Veto HV Monitor | 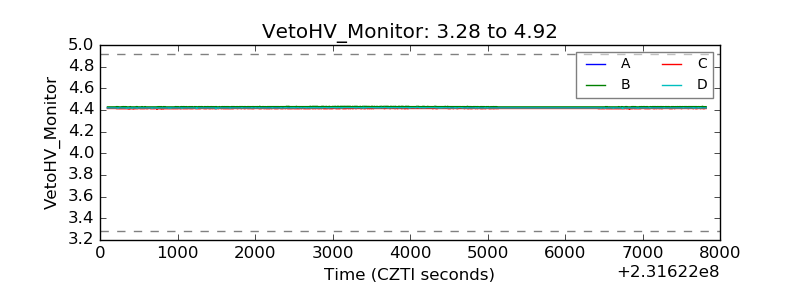 |
| Veto LLD | 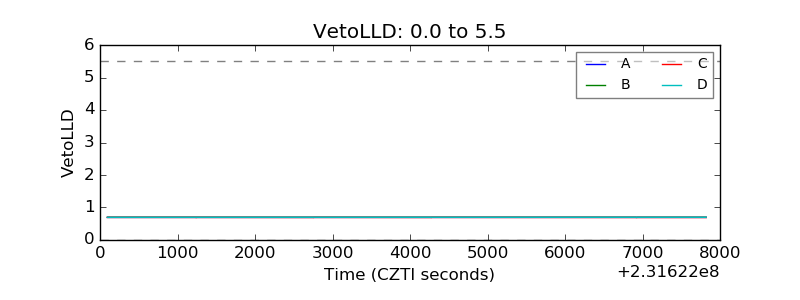 |
| Alpha Counter | 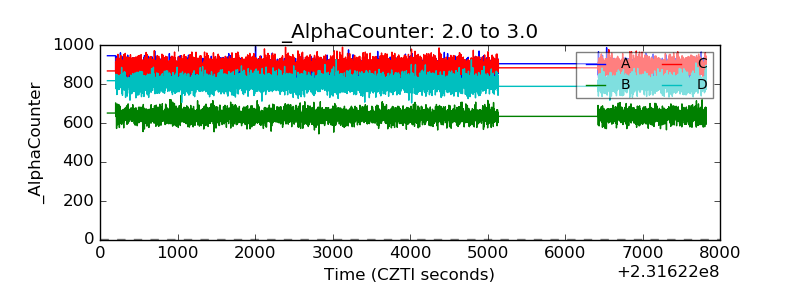 |
| _CPM_Rate | 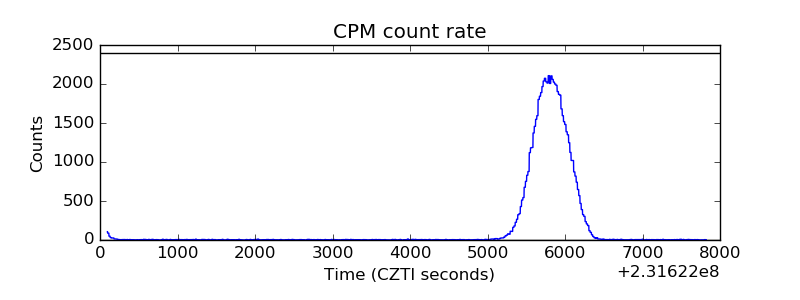 |
| CZT Counter | 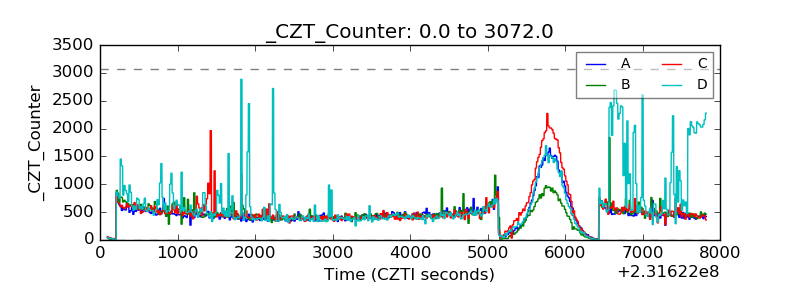 |
| +2.5 Volts monitor | 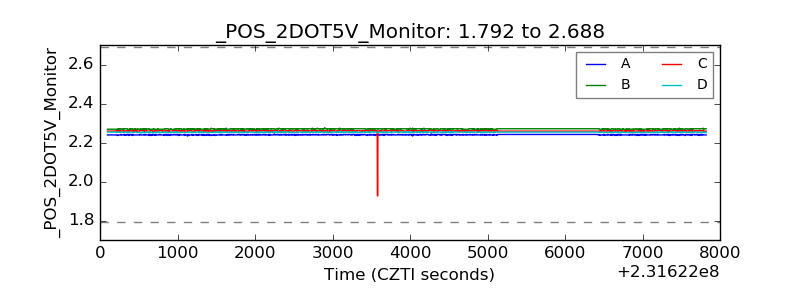 |
| +5 Volts monitor | 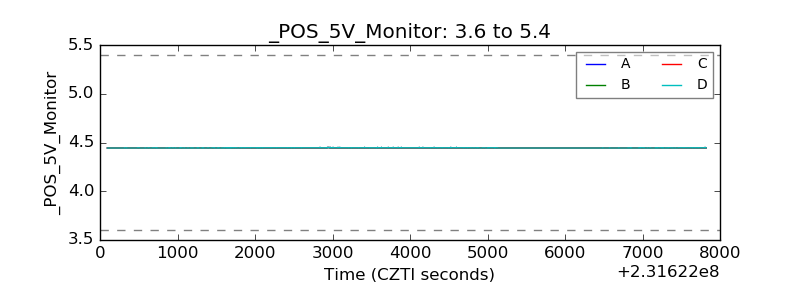 |
| _ROLL_ROT | 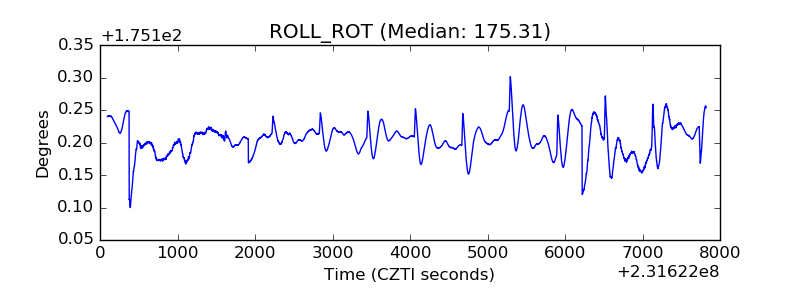 |
| _Roll_DEC | 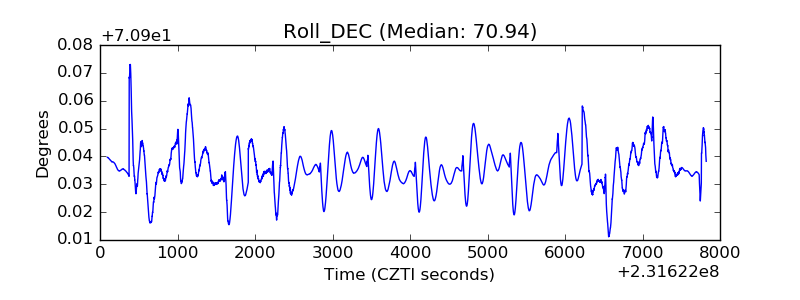 |
| _Roll_RA | 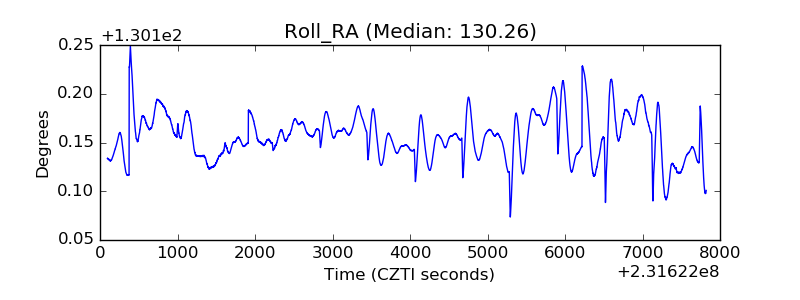 |
| Veto Counter | 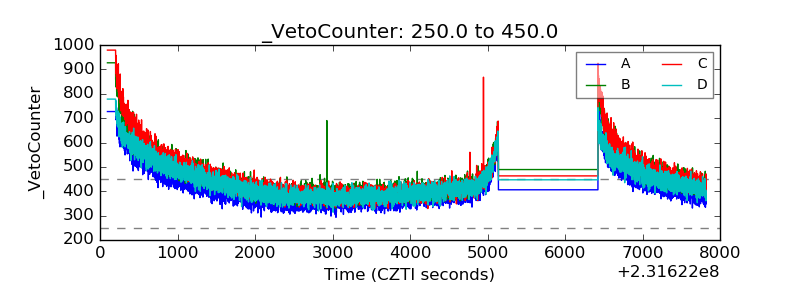 |