| Param | Original file | Final file |
|---|---|---|
| Filename | modeM0/AS1G07_024T01_9000001206_08657cztM0_level2.evt | modeM0/AS1G07_024T01_9000001206_08657cztM0_level2_quad_clean.evt |
| Size (bytes) | 438,465,600 | 124,882,560 |
| Size | 418.2 MB | 119.1 MB |
| Events in quadrant A | 3,040,250 | 820,267 |
| Events in quadrant B | 3,487,148 | 845,438 |
| Events in quadrant C | 2,946,355 | 844,463 |
| Events in quadrant D | 3,342,420 | 798,145 |
| Mode M0 | |||
|---|---|---|---|
| Quadrant | BADHDUFLAG | Total packets | Discarded packets |
| A | 0 | 14020 | 3 |
| B | 0 | 15015 | 2 |
| C | 0 | 13844 | 2 |
| D | 0 | 14975 | 2 |
| Mode M9 | |||
|---|---|---|---|
| Quadrant | BADHDUFLAG | Total packets | Discarded packets |
| A | 0 | 16 | 0 |
| B | 0 | 16 | 0 |
| C | 0 | 16 | 0 |
| D | 0 | 17 | 0 |
| Mode SS | |||
|---|---|---|---|
| Quadrant | BADHDUFLAG | Total packets | Discarded packets |
| A | 0 | 138 | 0 |
| B | 0 | 138 | 0 |
| C | 0 | 138 | 0 |
| D | 0 | 138 | 0 |
| Quadrant | Total seconds | Saturated seconds | Saturation percentage |
|---|---|---|---|
| A | 6805 | 25 | 0.367377% |
| B | 6805 | 85 | 1.249082% |
| C | 6805 | 10 | 0.146951% |
| D | 6805 | 77 | 1.131521% |
Noise dominated data is calculated using 1-second bins in cleaned event files. If a bin has >2000 counts, and if more than 50% of those come from <1% of pixels, then it is considered to be noise-dominated and hence unusable.
| Quadrant | # 1 sec bins | Bins with >0 counts | Bins with >2000 counts | High rate bins dominated by noise | Noise dominated (total time) | Noise dominated (detector-on time) | Marked lightcurve |
|---|---|---|---|---|---|---|---|
| A | 7910 | 6806 | 10 | 10 | 0.13% | 0.15% | 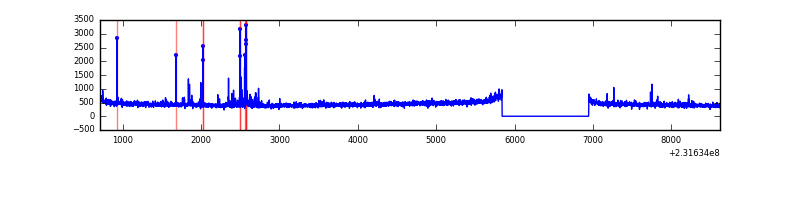 |
| B | 7910 | 6806 | 36 | 36 | 0.46% | 0.53% | 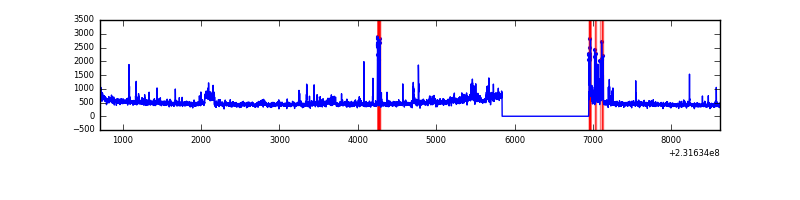 |
| C | 7910 | 6806 | 0 | 0 | 0.00% | 0.00% |  |
| D | 7910 | 6806 | 61 | 61 | 0.77% | 0.90% | 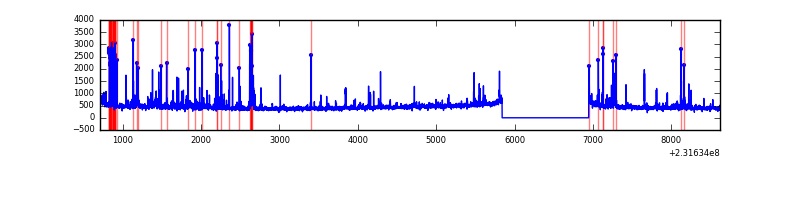 |
Top three noisy pixels from each quadrant. If the there are fewer than three noisy pixels in the level2.evt file, extra rows are filled as -1
| Pixel properties | Quadrant properties | ||||||
|---|---|---|---|---|---|---|---|
| Quadrant | DetID | PixID | Counts | Sigma | Mean | Median | Sigma |
| A | 5 | 16 | 72580 | 473.62 | 755 | 738 | 151.7 |
| A | 8 | 5 | 45157 | 292.83 | 755 | 738 | 151.7 |
| A | 15 | 174 | 11055 | 68.01 | 755 | 738 | 151.7 |
| B | 10 | 16 | 135864 | 946.37 | 771 | 753 | 142.8 |
| B | 5 | 175 | 123368 | 858.84 | 771 | 753 | 142.8 |
| B | 0 | 219 | 99262 | 689.99 | 771 | 753 | 142.8 |
| C | 1 | 16 | 22228 | 125.13 | 748 | 754 | 171.6 |
| C | 8 | 222 | 5974 | 30.42 | 748 | 754 | 171.6 |
| C | 13 | 61 | 5816 | 29.5 | 748 | 754 | 171.6 |
| D | 12 | 233 | 171992 | 960.92 | 735 | 710 | 178.2 |
| D | 2 | 152 | 152636 | 852.33 | 735 | 710 | 178.2 |
| D | 2 | 14 | 63148 | 350.29 | 735 | 710 | 178.2 |
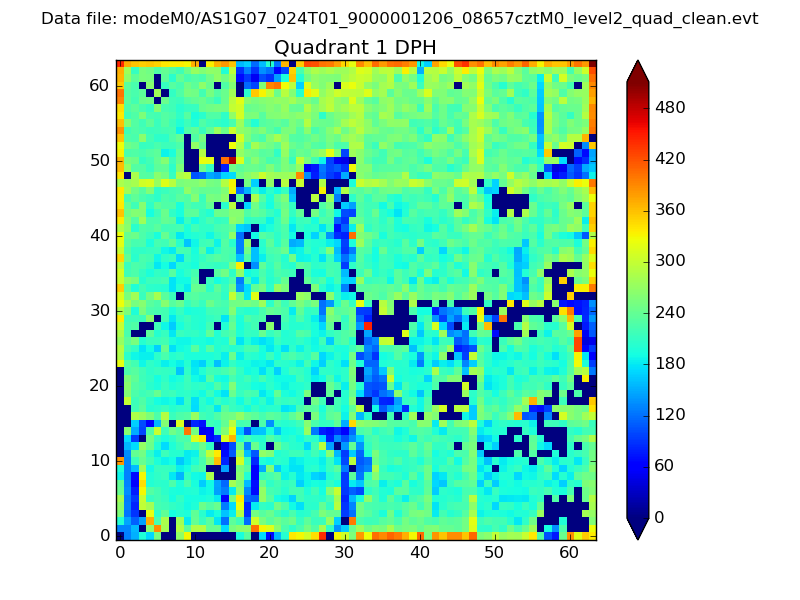
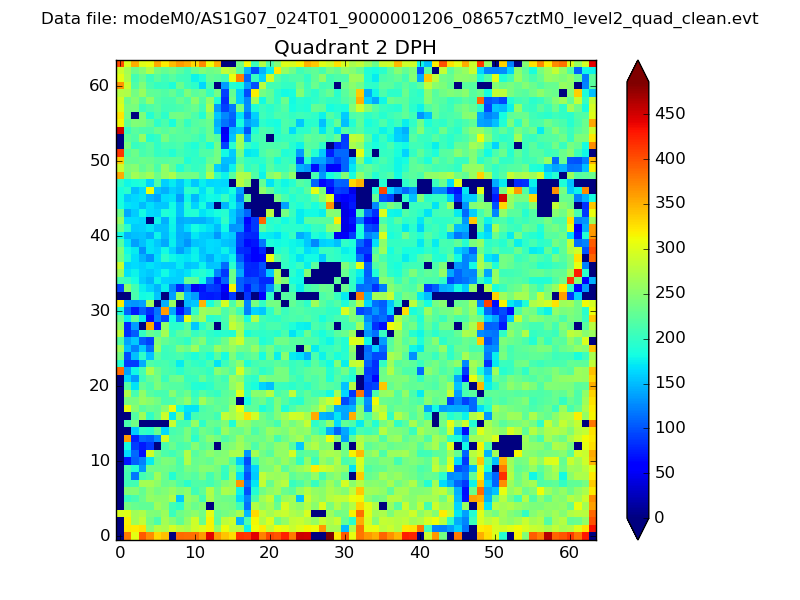
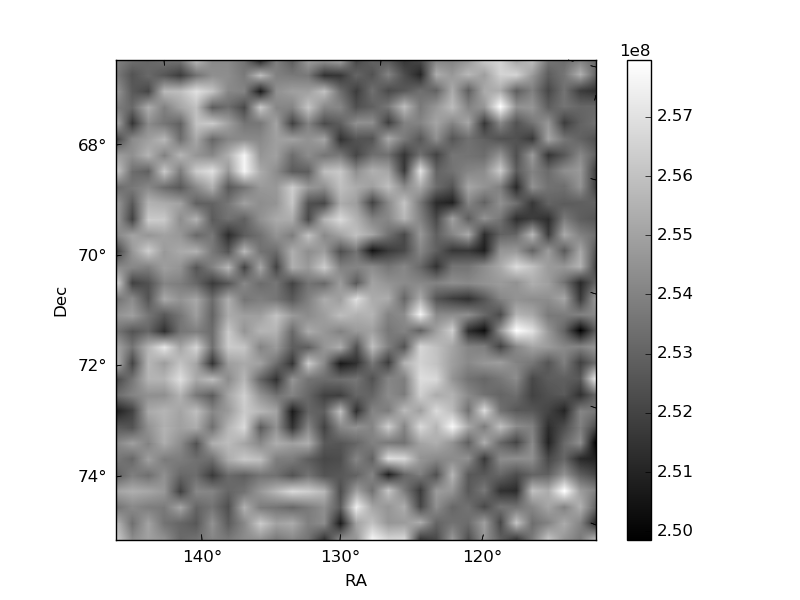
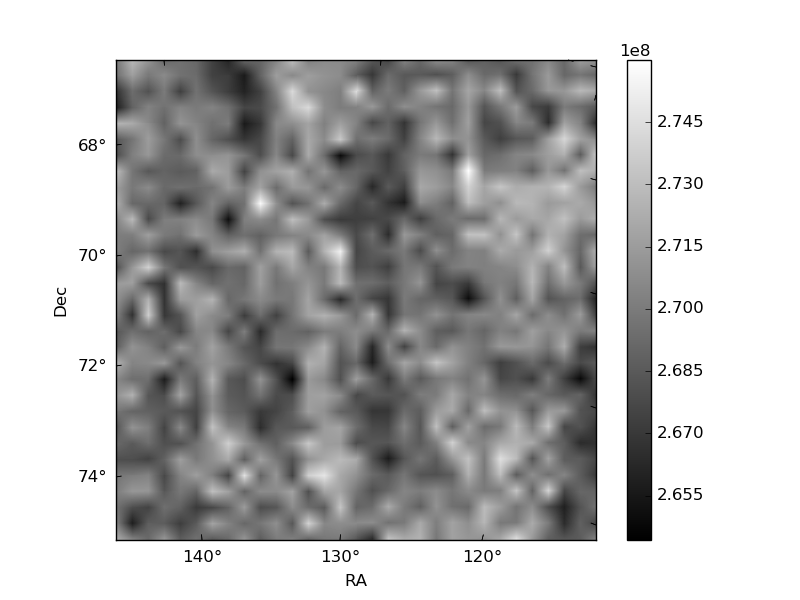
Histogram calculated using DETX and DETY for each event in the final _common_clean file
| Quadrant A | 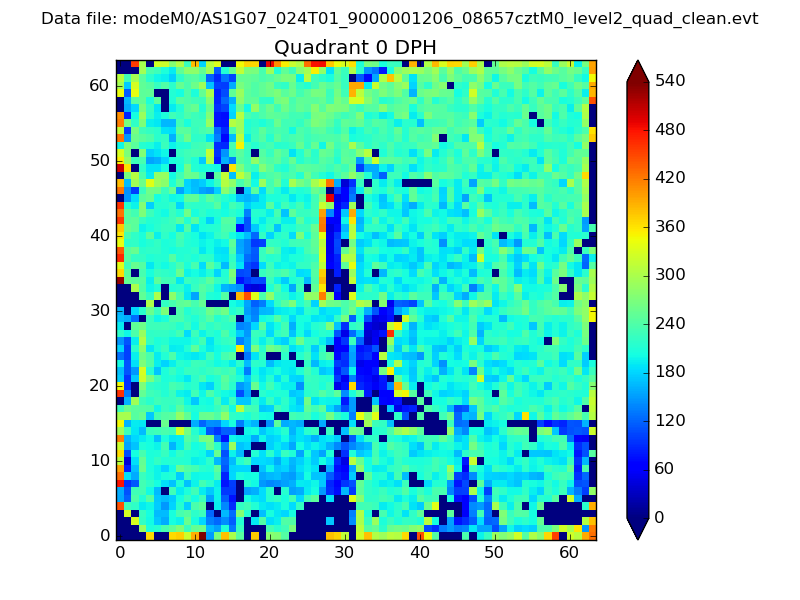 |
 |
Quadrant B |
|---|---|---|---|
| Quadrant D | 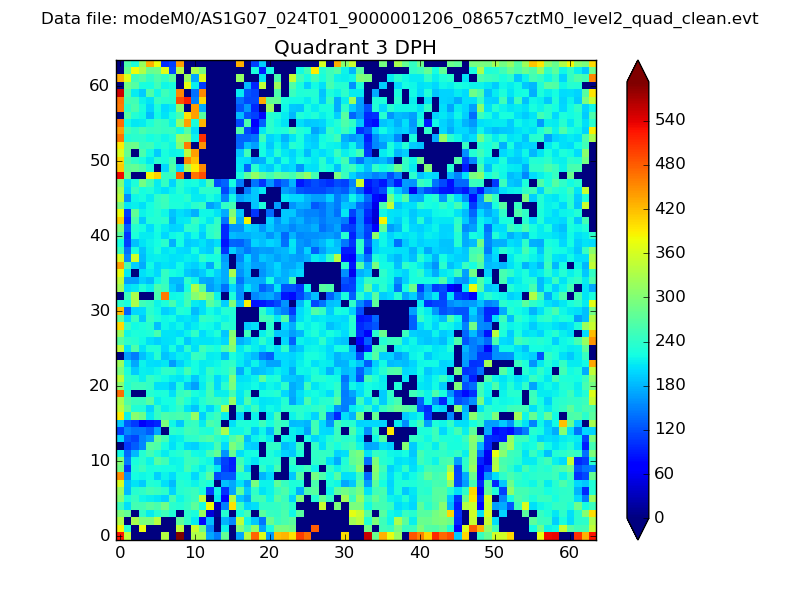 |
 |
Quadrant C |
| Plot type | Count rate plots | Images |
|---|---|---|
| Comparison with Poisson distribution Blue bars denote a histogram of data divided into 1 sec bins. Red curve is a Poisson curve with rate = median count rate of data. |
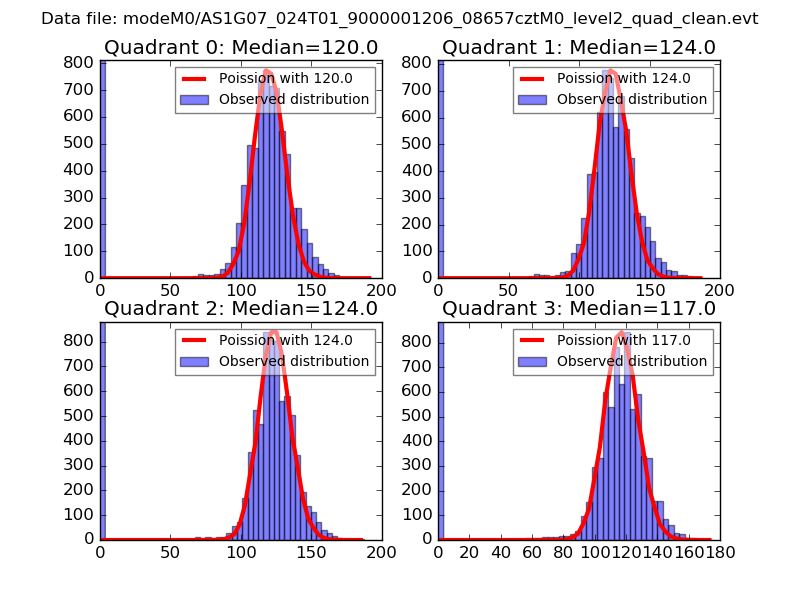 |
 |
| Quadrant-wise count rates Data is divided into 100 sec bins |
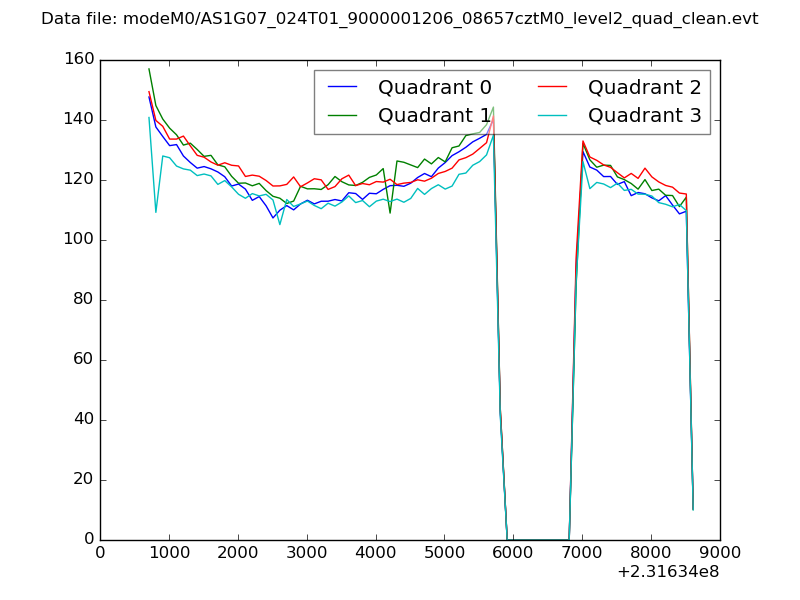 |
|
| Module-wise count rates for Quadrant A Data is divided into 100 sec bins |
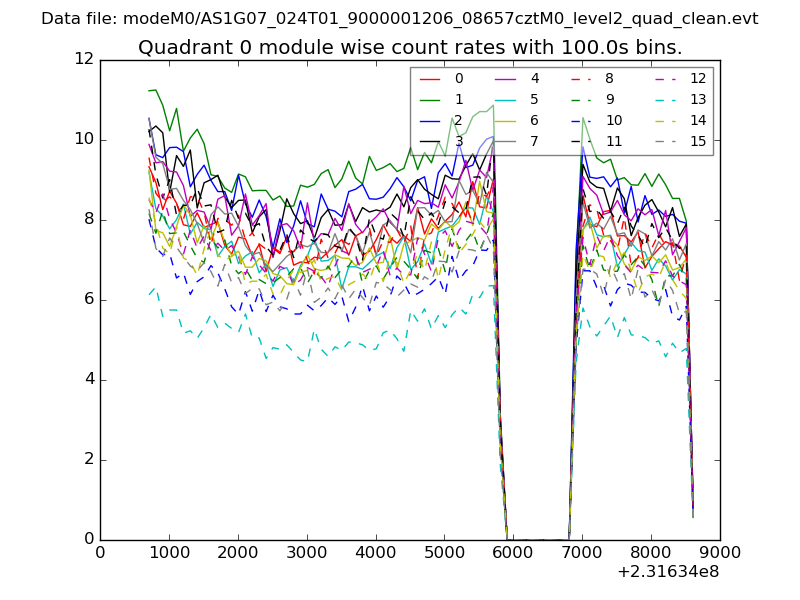 |
 |
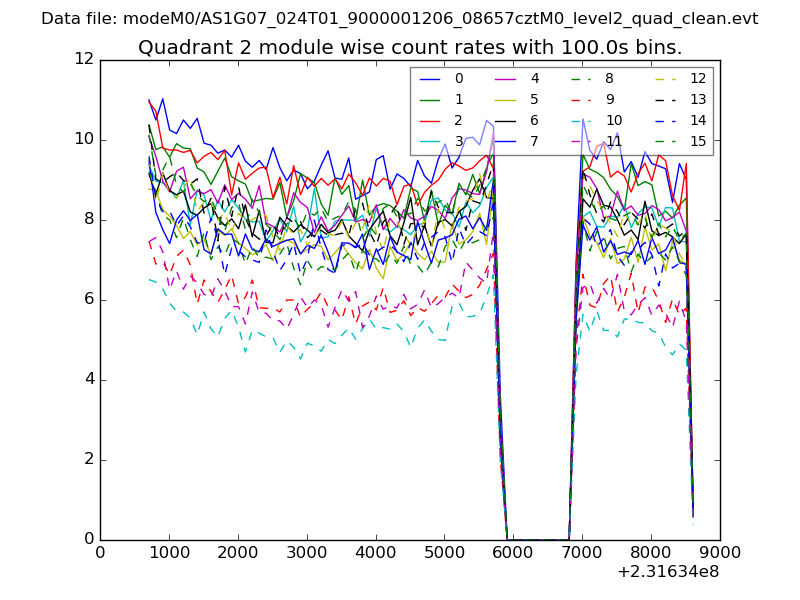
| Module-wise count rates for Quadrant B Data is divided into 100 sec bins |
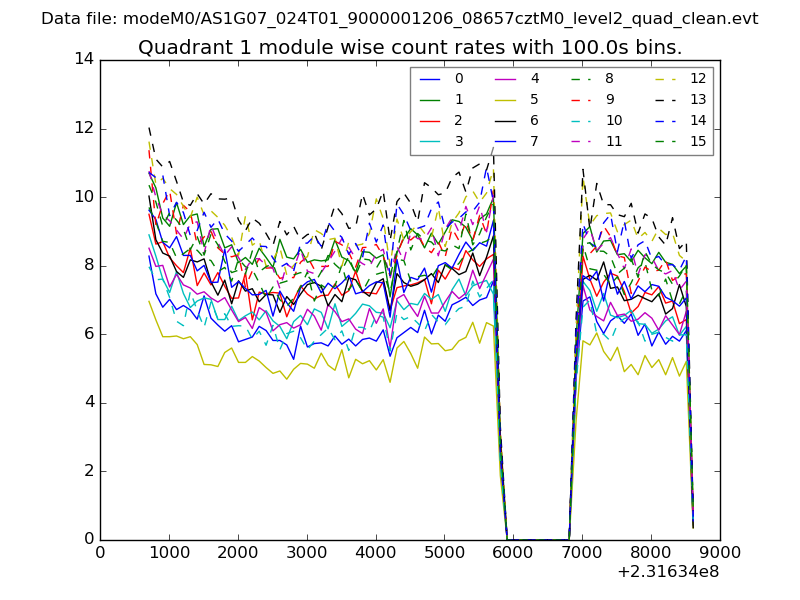 |
 |
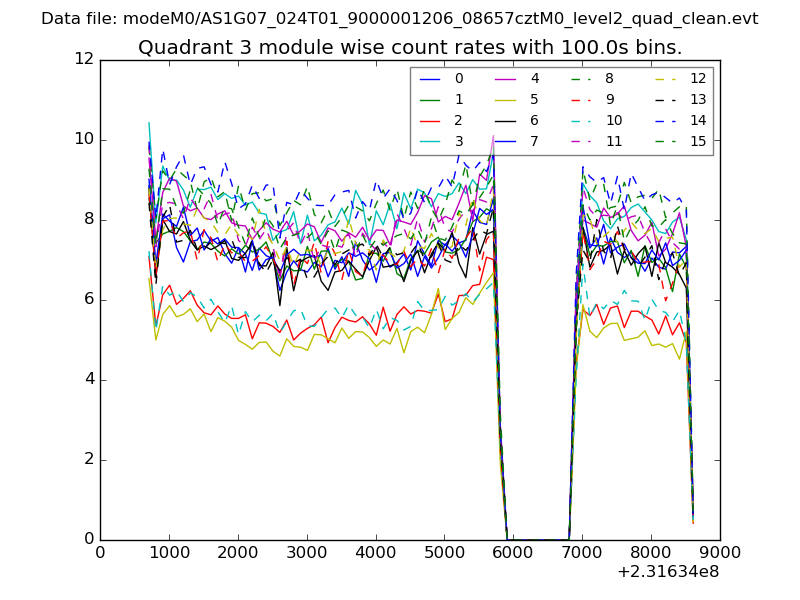
| Module-wise count rates for Quadrant C Data is divided into 100 sec bins |
 |
 |
| Module-wise count rates for Quadrant D Data is divided into 100 sec bins |
 |
 |
| Parameter | Plot |
|---|---|
| CZT HV Monitor | 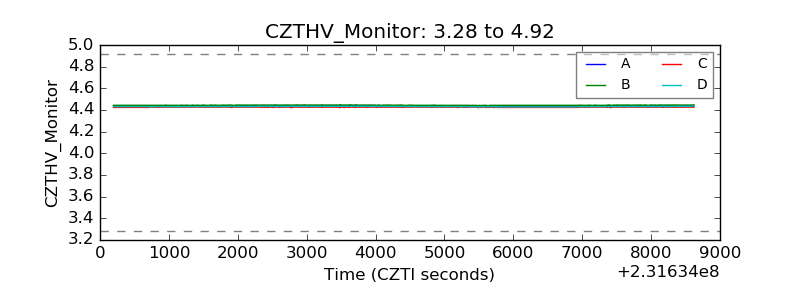 |
| D_VDD |  |
| Temperature 1 | 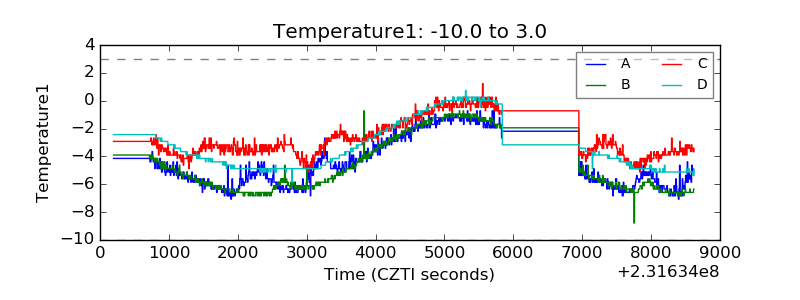 |
| Veto HV Monitor | 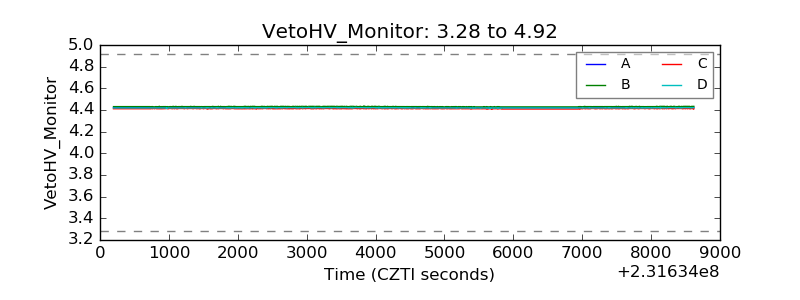 |
| Veto LLD | 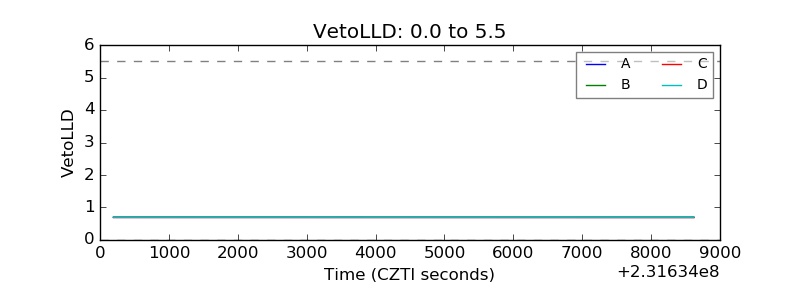 |
| Alpha Counter | 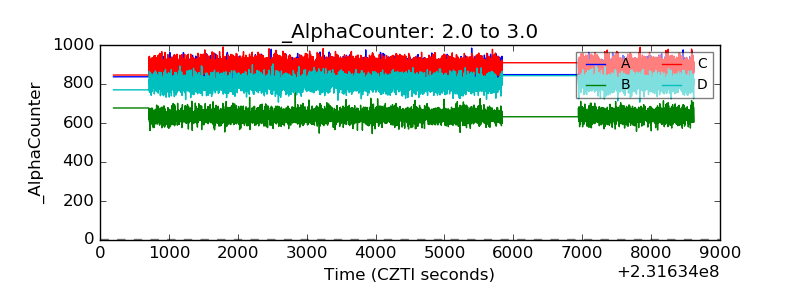 |
| _CPM_Rate | 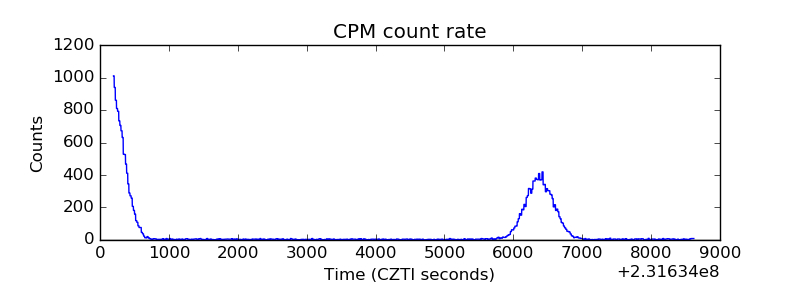 |
| CZT Counter | 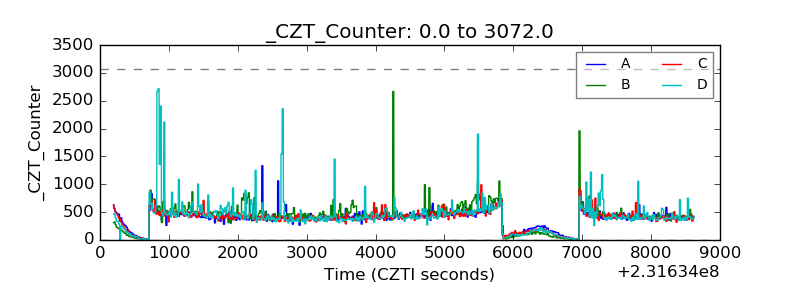 |
| +2.5 Volts monitor |  |
| +5 Volts monitor |  |
| _ROLL_ROT | 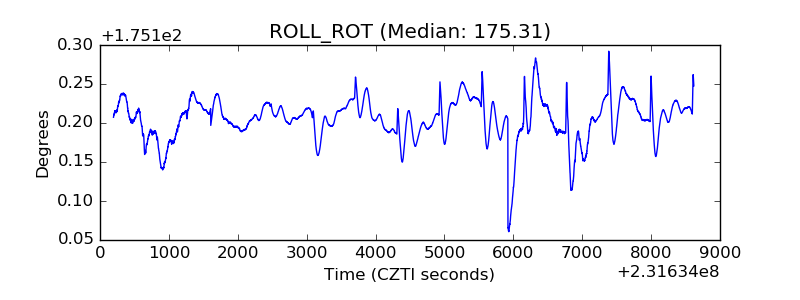 |
| _Roll_DEC | 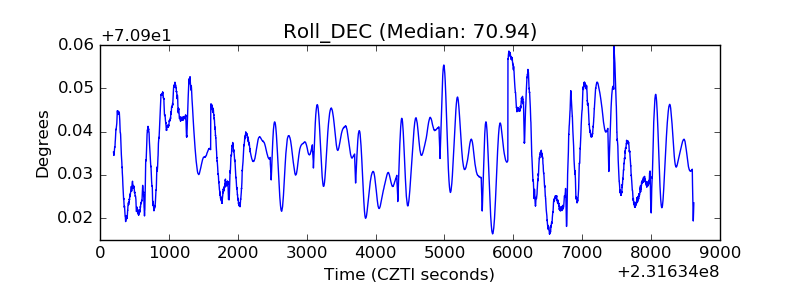 |
| _Roll_RA | 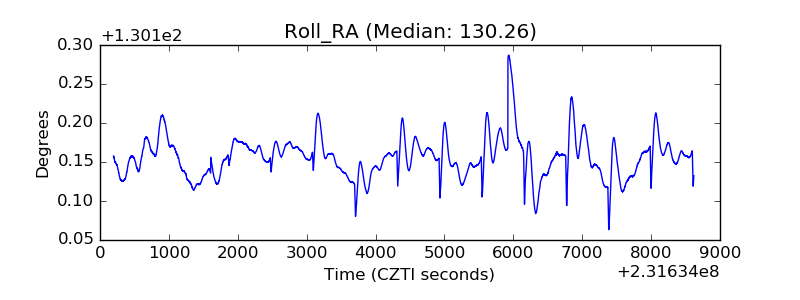 |
| Veto Counter | 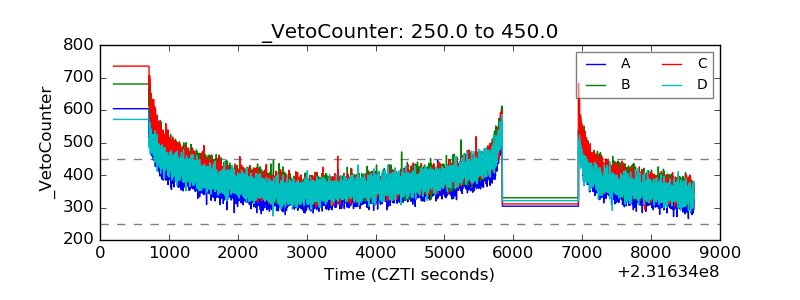 |