| Param | Original file | Final file |
|---|---|---|
| Filename | modeM0/AS1G07_024T01_9000001206_08658cztM0_level2.evt | modeM0/AS1G07_024T01_9000001206_08658cztM0_level2_quad_clean.evt |
| Size (bytes) | 465,491,520 | 128,309,760 |
| Size | 443.9 MB | 122.4 MB |
| Events in quadrant A | 3,132,555 | 841,054 |
| Events in quadrant B | 3,506,398 | 866,330 |
| Events in quadrant C | 3,099,517 | 863,162 |
| Events in quadrant D | 3,871,641 | 816,562 |
| Mode M0 | |||
|---|---|---|---|
| Quadrant | BADHDUFLAG | Total packets | Discarded packets |
| A | 0 | 14653 | 3 |
| B | 0 | 15493 | 2 |
| C | 0 | 14624 | 2 |
| D | 0 | 17006 | 2 |
| Mode M9 | |||
|---|---|---|---|
| Quadrant | BADHDUFLAG | Total packets | Discarded packets |
| A | 0 | 11 | 0 |
| B | 0 | 11 | 0 |
| C | 0 | 11 | 0 |
| D | 0 | 12 | 0 |
| Mode SS | |||
|---|---|---|---|
| Quadrant | BADHDUFLAG | Total packets | Discarded packets |
| A | 0 | 146 | 0 |
| B | 0 | 146 | 0 |
| C | 0 | 146 | 0 |
| D | 0 | 146 | 0 |
| Quadrant | Total seconds | Saturated seconds | Saturation percentage |
|---|---|---|---|
| A | 7167 | 44 | 0.613925% |
| B | 7167 | 92 | 1.283661% |
| C | 7167 | 26 | 0.362774% |
| D | 7167 | 98 | 1.367378% |
Noise dominated data is calculated using 1-second bins in cleaned event files. If a bin has >2000 counts, and if more than 50% of those come from <1% of pixels, then it is considered to be noise-dominated and hence unusable.
| Quadrant | # 1 sec bins | Bins with >0 counts | Bins with >2000 counts | High rate bins dominated by noise | Noise dominated (total time) | Noise dominated (detector-on time) | Marked lightcurve |
|---|---|---|---|---|---|---|---|
| A | 7872 | 7168 | 0 | 0 | 0.00% | 0.00% | 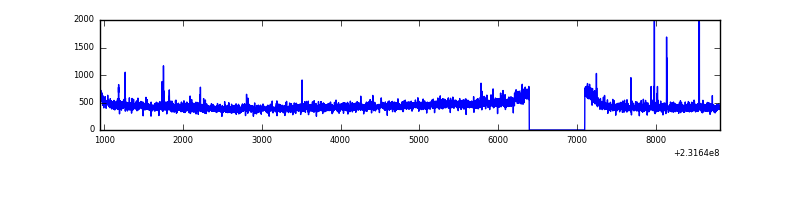 |
| B | 7872 | 7168 | 32 | 32 | 0.41% | 0.45% | 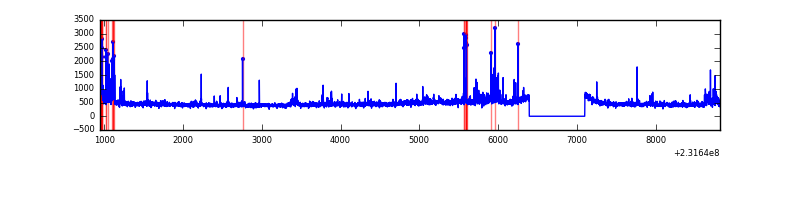 |
| C | 7872 | 7168 | 2 | 2 | 0.03% | 0.03% | 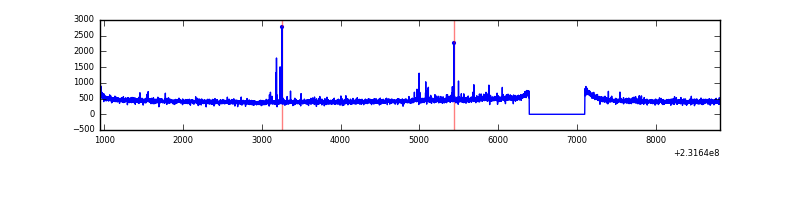 |
| D | 7872 | 7168 | 60 | 60 | 0.76% | 0.84% | 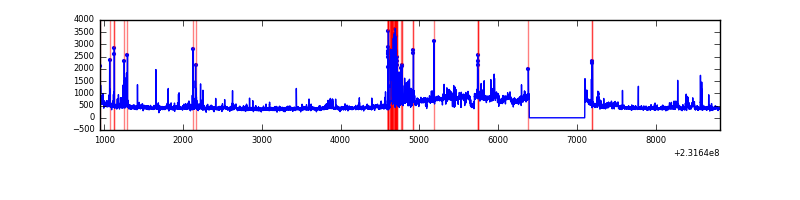 |
Top three noisy pixels from each quadrant. If the there are fewer than three noisy pixels in the level2.evt file, extra rows are filled as -1
| Pixel properties | Quadrant properties | ||||||
|---|---|---|---|---|---|---|---|
| Quadrant | DetID | PixID | Counts | Sigma | Mean | Median | Sigma |
| A | 8 | 5 | 62224 | 383.01 | 793 | 773 | 160.4 |
| A | 15 | 174 | 10094 | 58.1 | 793 | 773 | 160.4 |
| A | 0 | 226 | 7406 | 41.34 | 793 | 773 | 160.4 |
| B | 10 | 16 | 140831 | 920.93 | 807 | 787 | 152.1 |
| B | 0 | 230 | 69507 | 451.9 | 807 | 787 | 152.1 |
| B | 4 | 48 | 57390 | 372.22 | 807 | 787 | 152.1 |
| C | 1 | 16 | 40488 | 219.78 | 782 | 786 | 180.6 |
| C | 13 | 61 | 5964 | 28.66 | 782 | 786 | 180.6 |
| C | 12 | 4 | 3623 | 15.7 | 782 | 786 | 180.6 |
| D | 13 | 137 | 544576 | 2902.17 | 770 | 747 | 187.4 |
| D | 1 | 52 | 79359 | 419.52 | 770 | 747 | 187.4 |
| D | 10 | 253 | 77792 | 411.15 | 770 | 747 | 187.4 |
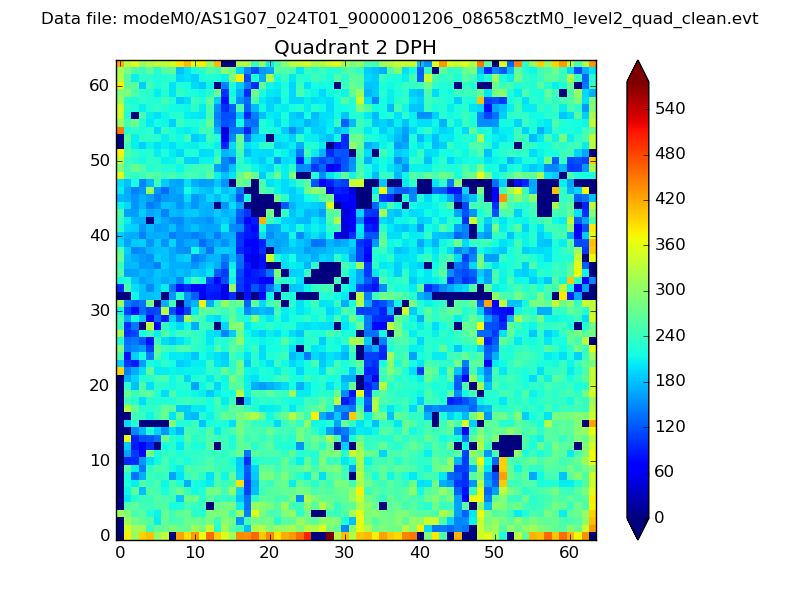
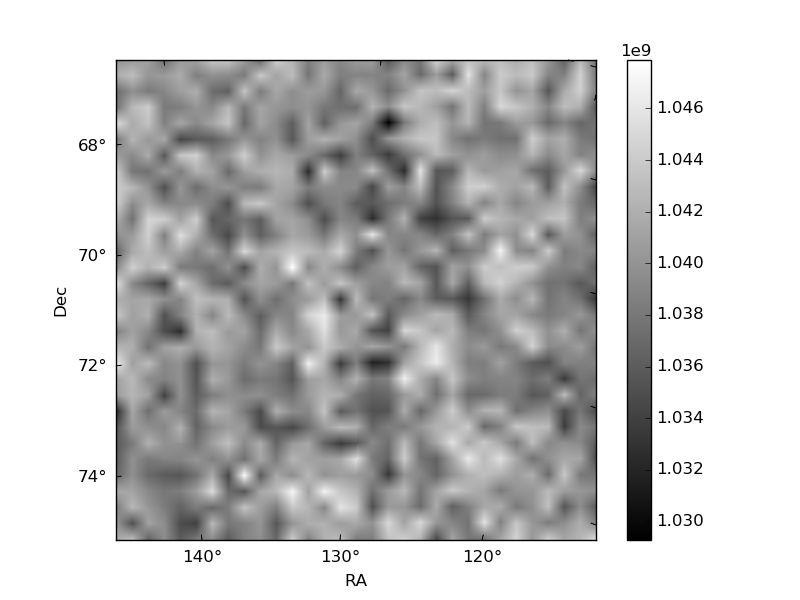
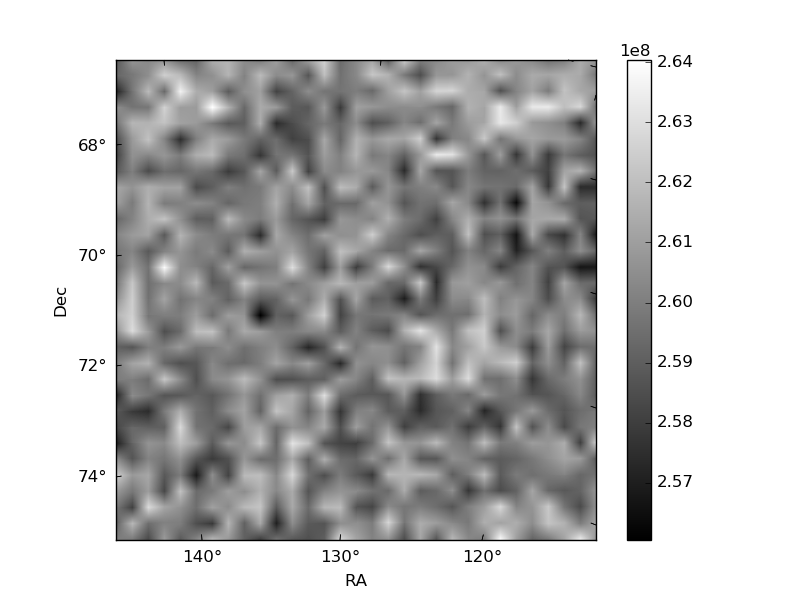
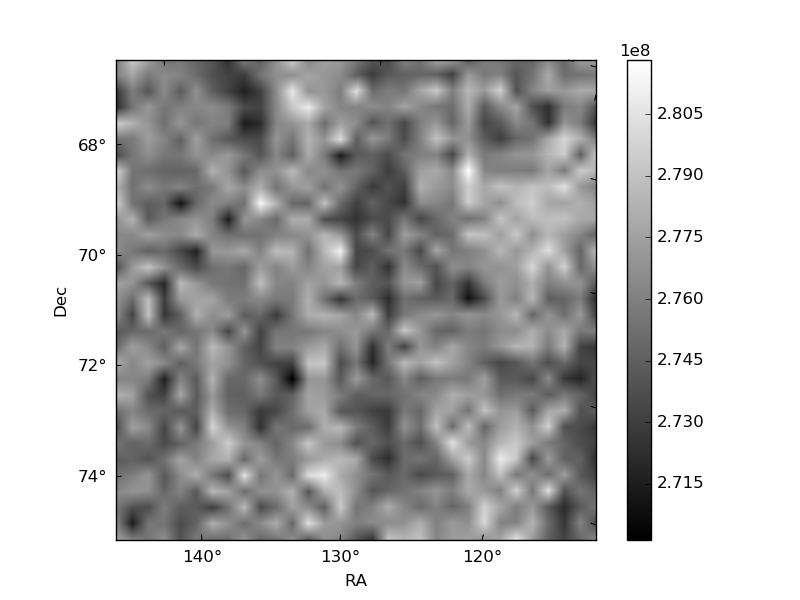
Histogram calculated using DETX and DETY for each event in the final _common_clean file
| Quadrant A | 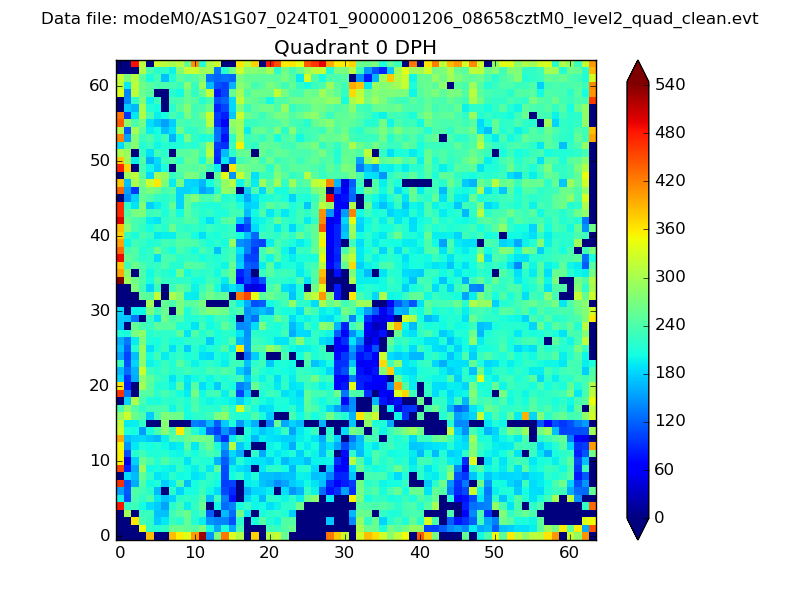 |
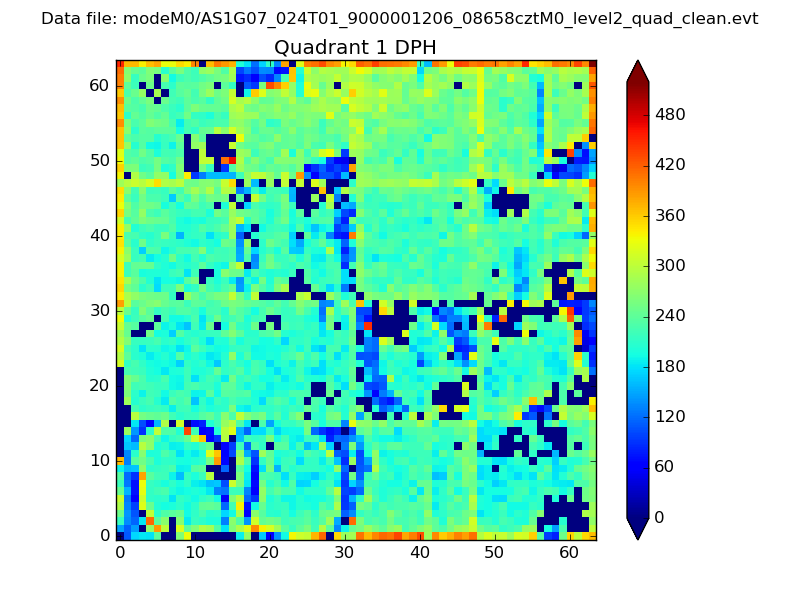 |
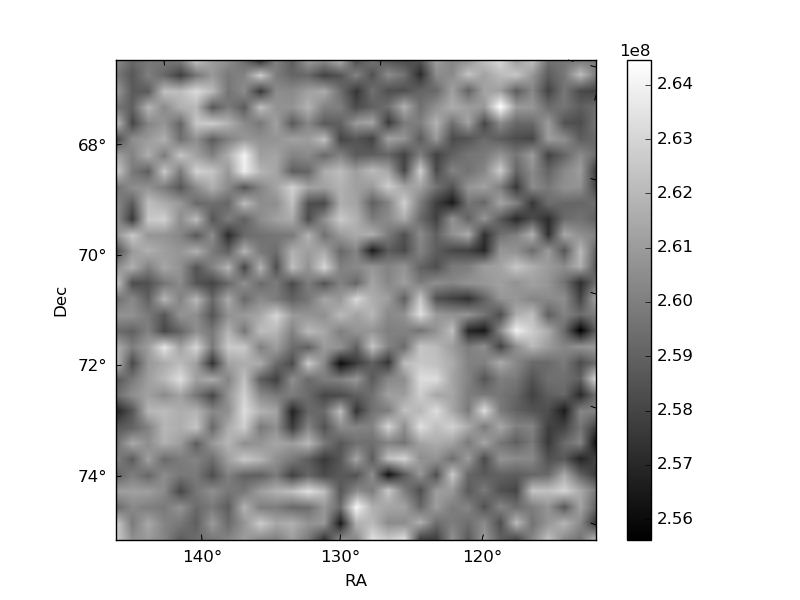
Quadrant B |
|---|---|---|---|
| Quadrant D | 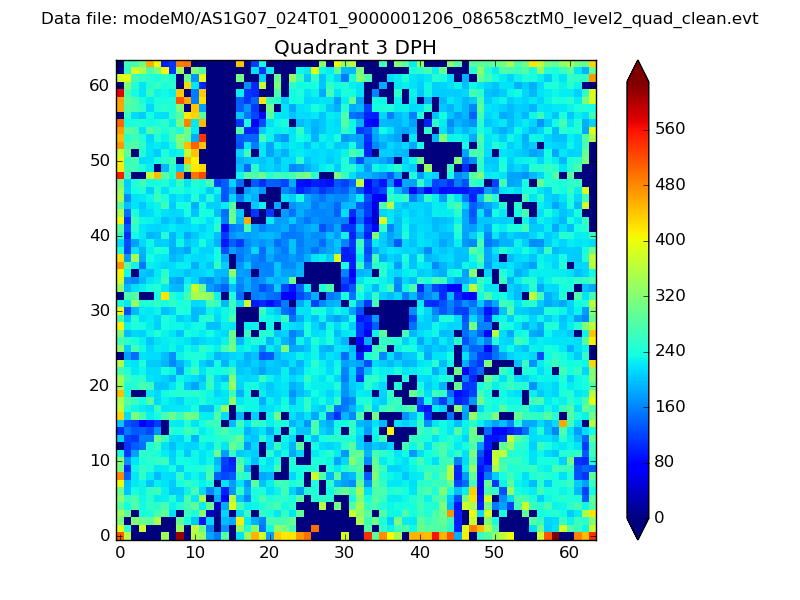 |
 |
Quadrant C |
| Plot type | Count rate plots | Images |
|---|---|---|
| Comparison with Poisson distribution Blue bars denote a histogram of data divided into 1 sec bins. Red curve is a Poisson curve with rate = median count rate of data. |
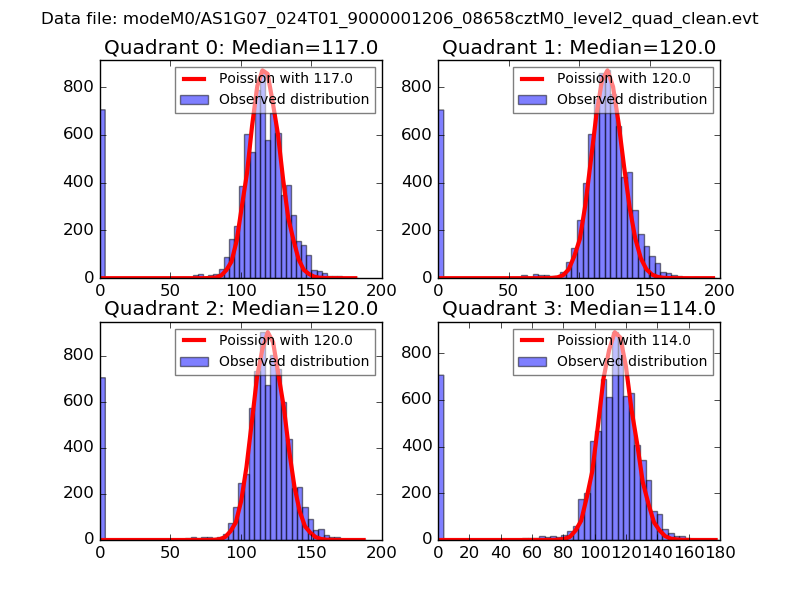 |
 |
| Quadrant-wise count rates Data is divided into 100 sec bins |
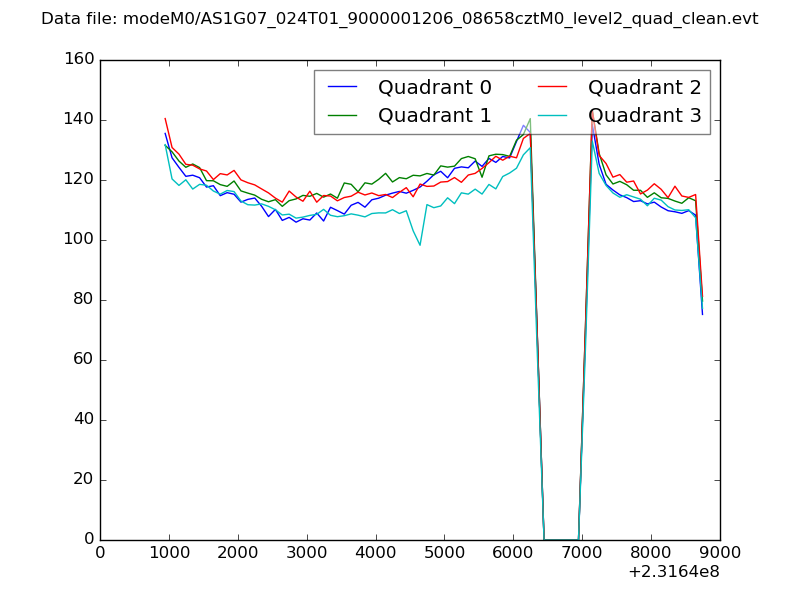 |
|
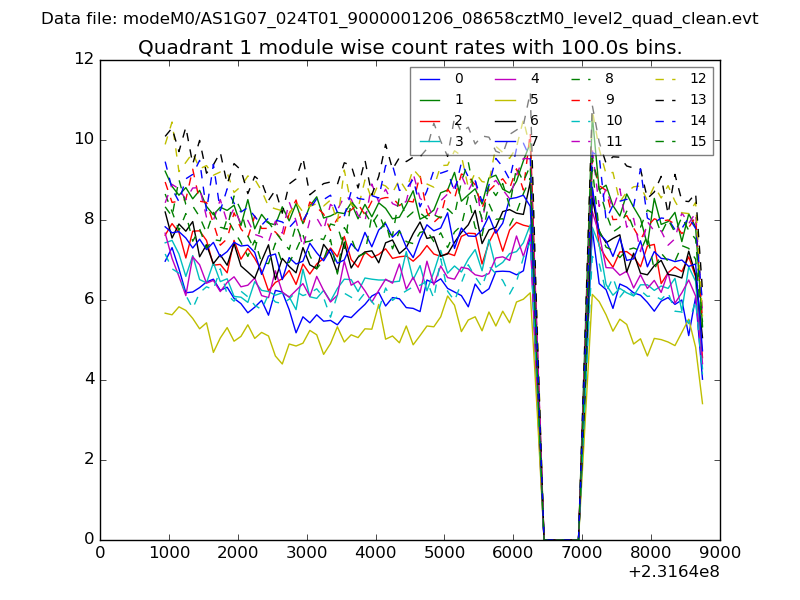
| Module-wise count rates for Quadrant A Data is divided into 100 sec bins |
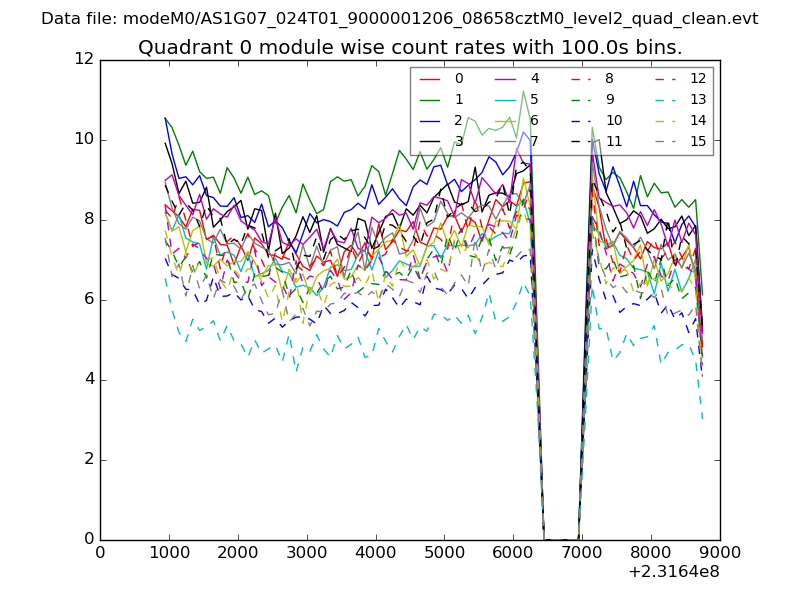 |
 |
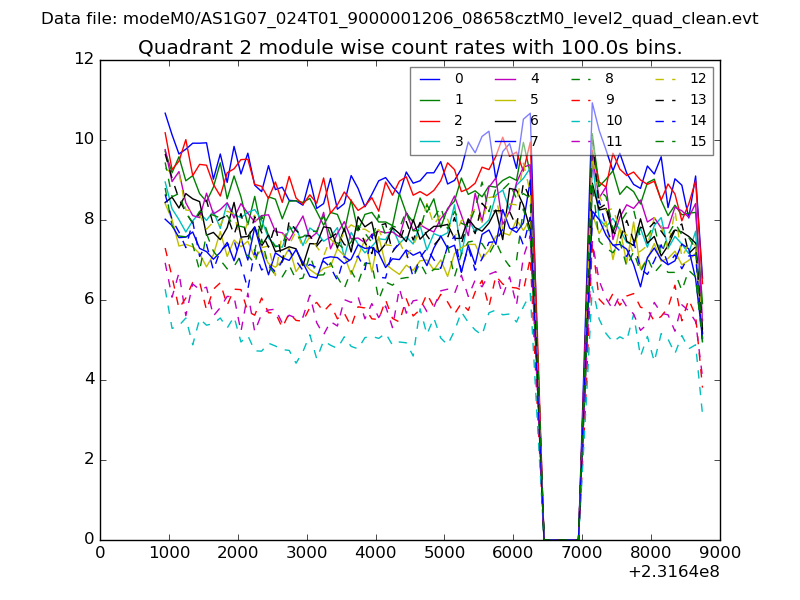
| Module-wise count rates for Quadrant B Data is divided into 100 sec bins |
 |
 |
| Module-wise count rates for Quadrant C Data is divided into 100 sec bins |
 |
 |
| Module-wise count rates for Quadrant D Data is divided into 100 sec bins |
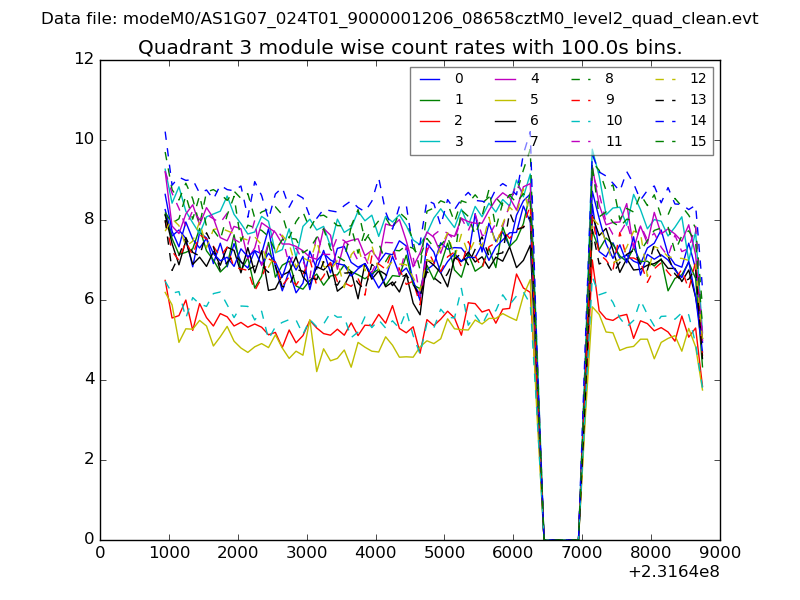 |
 |
| Parameter | Plot |
|---|---|
| CZT HV Monitor | 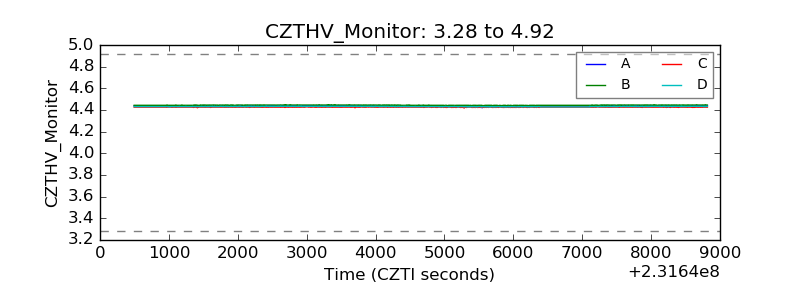 |
| D_VDD | 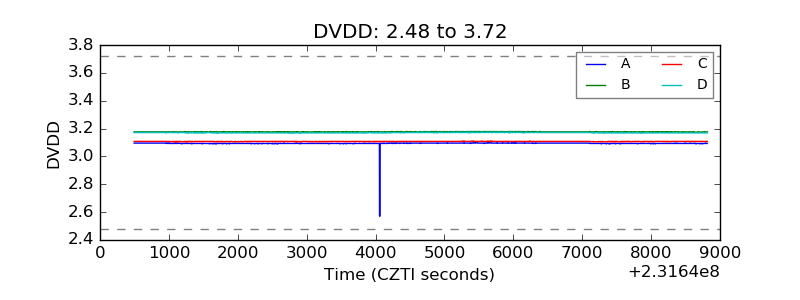 |
| Temperature 1 | 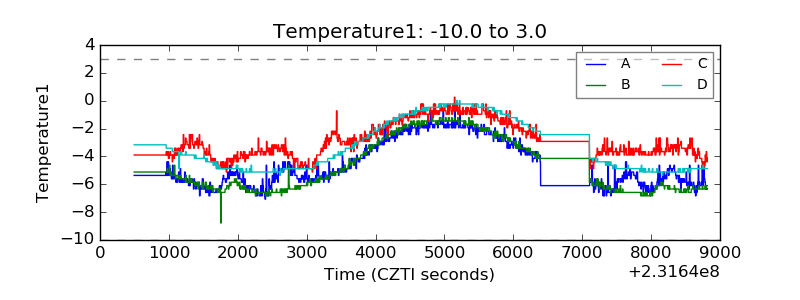 |
| Veto HV Monitor | 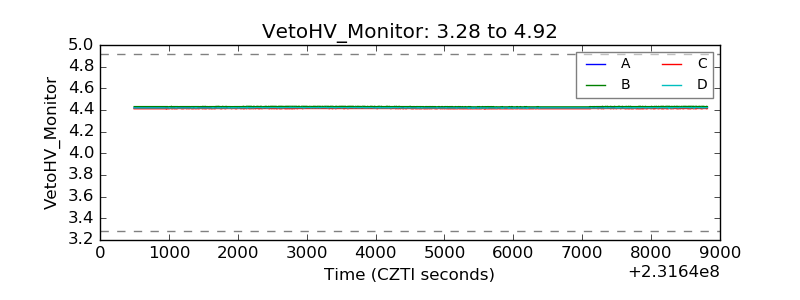 |
| Veto LLD | 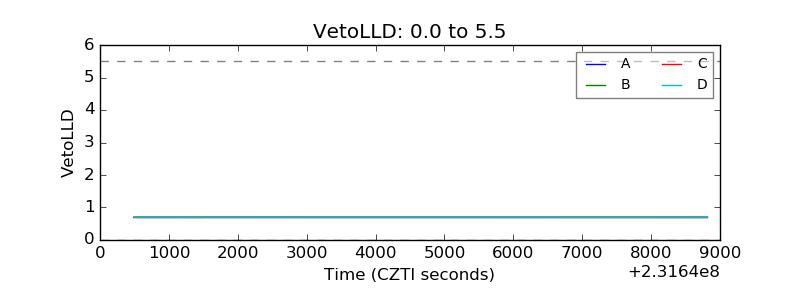 |
| Alpha Counter | 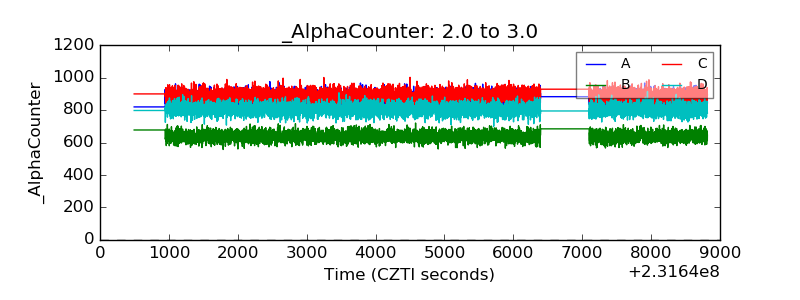 |
| _CPM_Rate | 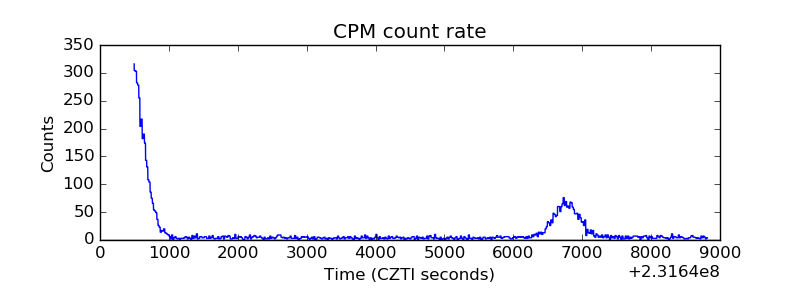 |
| CZT Counter | 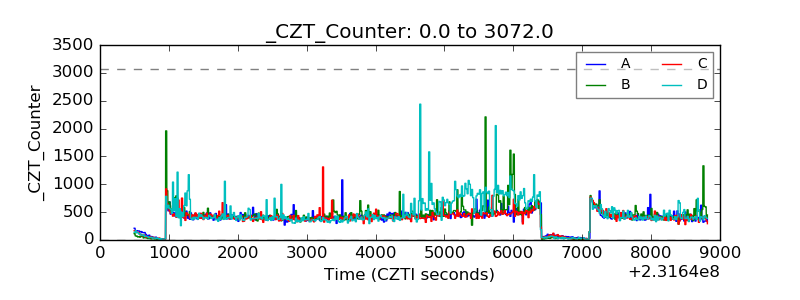 |
| +2.5 Volts monitor |  |
| +5 Volts monitor |  |
| _ROLL_ROT | 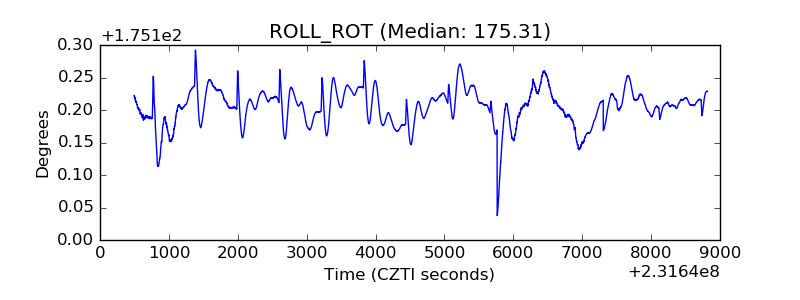 |
| _Roll_DEC | 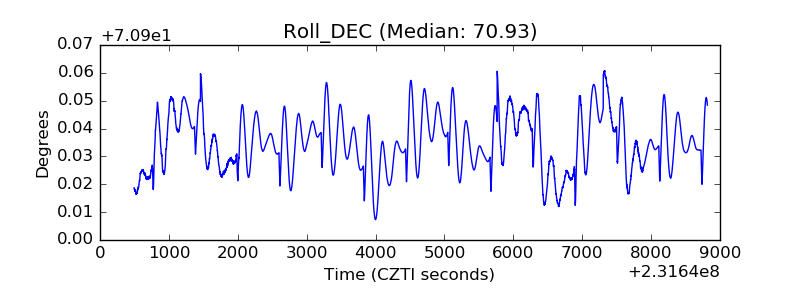 |
| _Roll_RA | 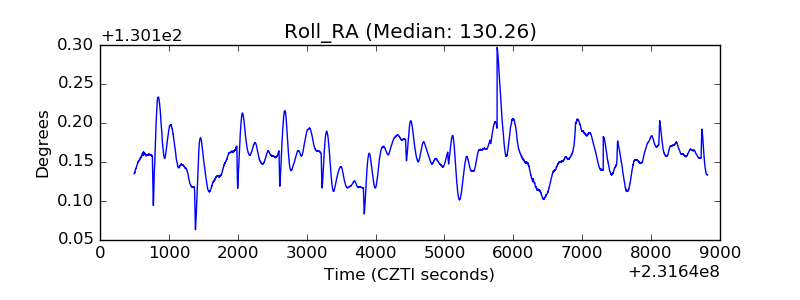 |
| Veto Counter | 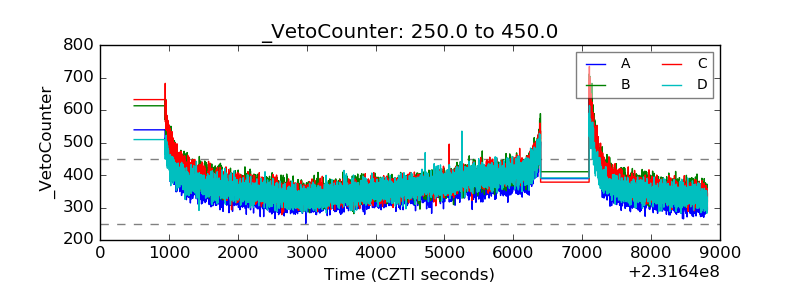 |