| Param | Original file | Final file |
|---|---|---|
| Filename | modeM0/AS1G07_024T01_9000001206_08661cztM0_level2.evt | modeM0/AS1G07_024T01_9000001206_08661cztM0_level2_quad_clean.evt |
| Size (bytes) | 499,118,400 | 126,849,600 |
| Size | 476.0 MB | 121.0 MB |
| Events in quadrant A | 3,229,005 | 830,460 |
| Events in quadrant B | 3,840,609 | 855,707 |
| Events in quadrant C | 3,203,733 | 846,745 |
| Events in quadrant D | 4,347,522 | 801,995 |
| Mode M0 | |||
|---|---|---|---|
| Quadrant | BADHDUFLAG | Total packets | Discarded packets |
| A | 0 | 15186 | 299 |
| B | 0 | 16637 | 329 |
| C | 0 | 15221 | 289 |
| D | 0 | 18022 | 316 |
| Mode M9 | |||
|---|---|---|---|
| Quadrant | BADHDUFLAG | Total packets | Discarded packets |
| A | 0 | 3 | 0 |
| B | 0 | 3 | 0 |
| C | 0 | 3 | 0 |
| D | 0 | 3 | 0 |
| Mode SS | |||
|---|---|---|---|
| Quadrant | BADHDUFLAG | Total packets | Discarded packets |
| A | 0 | 150 | 2 |
| B | 0 | 150 | 2 |
| C | 0 | 150 | 2 |
| D | 0 | 150 | 0 |
| Quadrant | Total seconds | Saturated seconds | Saturation percentage |
|---|---|---|---|
| A | 7271 | 113 | 1.554119% |
| B | 7280 | 199 | 2.733516% |
| C | 7276 | 68 | 0.934579% |
| D | 7283 | 133 | 1.826171% |
Noise dominated data is calculated using 1-second bins in cleaned event files. If a bin has >2000 counts, and if more than 50% of those come from <1% of pixels, then it is considered to be noise-dominated and hence unusable.
| Quadrant | # 1 sec bins | Bins with >0 counts | Bins with >2000 counts | High rate bins dominated by noise | Noise dominated (total time) | Noise dominated (detector-on time) | Marked lightcurve |
|---|---|---|---|---|---|---|---|
| A | 7720 | 7364 | 3 | 3 | 0.04% | 0.04% | 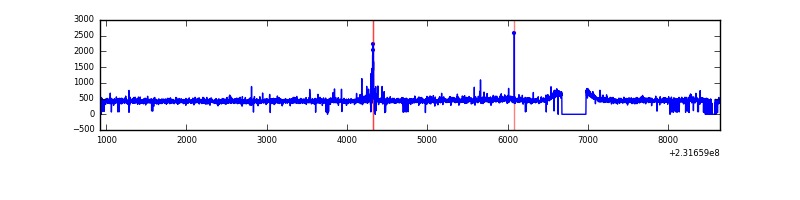 |
| B | 7720 | 7377 | 60 | 60 | 0.78% | 0.81% | 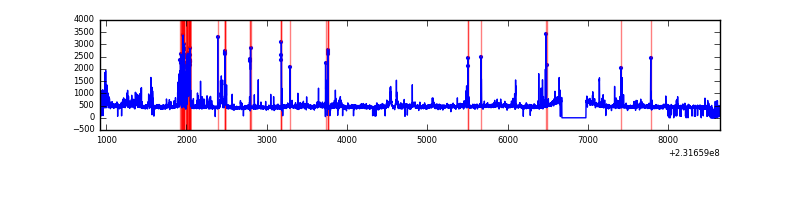 |
| C | 7720 | 7367 | 13 | 13 | 0.17% | 0.18% | 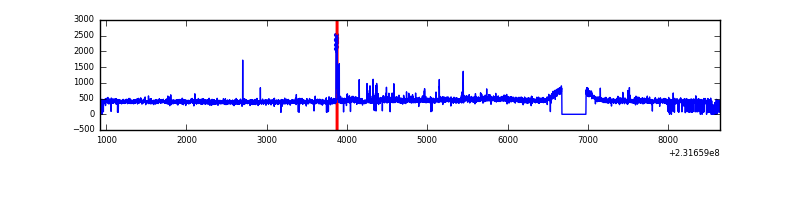 |
| D | 7720 | 7369 | 14 | 14 | 0.18% | 0.19% | 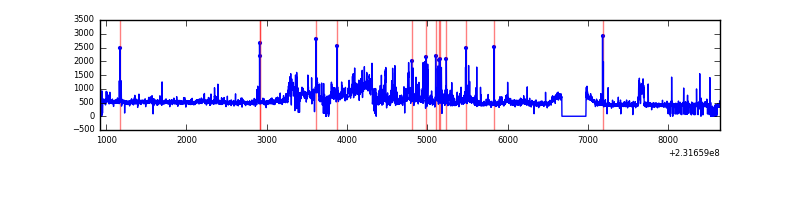 |
Top three noisy pixels from each quadrant. If the there are fewer than three noisy pixels in the level2.evt file, extra rows are filled as -1
| Pixel properties | Quadrant properties | ||||||
|---|---|---|---|---|---|---|---|
| Quadrant | DetID | PixID | Counts | Sigma | Mean | Median | Sigma |
| A | 8 | 5 | 75013 | 443.01 | 814 | 794 | 167.5 |
| A | 15 | 174 | 11064 | 61.3 | 814 | 794 | 167.5 |
| A | 0 | 226 | 7586 | 40.54 | 814 | 794 | 167.5 |
| B | 4 | 48 | 375686 | 2394.17 | 823 | 803 | 156.6 |
| B | 10 | 16 | 116412 | 738.33 | 823 | 803 | 156.6 |
| B | 0 | 168 | 35595 | 222.2 | 823 | 803 | 156.6 |
| C | 4 | 254 | 82108 | 439.61 | 794 | 797 | 185.0 |
| C | 1 | 16 | 20114 | 104.44 | 794 | 797 | 185.0 |
| C | 13 | 61 | 6000 | 28.13 | 794 | 797 | 185.0 |
| D | 13 | 137 | 1096413 | 5695.32 | 790 | 765 | 192.4 |
| D | 7 | 71 | 71569 | 368.05 | 790 | 765 | 192.4 |
| D | 2 | 152 | 44673 | 228.24 | 790 | 765 | 192.4 |
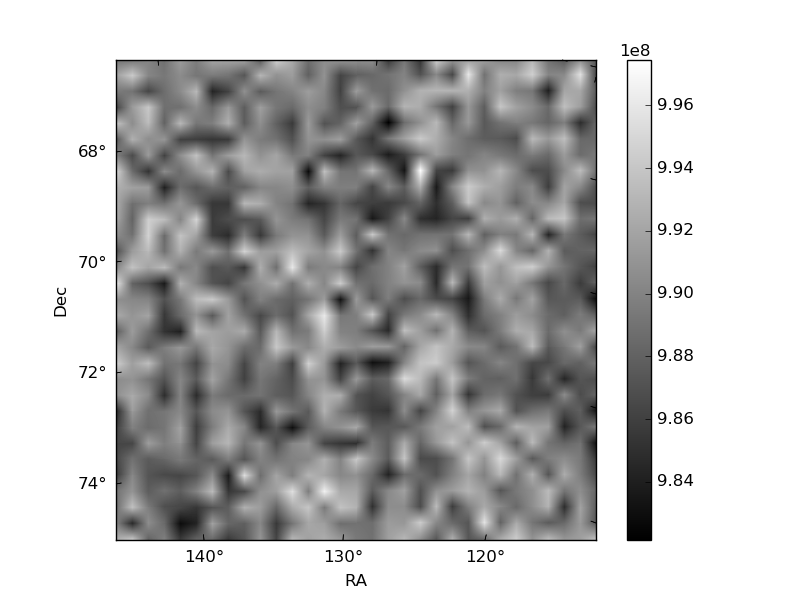
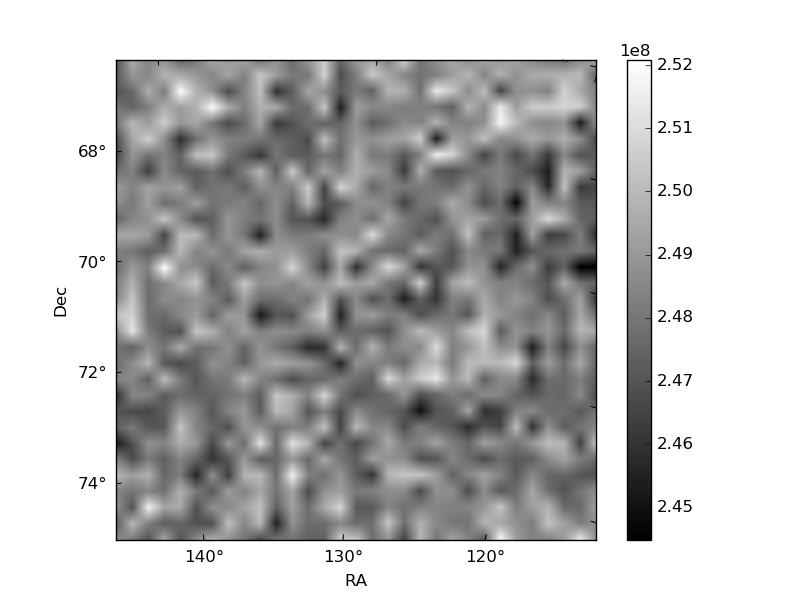
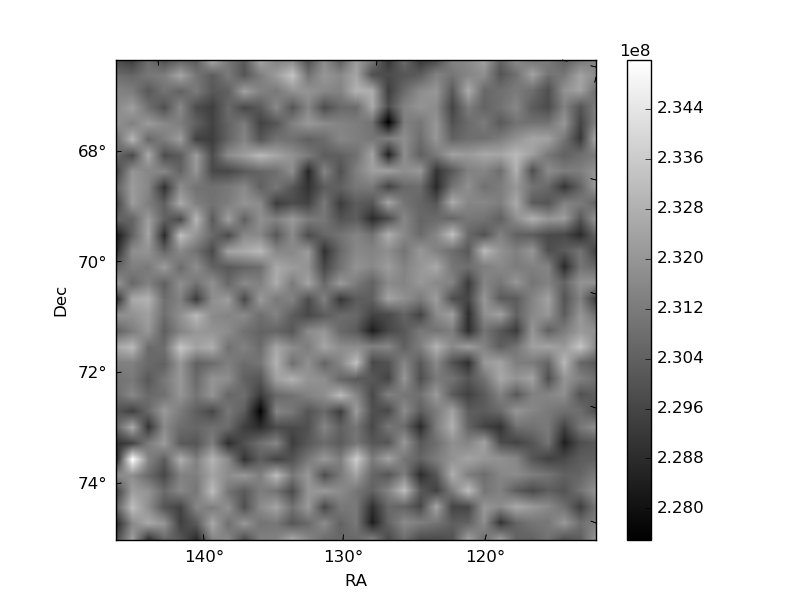
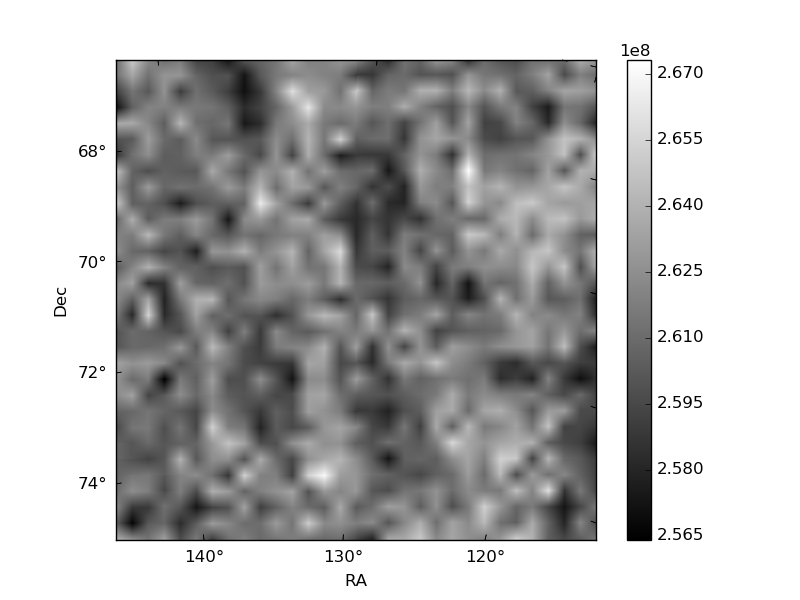
Histogram calculated using DETX and DETY for each event in the final _common_clean file
| Quadrant A | 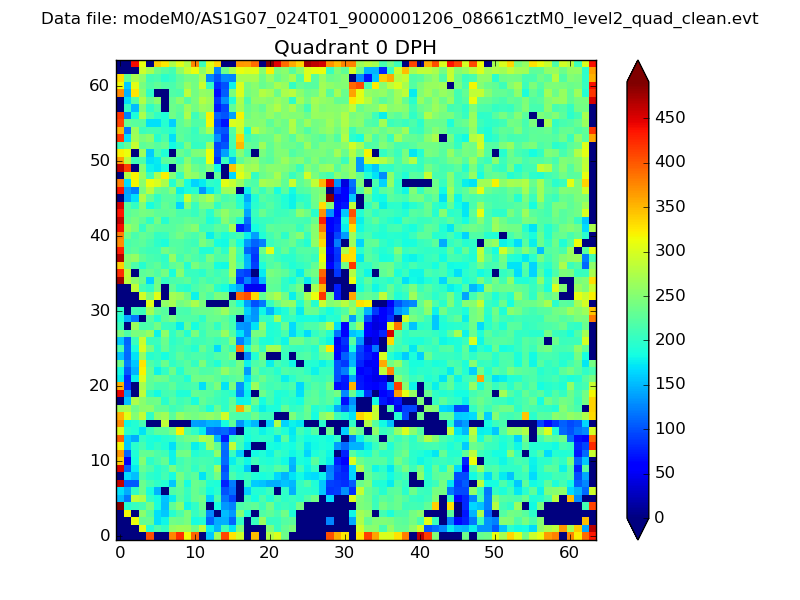 |
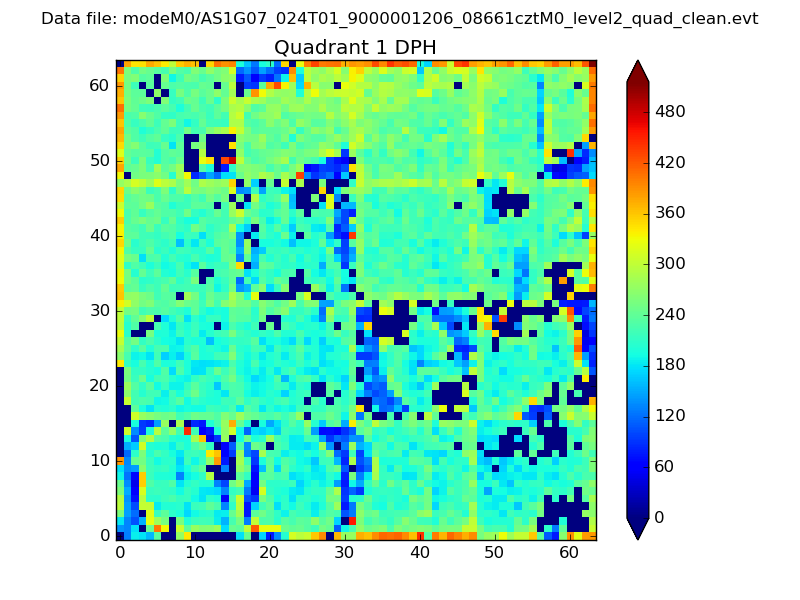 |
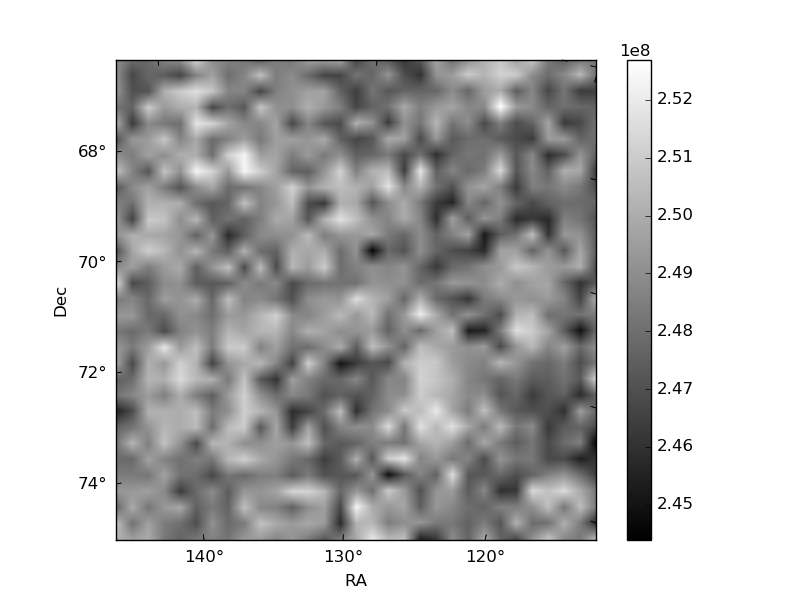
Quadrant B |
|---|---|---|---|
| Quadrant D | 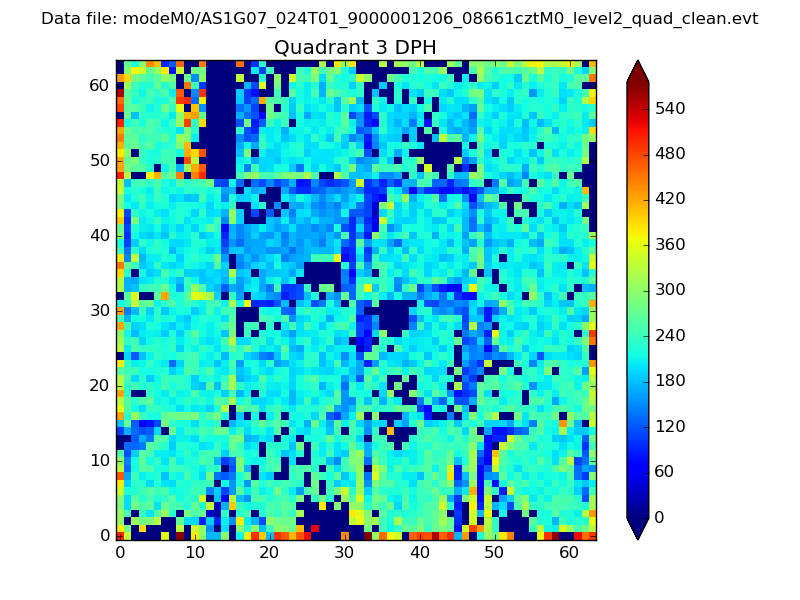 |
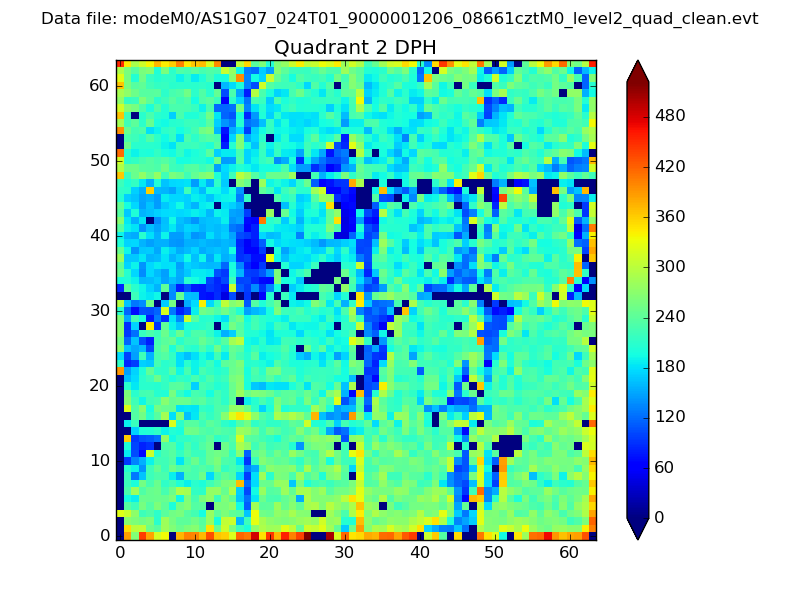 |
Quadrant C |
| Plot type | Count rate plots | Images |
|---|---|---|
| Comparison with Poisson distribution Blue bars denote a histogram of data divided into 1 sec bins. Red curve is a Poisson curve with rate = median count rate of data. |
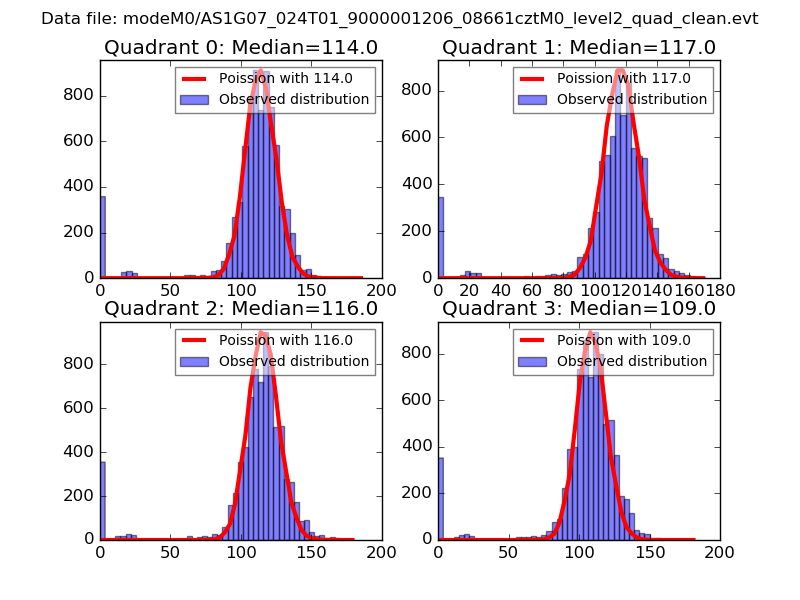 |
 |
| Quadrant-wise count rates Data is divided into 100 sec bins |
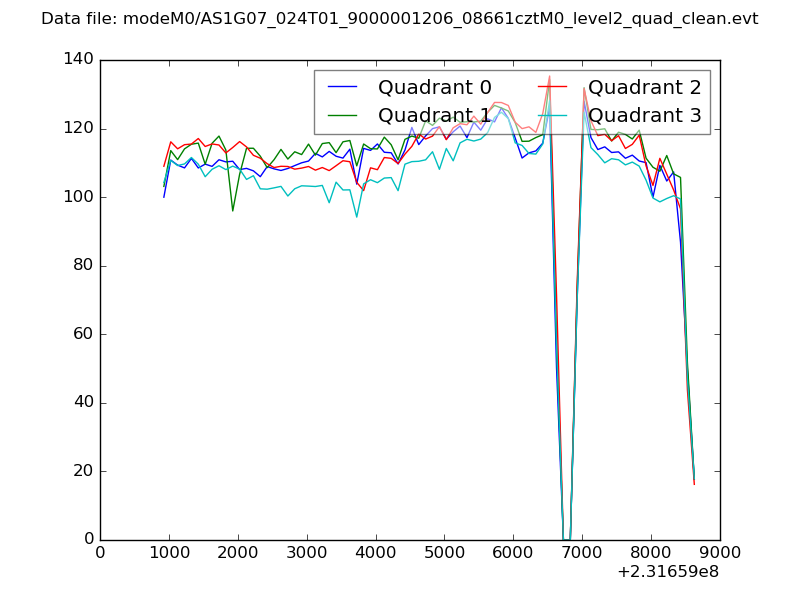 |
|
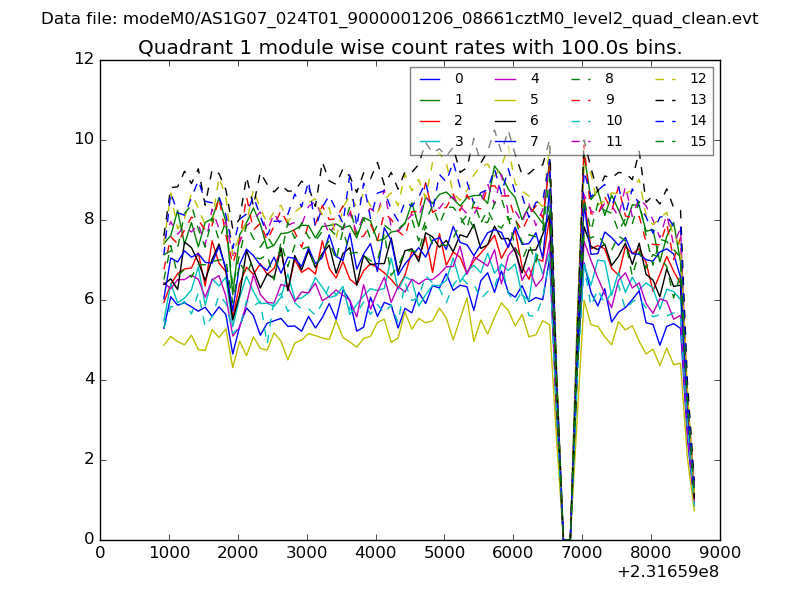
| Module-wise count rates for Quadrant A Data is divided into 100 sec bins |
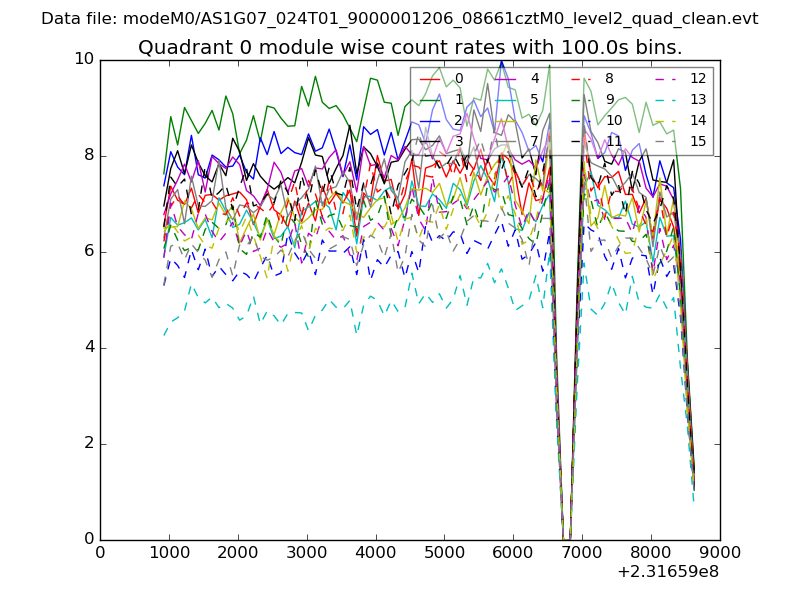 |
 |
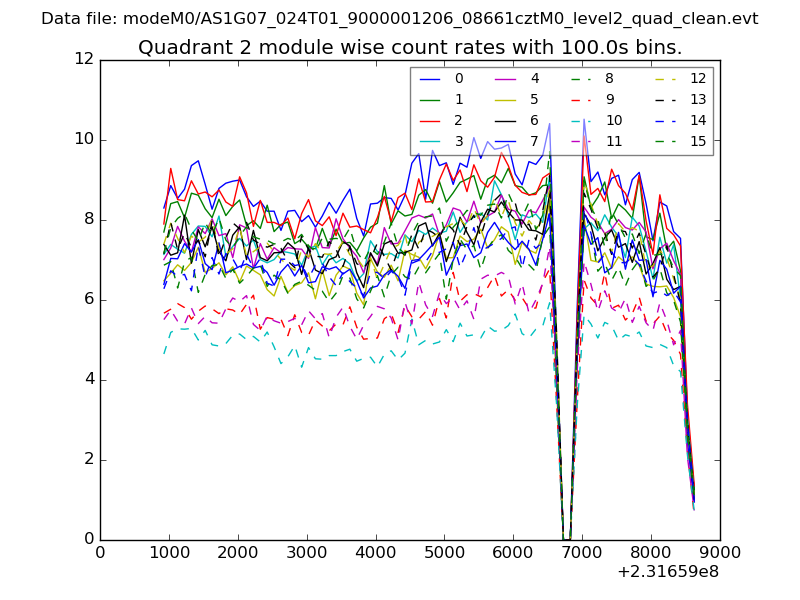
| Module-wise count rates for Quadrant B Data is divided into 100 sec bins |
 |
 |
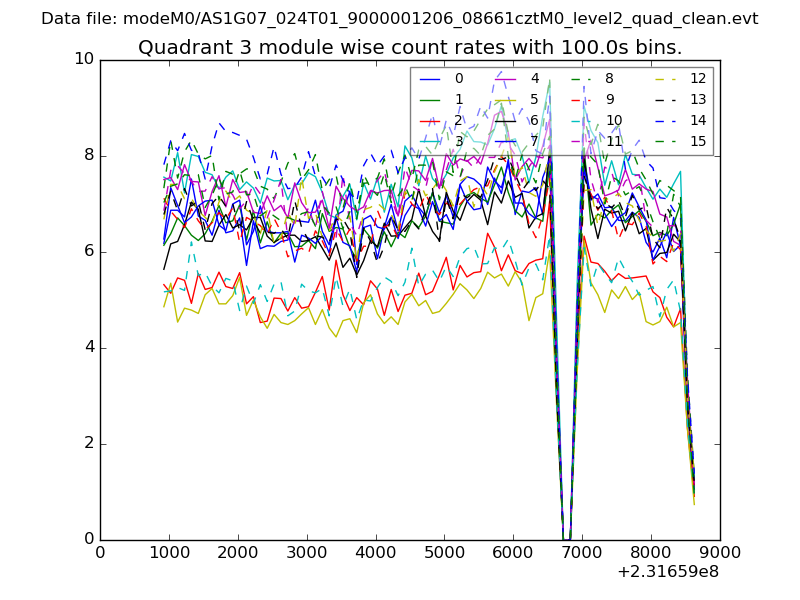
| Module-wise count rates for Quadrant C Data is divided into 100 sec bins |
 |
 |
| Module-wise count rates for Quadrant D Data is divided into 100 sec bins |
 |
 |
| Parameter | Plot |
|---|---|
| CZT HV Monitor | 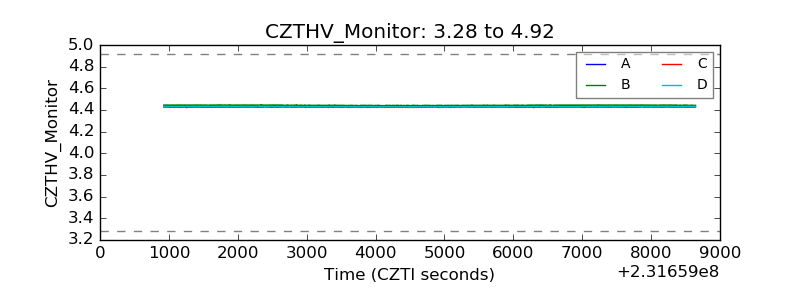 |
| D_VDD | 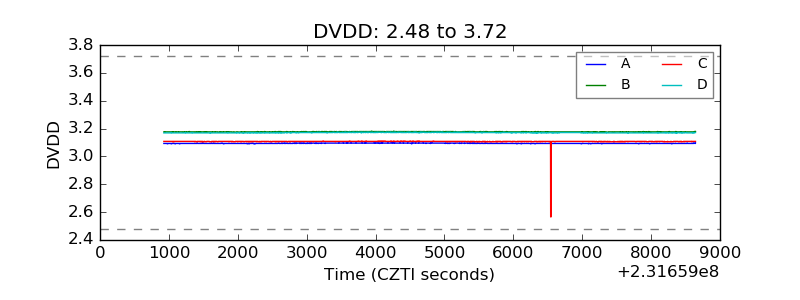 |
| Temperature 1 | 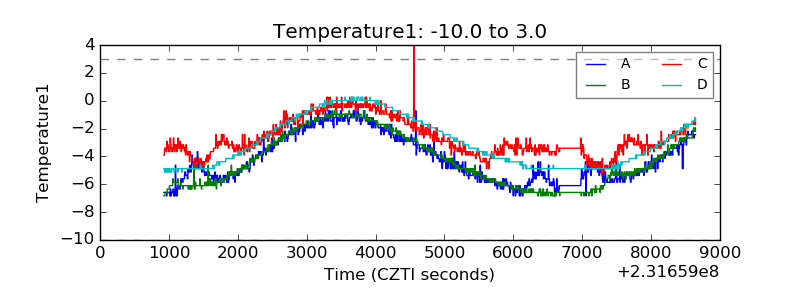 |
| Veto HV Monitor | 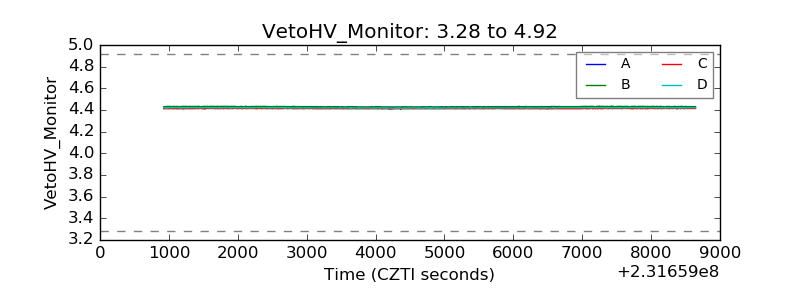 |
| Veto LLD | 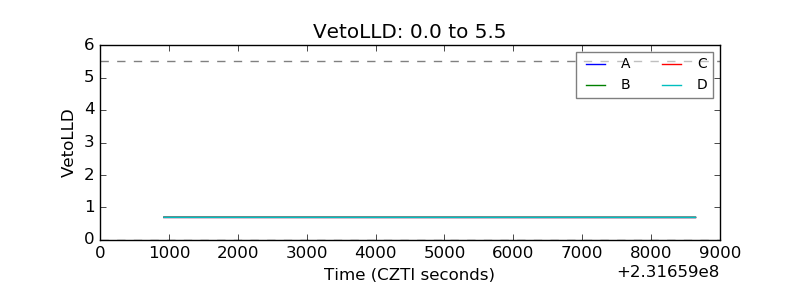 |
| Alpha Counter | 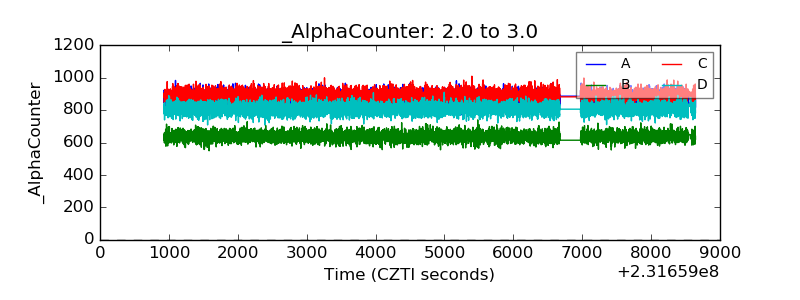 |
| _CPM_Rate | 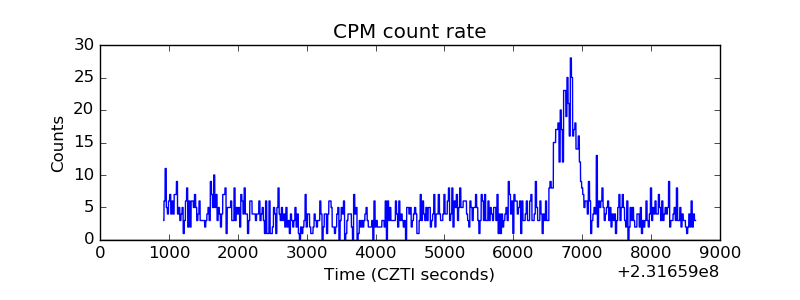 |
| CZT Counter | 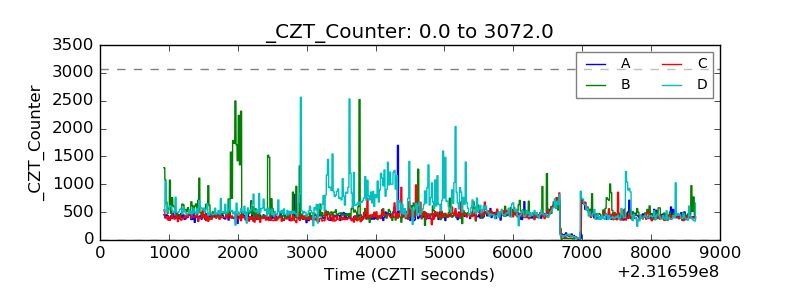 |
| +2.5 Volts monitor |  |
| +5 Volts monitor |  |
| _ROLL_ROT |  |
| _Roll_DEC |  |
| _Roll_RA | 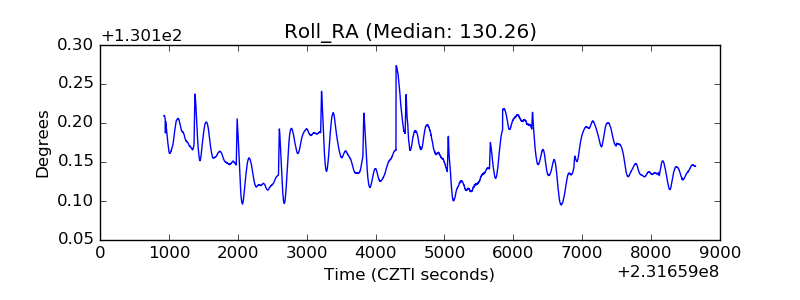 |
| Veto Counter | 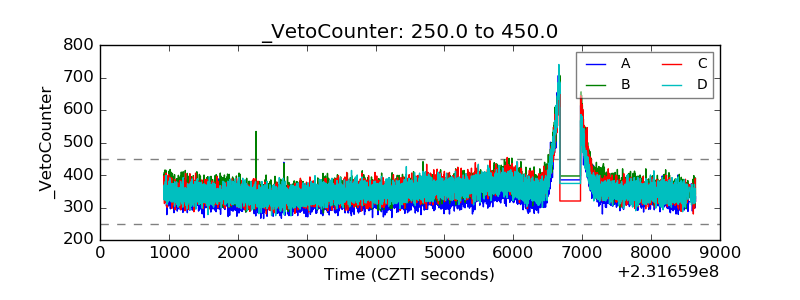 |