| Param | Original file | Final file |
|---|---|---|
| Filename | modeM0/AS1G07_024T01_9000001206_08664cztM0_level2.evt | modeM0/AS1G07_024T01_9000001206_08664cztM0_level2_quad_clean.evt |
| Size (bytes) | 1,221,975,360 | 311,497,920 |
| Size | 1.1 GB | 297.1 MB |
| Events in quadrant A | 8,894,850 | 2,058,051 |
| Events in quadrant B | 9,304,307 | 2,109,383 |
| Events in quadrant C | 8,180,432 | 2,068,163 |
| Events in quadrant D | 9,426,166 | 1,975,004 |
| Mode M0 | |||
|---|---|---|---|
| Quadrant | BADHDUFLAG | Total packets | Discarded packets |
| A | 0 | 38857 | 36 |
| B | 0 | 39487 | 35 |
| C | 0 | 37058 | 14 |
| D | 0 | 40815 | 29 |
| Mode M9 | |||
|---|---|---|---|
| Quadrant | BADHDUFLAG | Total packets | Discarded packets |
| A | 0 | 22 | 0 |
| B | 0 | 22 | 0 |
| C | 0 | 22 | 0 |
| D | 0 | 22 | 0 |
| Mode SS | |||
|---|---|---|---|
| Quadrant | BADHDUFLAG | Total packets | Discarded packets |
| A | 0 | 360 | 0 |
| B | 0 | 360 | 0 |
| C | 0 | 360 | 0 |
| D | 0 | 360 | 2 |
| Quadrant | Total seconds | Saturated seconds | Saturation percentage |
|---|---|---|---|
| A | 17775 | 218 | 1.226442% |
| B | 17773 | 280 | 1.575423% |
| C | 17784 | 122 | 0.686010% |
| D | 17778 | 425 | 2.390595% |
Noise dominated data is calculated using 1-second bins in cleaned event files. If a bin has >2000 counts, and if more than 50% of those come from <1% of pixels, then it is considered to be noise-dominated and hence unusable.
| Quadrant | # 1 sec bins | Bins with >0 counts | Bins with >2000 counts | High rate bins dominated by noise | Noise dominated (total time) | Noise dominated (detector-on time) | Marked lightcurve |
|---|---|---|---|---|---|---|---|
| A | 19899 | 17790 | 34 | 34 | 0.17% | 0.19% | 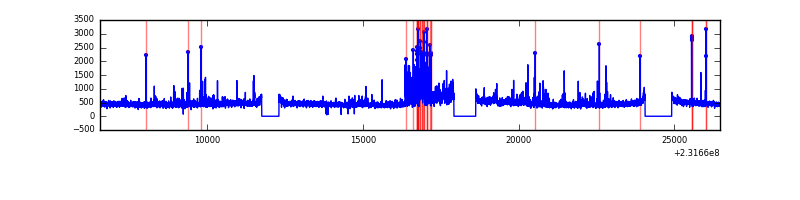 |
| B | 19899 | 17788 | 119 | 119 | 0.60% | 0.67% | 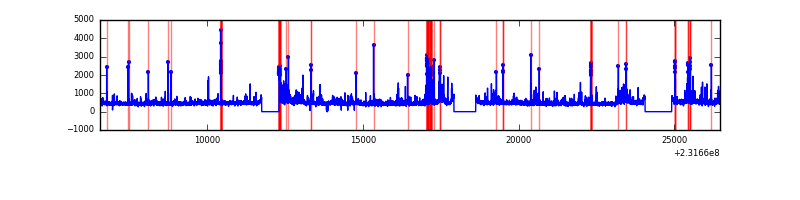 |
| C | 19899 | 17789 | 26 | 26 | 0.13% | 0.15% | 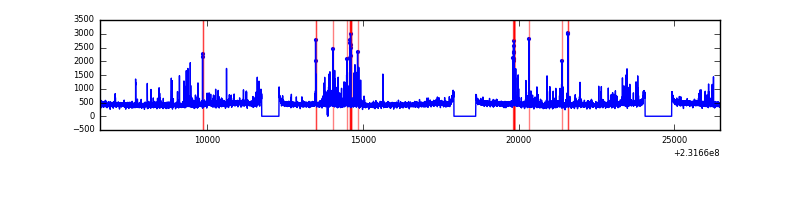 |
| D | 19899 | 17790 | 296 | 296 | 1.49% | 1.66% | 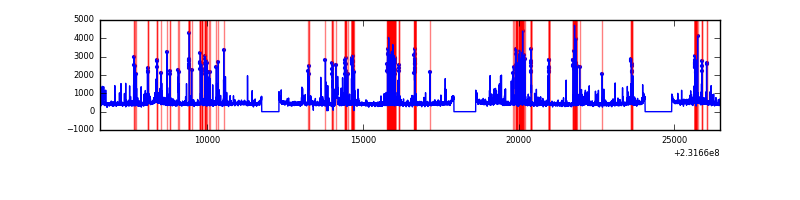 |
Top three noisy pixels from each quadrant. If the there are fewer than three noisy pixels in the level2.evt file, extra rows are filled as -1
| Pixel properties | Quadrant properties | ||||||
|---|---|---|---|---|---|---|---|
| Quadrant | DetID | PixID | Counts | Sigma | Mean | Median | Sigma |
| A | 8 | 5 | 1051836 | 2594.03 | 2001 | 1956 | 404.7 |
| A | 15 | 174 | 59830 | 142.99 | 2001 | 1956 | 404.7 |
| A | 0 | 254 | 22611 | 51.03 | 2001 | 1956 | 404.7 |
| B | 10 | 16 | 463870 | 1214.24 | 2020 | 1970 | 380.4 |
| B | 4 | 48 | 335652 | 877.18 | 2020 | 1970 | 380.4 |
| B | 0 | 231 | 118790 | 307.09 | 2020 | 1970 | 380.4 |
| C | 4 | 254 | 455795 | 1012.12 | 1953 | 1962 | 448.4 |
| C | 1 | 16 | 70770 | 153.45 | 1953 | 1962 | 448.4 |
| C | 13 | 61 | 14727 | 28.47 | 1953 | 1962 | 448.4 |
| D | 10 | 253 | 705334 | 1493.53 | 1938 | 1874 | 471.0 |
| D | 2 | 152 | 319534 | 674.43 | 1938 | 1874 | 471.0 |
| D | 7 | 71 | 290826 | 613.48 | 1938 | 1874 | 471.0 |
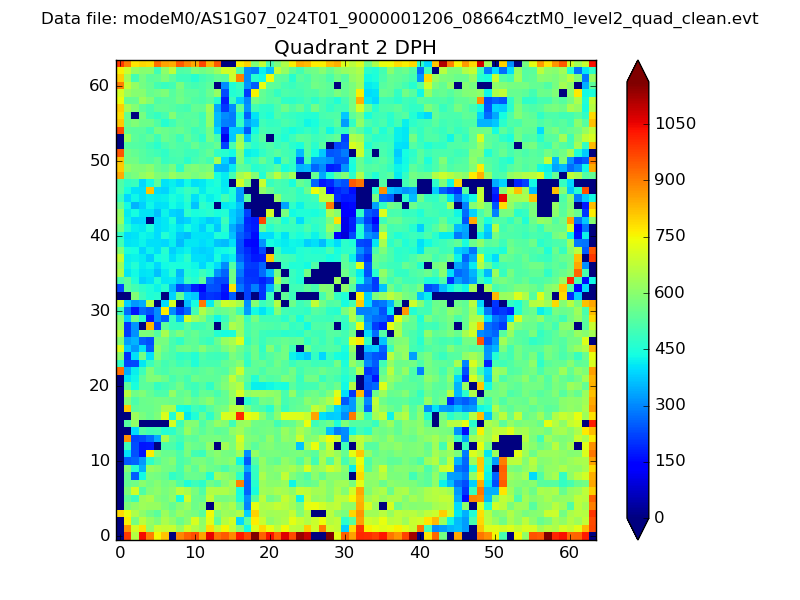
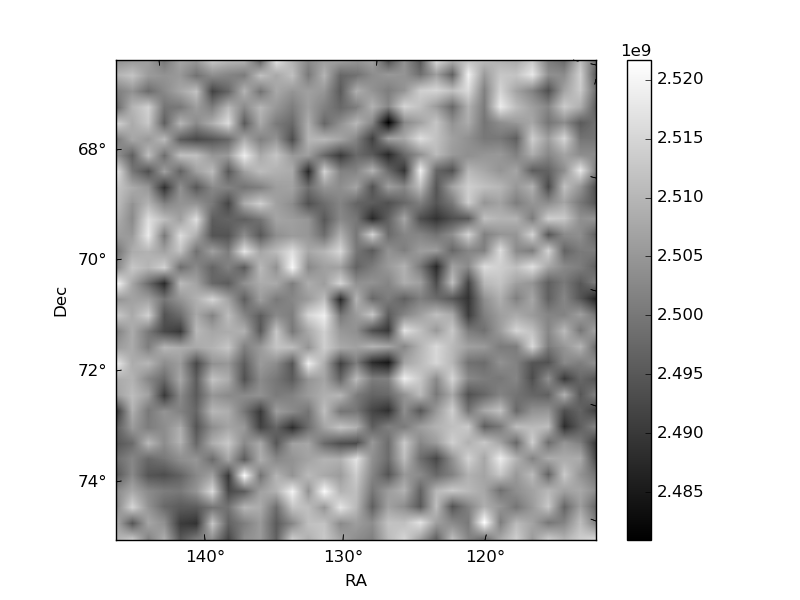
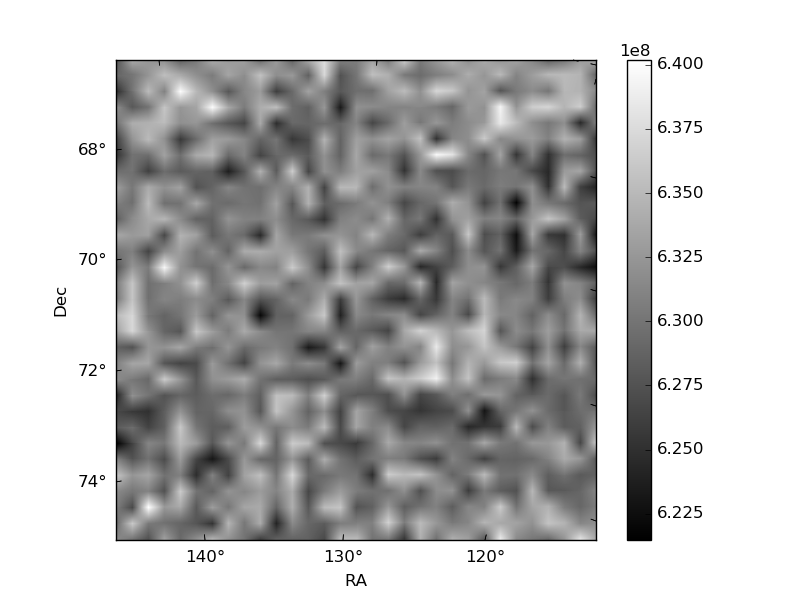
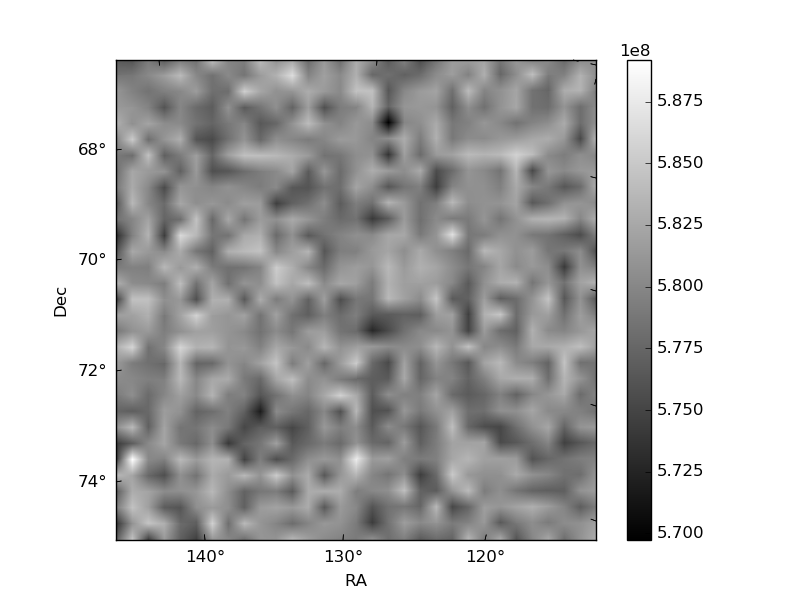
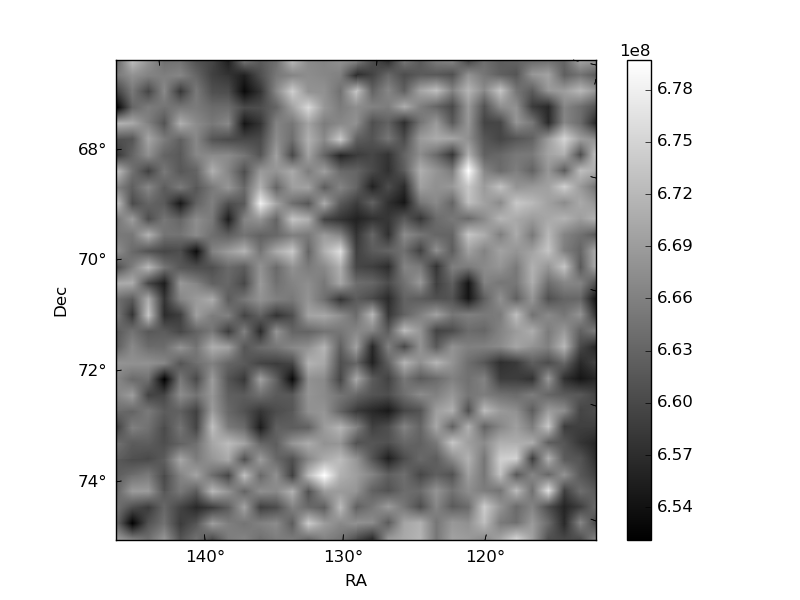
Histogram calculated using DETX and DETY for each event in the final _common_clean file
| Quadrant A | 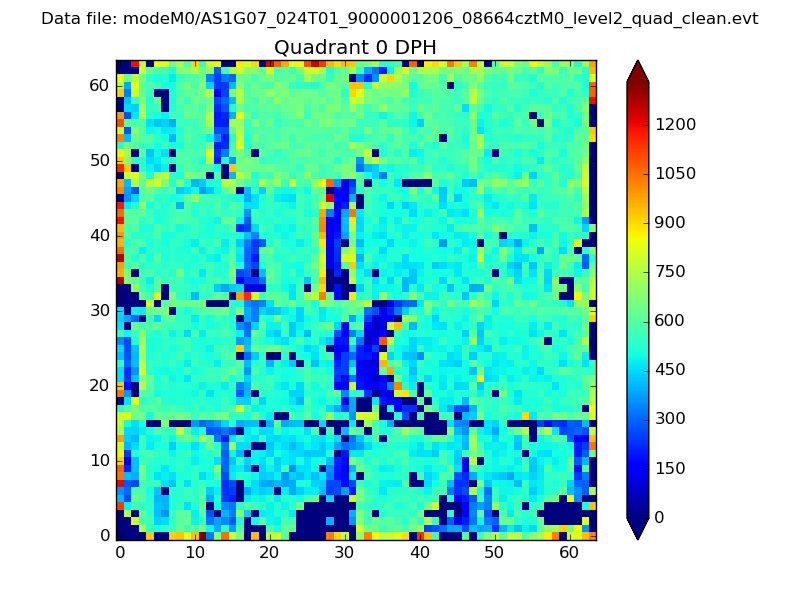 |
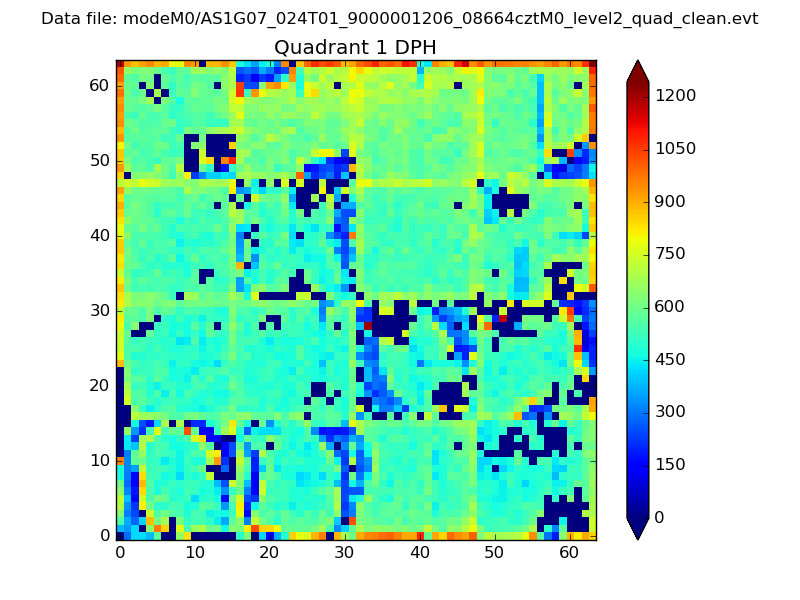 |
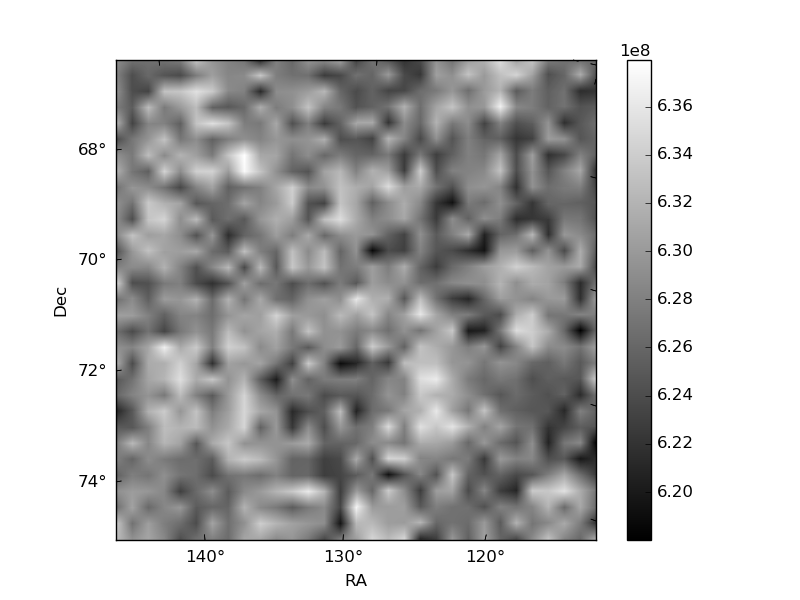
Quadrant B |
|---|---|---|---|
| Quadrant D | 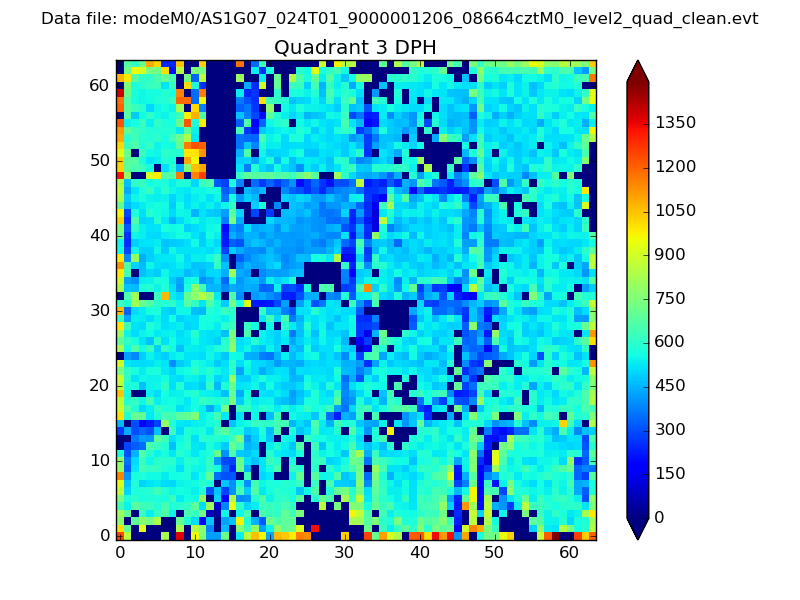 |
 |
Quadrant C |
| Plot type | Count rate plots | Images |
|---|---|---|
| Comparison with Poisson distribution Blue bars denote a histogram of data divided into 1 sec bins. Red curve is a Poisson curve with rate = median count rate of data. |
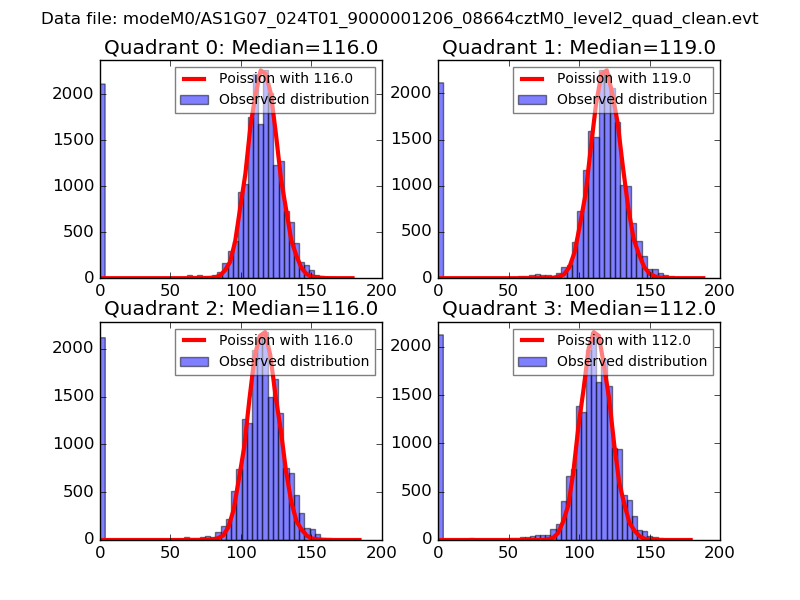 |
 |
| Quadrant-wise count rates Data is divided into 100 sec bins |
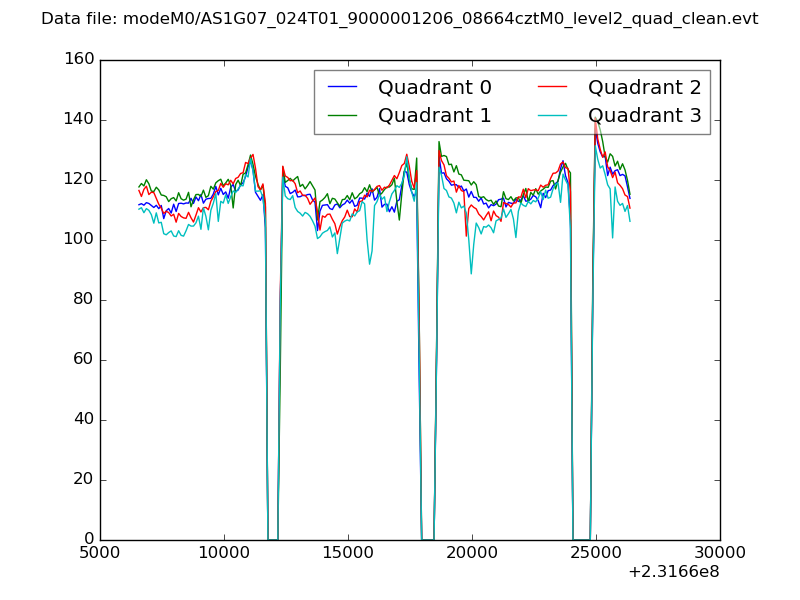 |
|
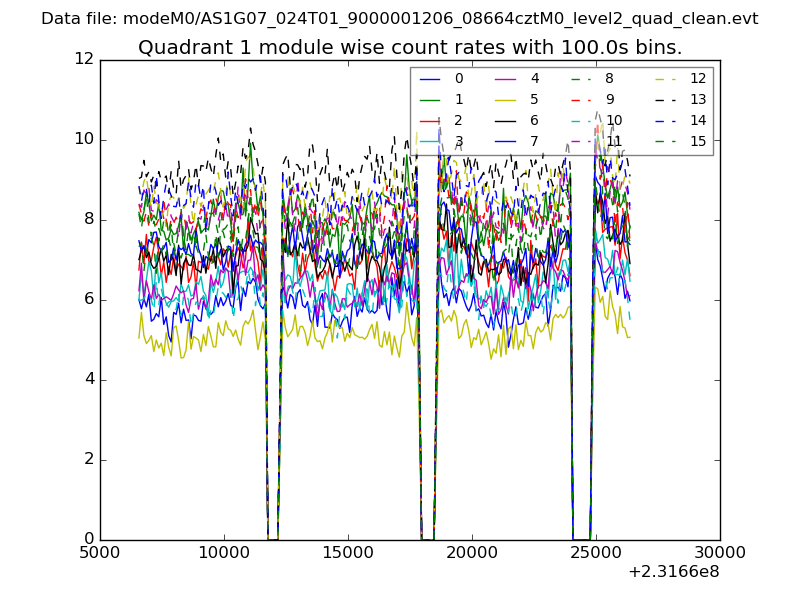
| Module-wise count rates for Quadrant A Data is divided into 100 sec bins |
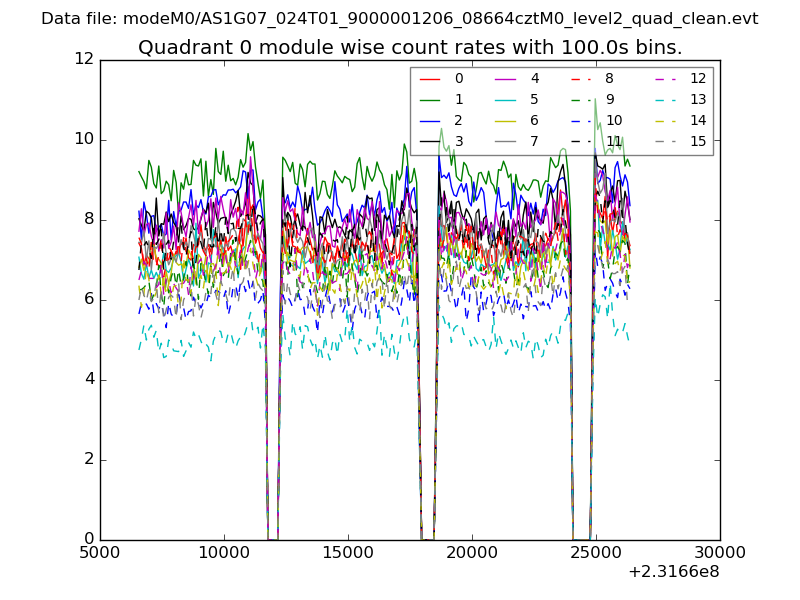 |
 |
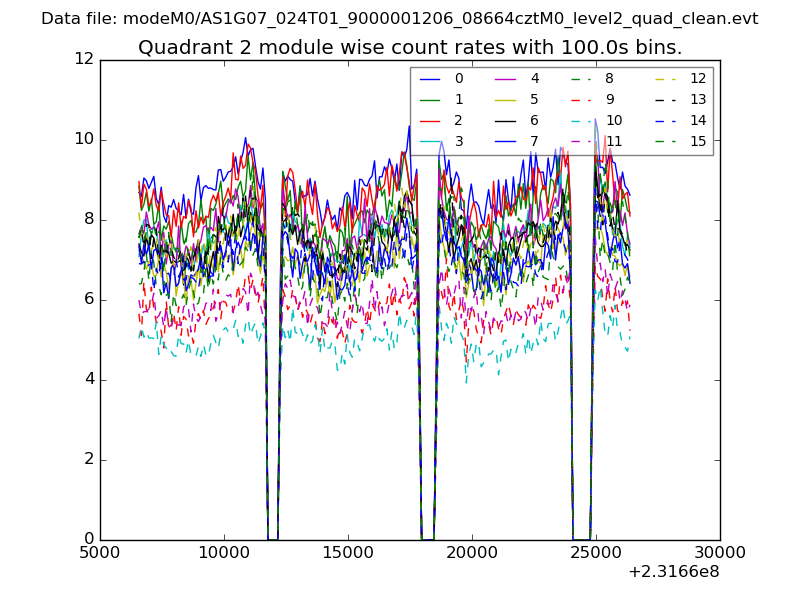
| Module-wise count rates for Quadrant B Data is divided into 100 sec bins |
 |
 |
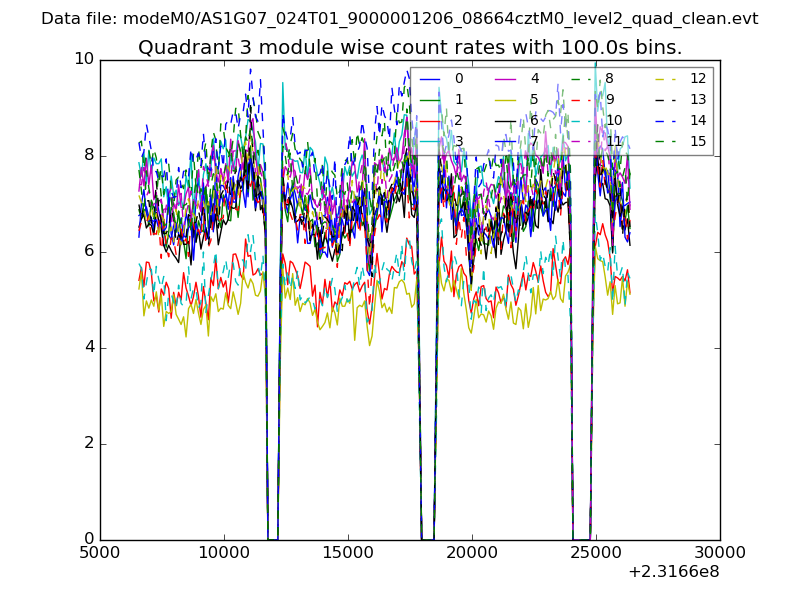
| Module-wise count rates for Quadrant C Data is divided into 100 sec bins |
 |
 |
| Module-wise count rates for Quadrant D Data is divided into 100 sec bins |
 |
 |
| Parameter | Plot |
|---|---|
| CZT HV Monitor | 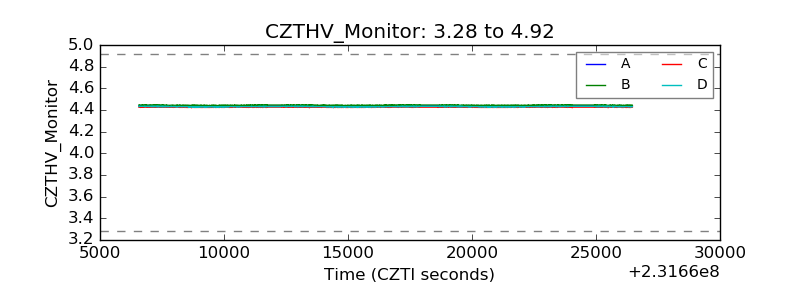 |
| D_VDD | 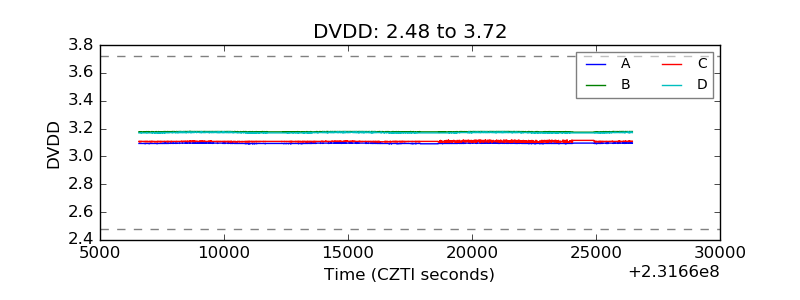 |
| Temperature 1 | 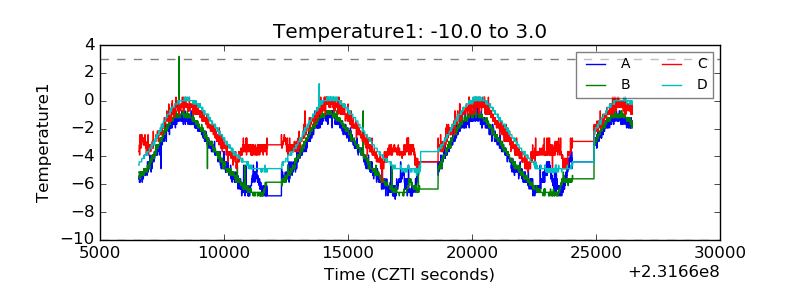 |
| Veto HV Monitor | 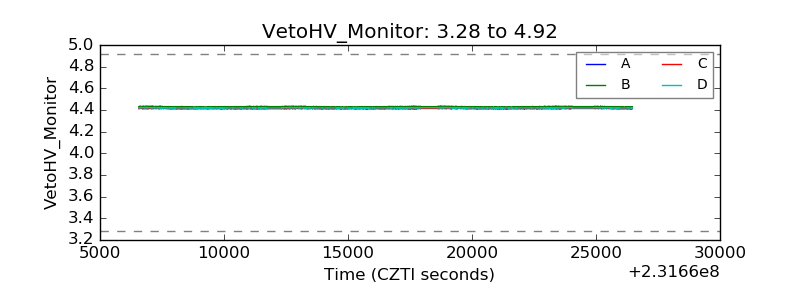 |
| Veto LLD | 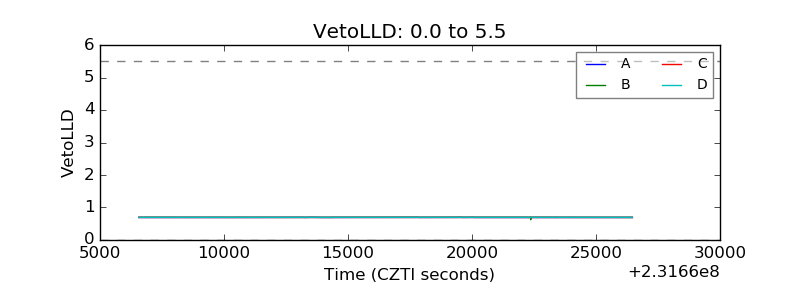 |
| Alpha Counter | 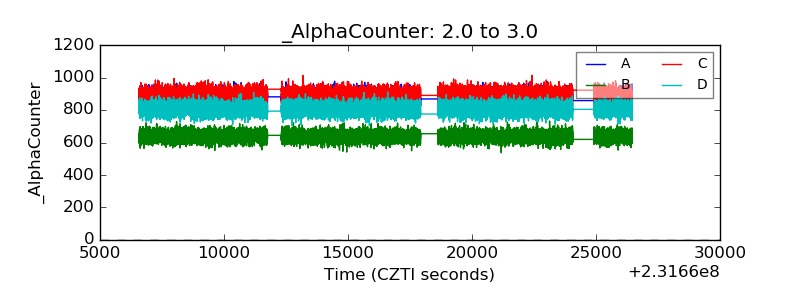 |
| _CPM_Rate | 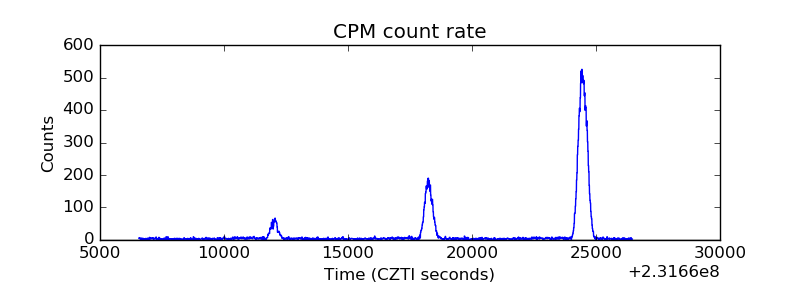 |
| CZT Counter | 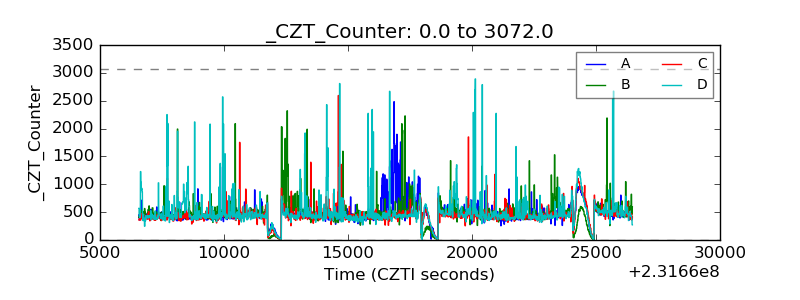 |
| +2.5 Volts monitor |  |
| +5 Volts monitor |  |
| _ROLL_ROT | 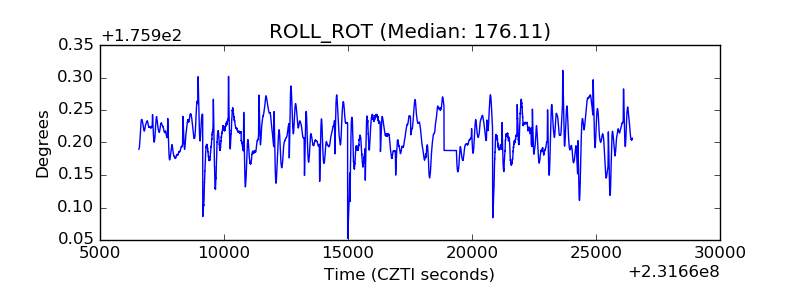 |
| _Roll_DEC | 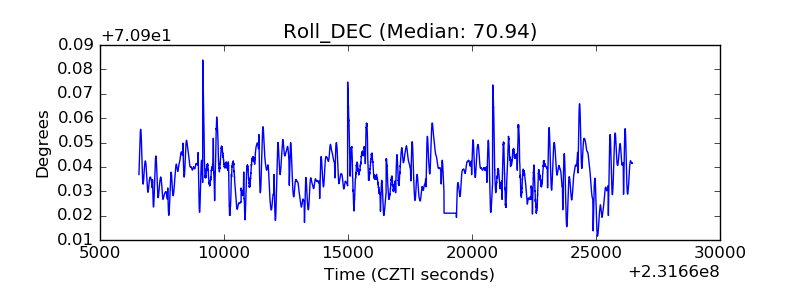 |
| _Roll_RA | 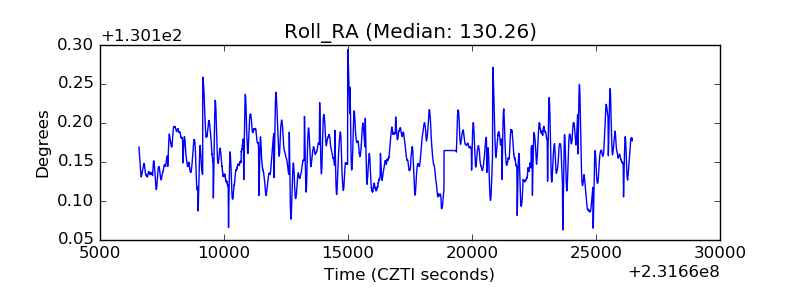 |
| Veto Counter | 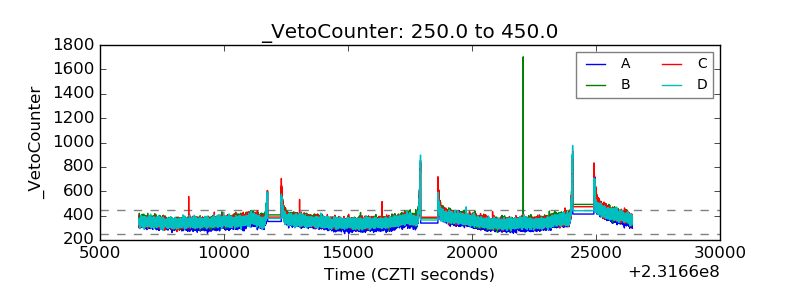 |