| Param | Original file | Final file |
|---|---|---|
| Filename | modeM0/AS1G07_024T01_9000001206_08665cztM0_level2.evt | modeM0/AS1G07_024T01_9000001206_08665cztM0_level2_quad_clean.evt |
| Size (bytes) | 1,500,137,280 | 389,450,880 |
| Size | 1.4 GB | 371.4 MB |
| Events in quadrant A | 10,769,425 | 2,578,397 |
| Events in quadrant B | 11,487,160 | 2,636,890 |
| Events in quadrant C | 10,193,388 | 2,589,646 |
| Events in quadrant D | 11,492,798 | 2,475,832 |
| Mode M0 | |||
|---|---|---|---|
| Quadrant | BADHDUFLAG | Total packets | Discarded packets |
| A | 0 | 47918 | 357 |
| B | 0 | 49298 | 416 |
| C | 0 | 46470 | 327 |
| D | 0 | 50451 | 390 |
| Mode M9 | |||
|---|---|---|---|
| Quadrant | BADHDUFLAG | Total packets | Discarded packets |
| A | 0 | 32 | 0 |
| B | 0 | 32 | 0 |
| C | 0 | 32 | 0 |
| D | 0 | 32 | 0 |
| Mode SS | |||
|---|---|---|---|
| Quadrant | BADHDUFLAG | Total packets | Discarded packets |
| A | 0 | 450 | 2 |
| B | 0 | 450 | 2 |
| C | 0 | 450 | 2 |
| D | 0 | 450 | 4 |
| Quadrant | Total seconds | Saturated seconds | Saturation percentage |
|---|---|---|---|
| A | 22026 | 268 | 1.216744% |
| B | 22027 | 336 | 1.525401% |
| C | 22031 | 193 | 0.876038% |
| D | 22013 | 506 | 2.298642% |
Noise dominated data is calculated using 1-second bins in cleaned event files. If a bin has >2000 counts, and if more than 50% of those come from <1% of pixels, then it is considered to be noise-dominated and hence unusable.
| Quadrant | # 1 sec bins | Bins with >0 counts | Bins with >2000 counts | High rate bins dominated by noise | Noise dominated (total time) | Noise dominated (detector-on time) | Marked lightcurve |
|---|---|---|---|---|---|---|---|
| A | 25320 | 22167 | 34 | 34 | 0.13% | 0.15% | 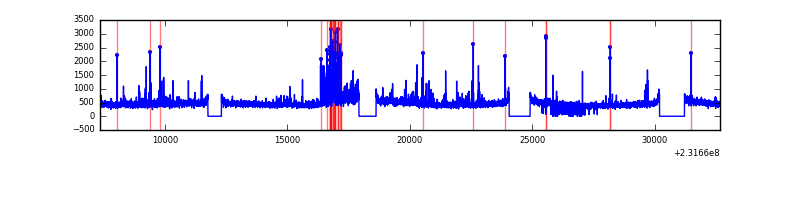 |
| B | 25320 | 22160 | 127 | 127 | 0.50% | 0.57% | 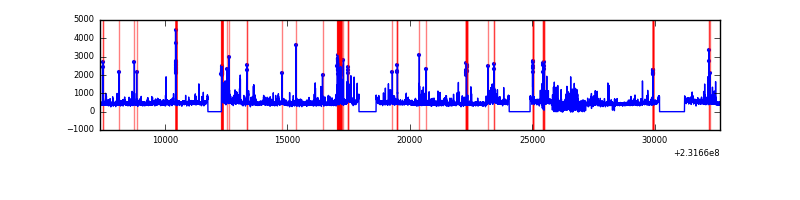 |
| C | 25320 | 22166 | 45 | 45 | 0.18% | 0.20% | 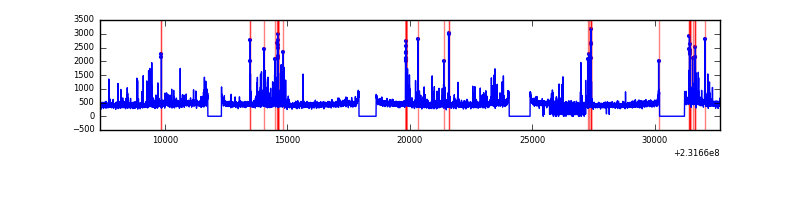 |
| D | 25320 | 22163 | 326 | 326 | 1.29% | 1.47% | 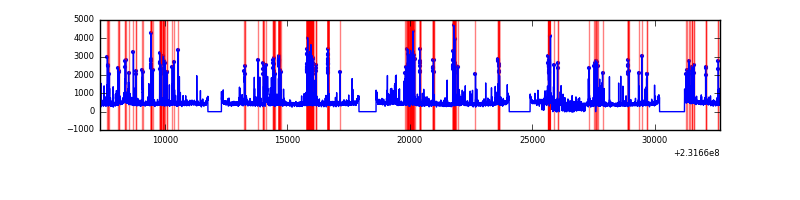 |
Top three noisy pixels from each quadrant. If the there are fewer than three noisy pixels in the level2.evt file, extra rows are filled as -1
| Pixel properties | Quadrant properties | ||||||
|---|---|---|---|---|---|---|---|
| Quadrant | DetID | PixID | Counts | Sigma | Mean | Median | Sigma |
| A | 8 | 5 | 1050257 | 2083.14 | 2484 | 2424 | 503.0 |
| A | 15 | 174 | 56545 | 107.6 | 2484 | 2424 | 503.0 |
| A | 5 | 16 | 30294 | 55.41 | 2484 | 2424 | 503.0 |
| B | 10 | 16 | 463349 | 979.59 | 2511 | 2449 | 470.5 |
| B | 4 | 48 | 357785 | 755.23 | 2511 | 2449 | 470.5 |
| B | 0 | 231 | 247582 | 521.0 | 2511 | 2449 | 470.5 |
| C | 4 | 254 | 534687 | 955.48 | 2432 | 2441 | 557.0 |
| C | 1 | 16 | 133903 | 236.0 | 2432 | 2441 | 557.0 |
| C | 13 | 61 | 18407 | 28.66 | 2432 | 2441 | 557.0 |
| D | 10 | 253 | 755183 | 1287.54 | 2415 | 2340 | 584.7 |
| D | 2 | 152 | 419053 | 712.68 | 2415 | 2340 | 584.7 |
| D | 7 | 71 | 336046 | 570.72 | 2415 | 2340 | 584.7 |
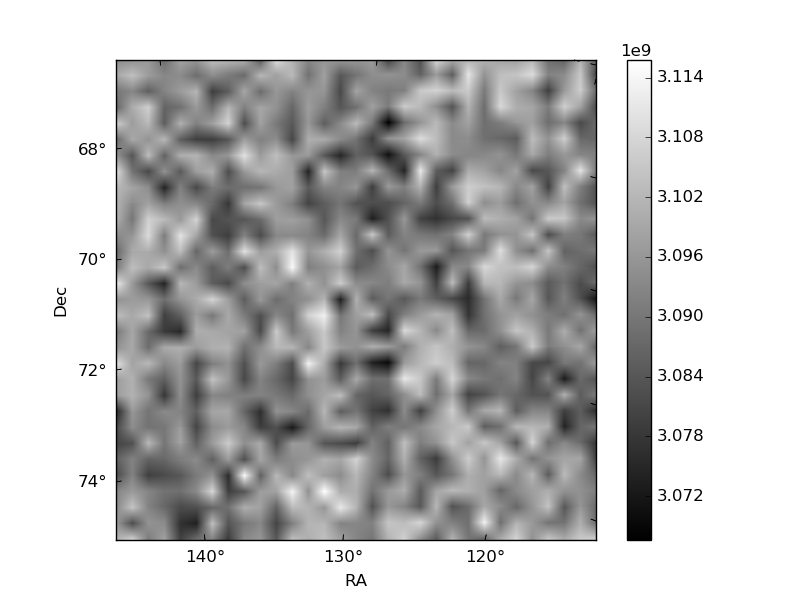
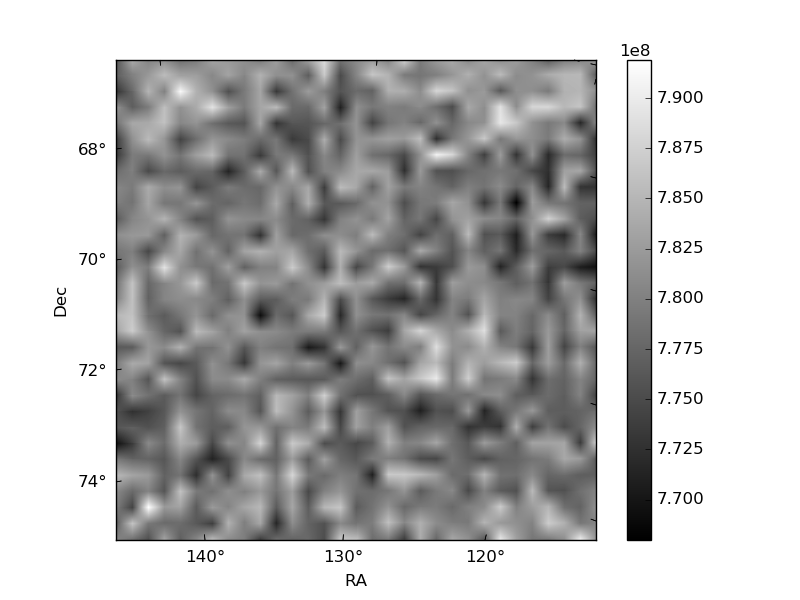
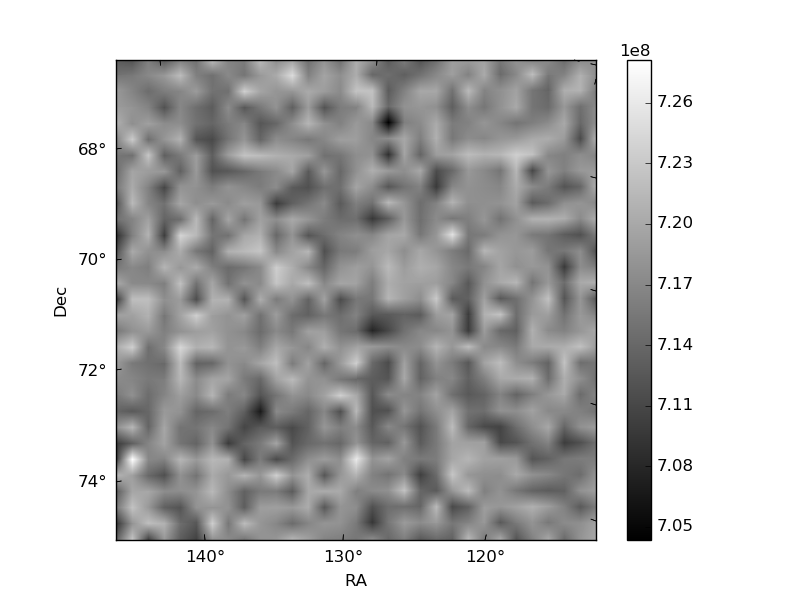
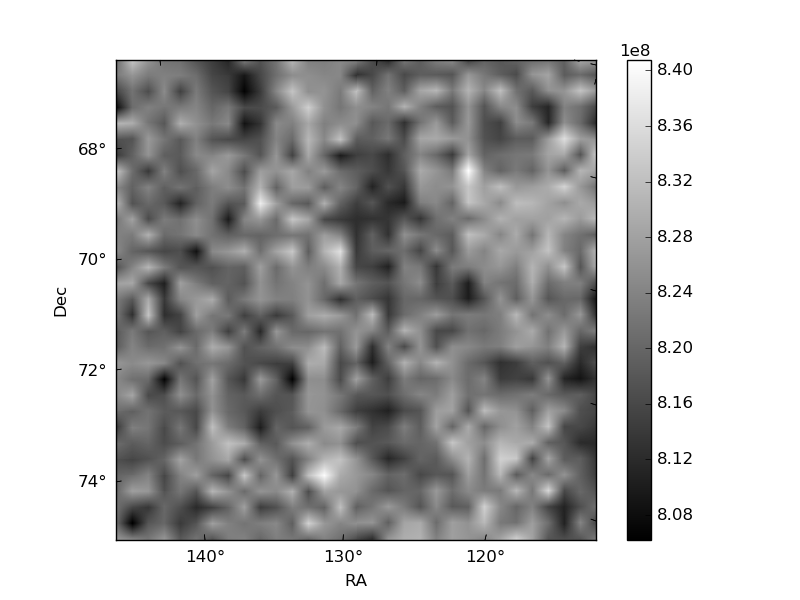
Histogram calculated using DETX and DETY for each event in the final _common_clean file
| Quadrant A | 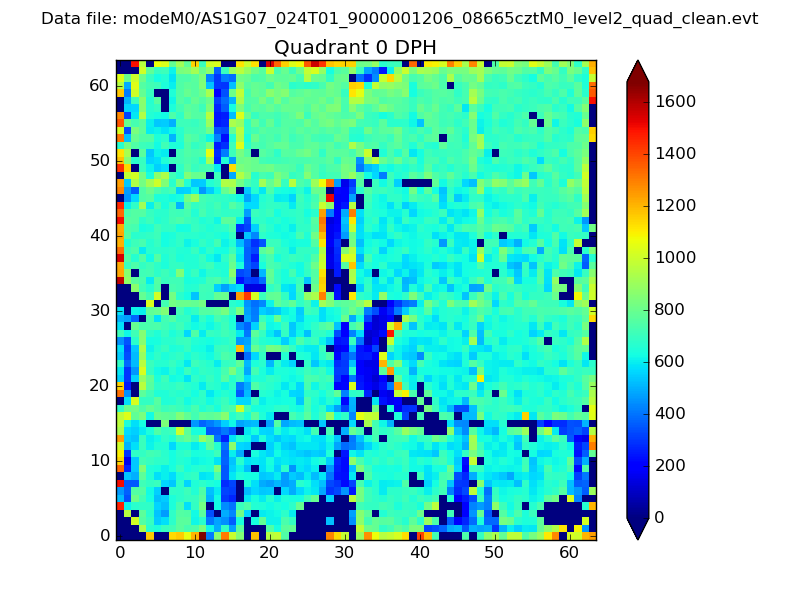 |
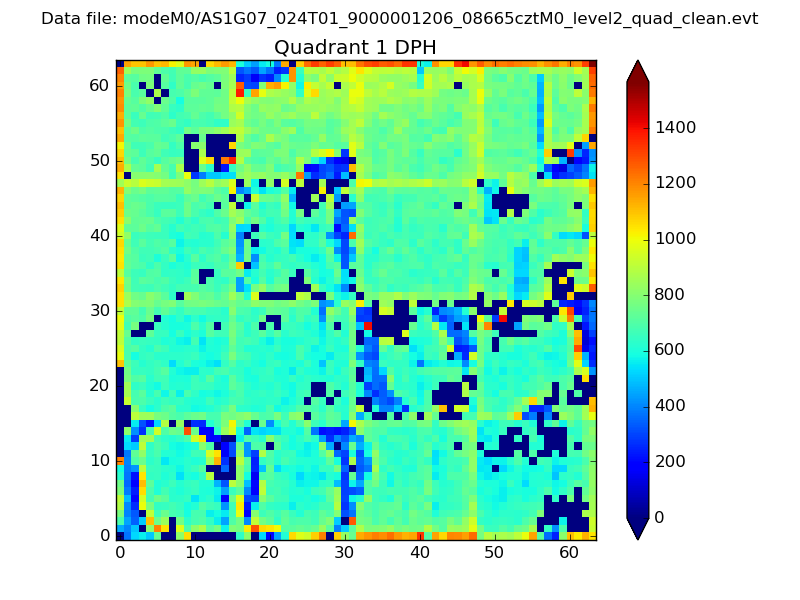 |
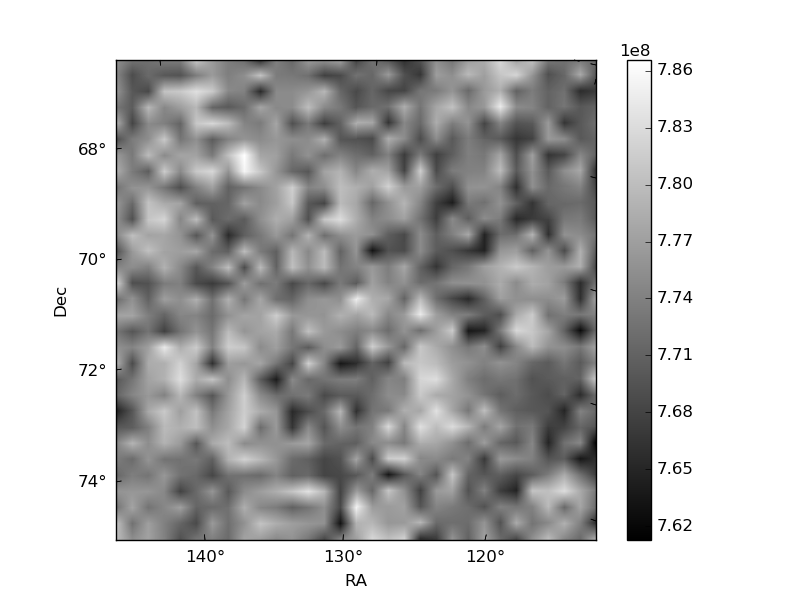
Quadrant B |
|---|---|---|---|
| Quadrant D | 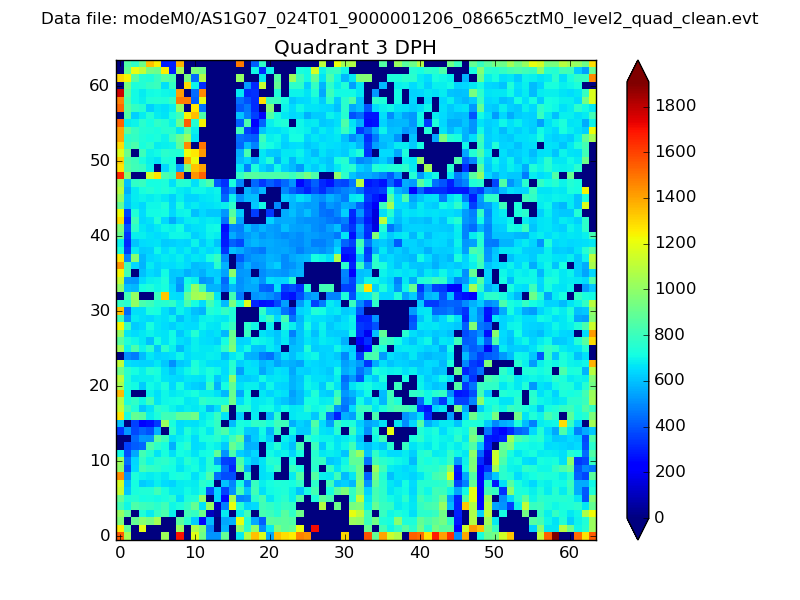 |
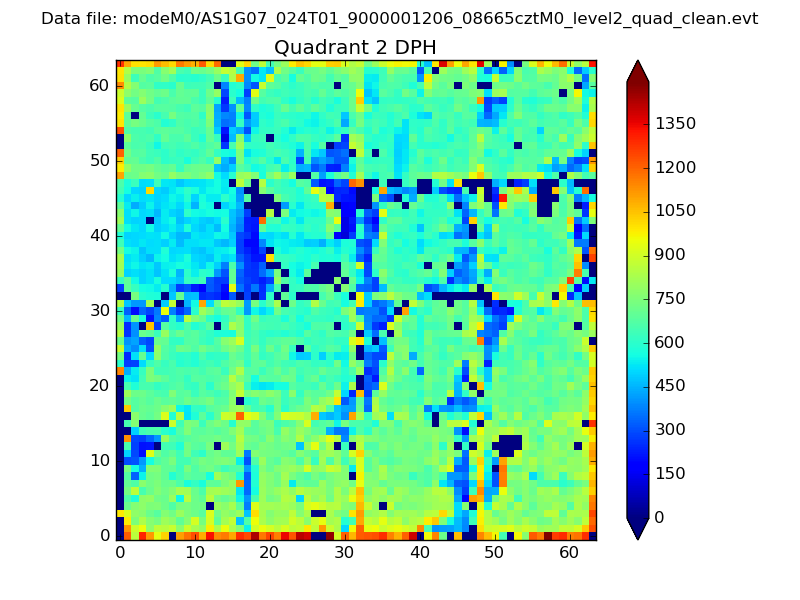 |
Quadrant C |
| Plot type | Count rate plots | Images |
|---|---|---|
| Comparison with Poisson distribution Blue bars denote a histogram of data divided into 1 sec bins. Red curve is a Poisson curve with rate = median count rate of data. |
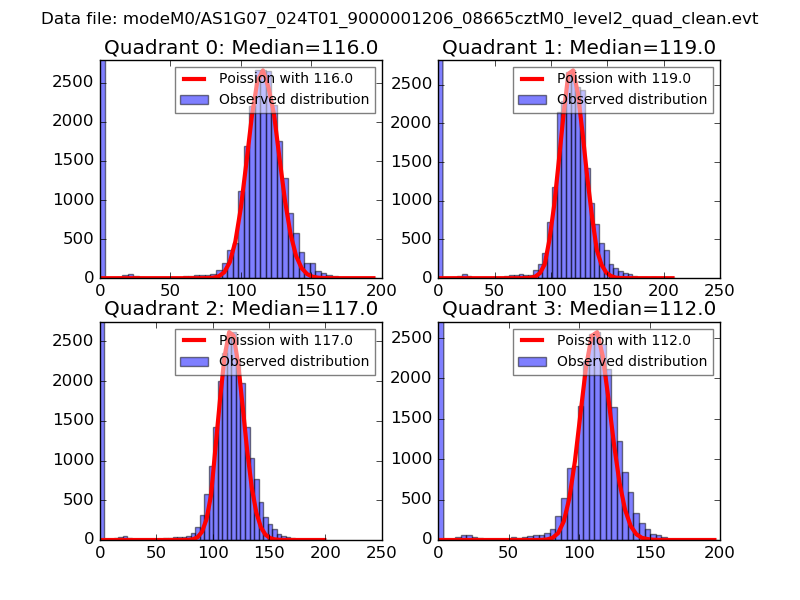 |
 |
| Quadrant-wise count rates Data is divided into 100 sec bins |
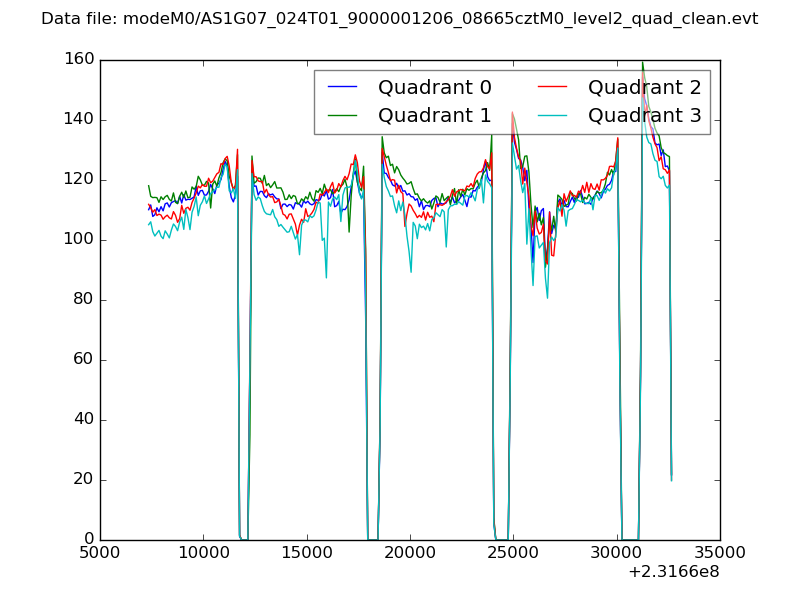 |
|
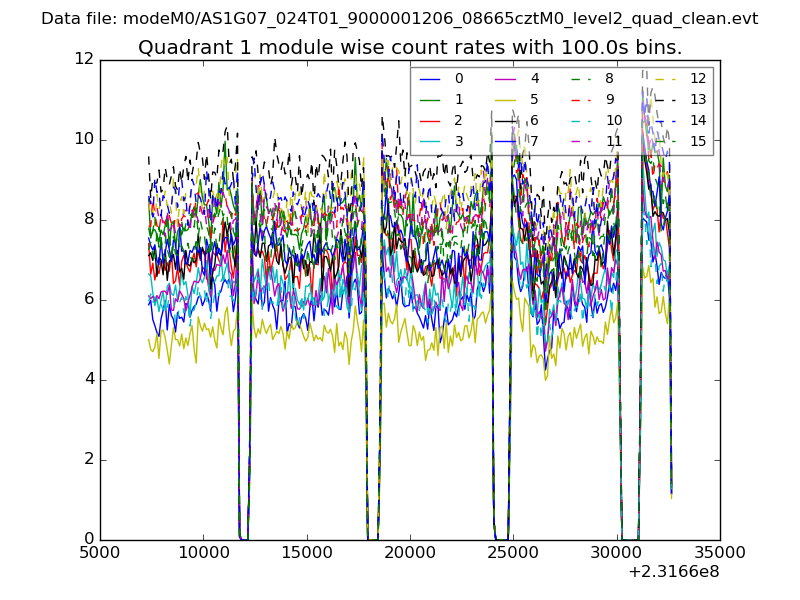
| Module-wise count rates for Quadrant A Data is divided into 100 sec bins |
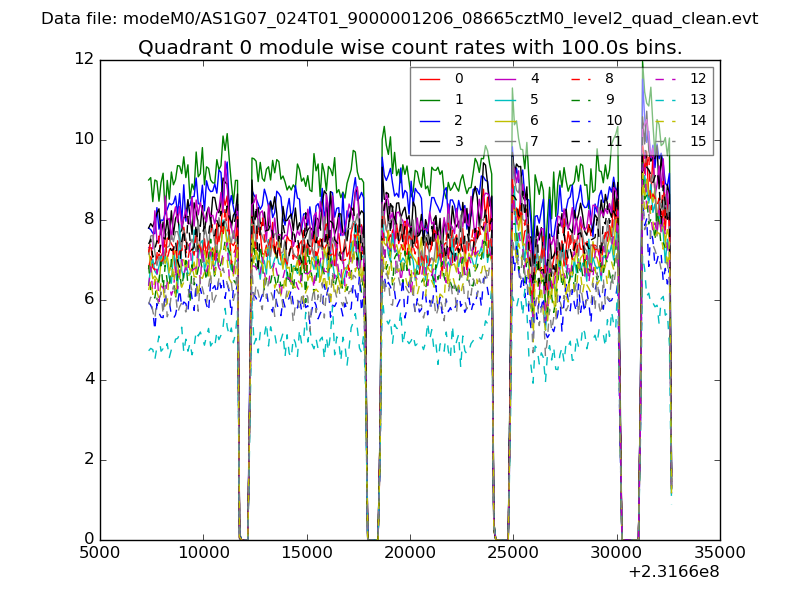 |
 |
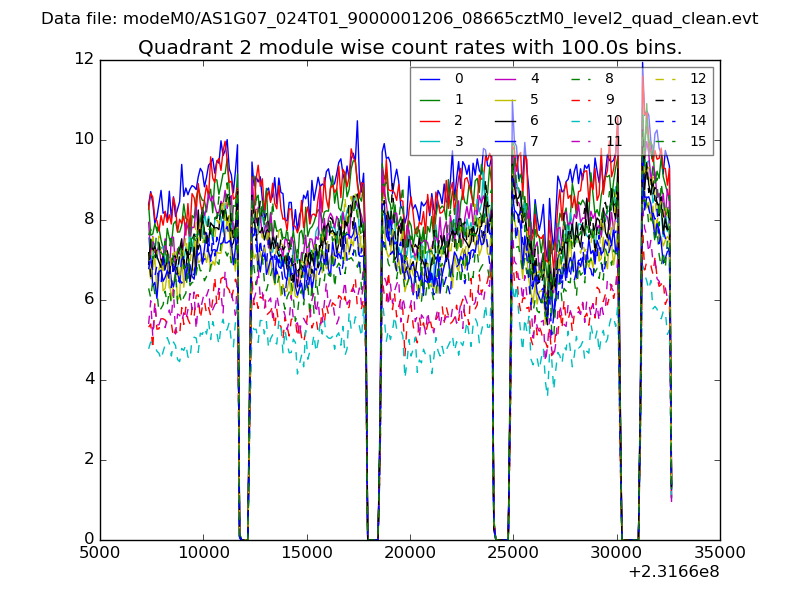
| Module-wise count rates for Quadrant B Data is divided into 100 sec bins |
 |
 |
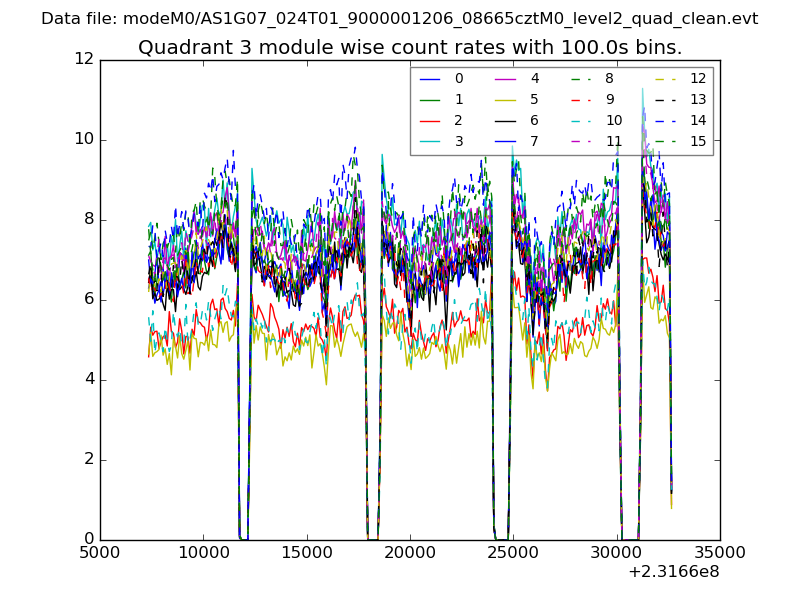
| Module-wise count rates for Quadrant C Data is divided into 100 sec bins |
 |
 |
| Module-wise count rates for Quadrant D Data is divided into 100 sec bins |
 |
 |
| Parameter | Plot |
|---|---|
| CZT HV Monitor | 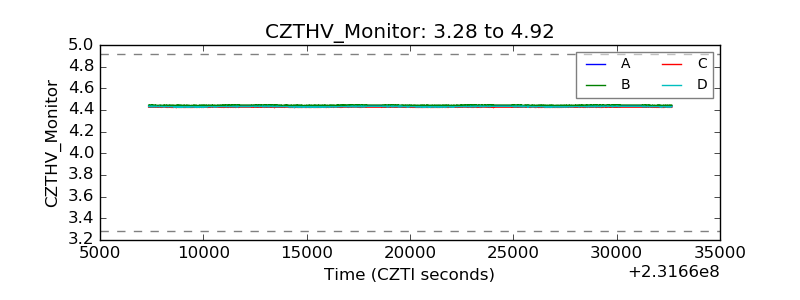 |
| D_VDD | 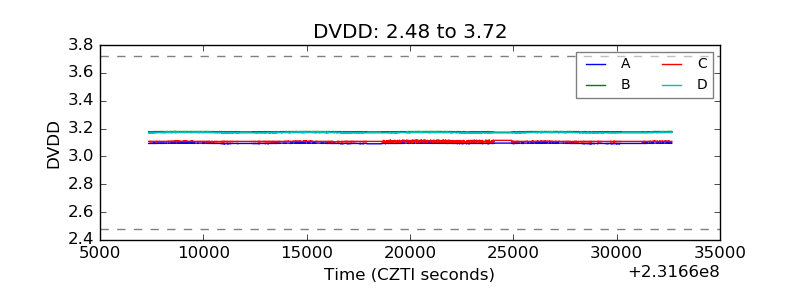 |
| Temperature 1 | 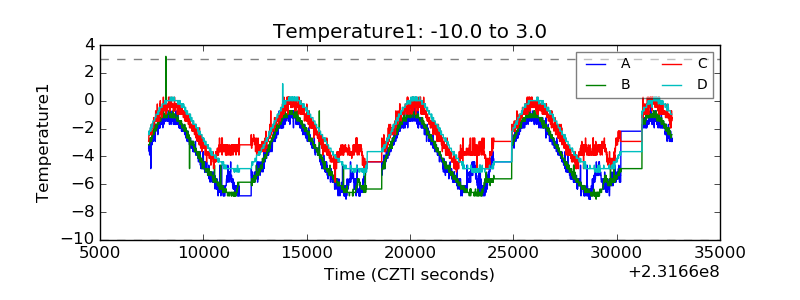 |
| Veto HV Monitor | 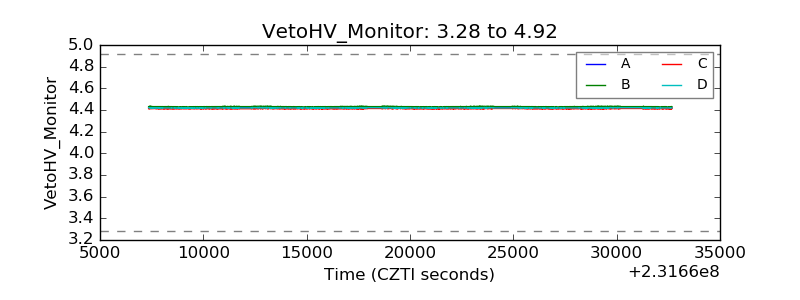 |
| Veto LLD | 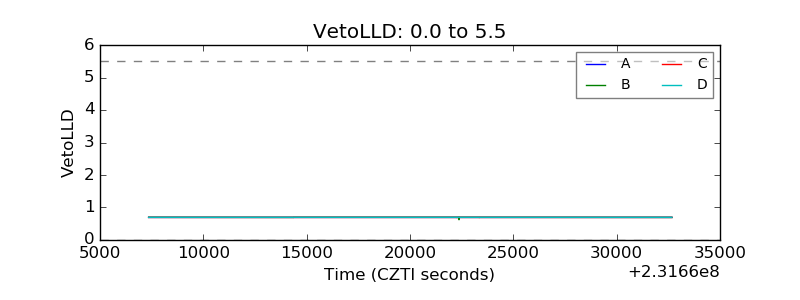 |
| Alpha Counter | 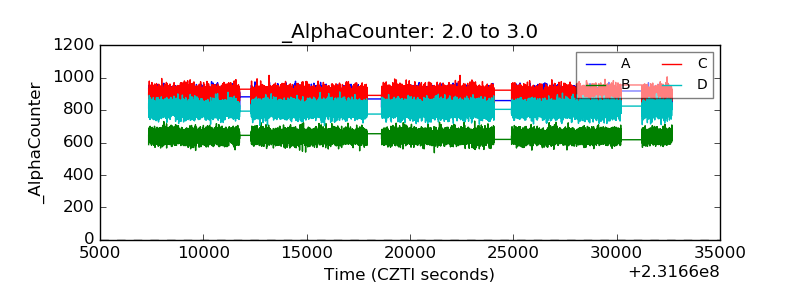 |
| _CPM_Rate | 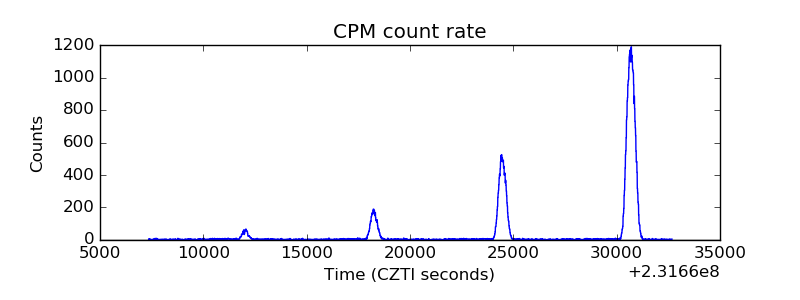 |
| CZT Counter | 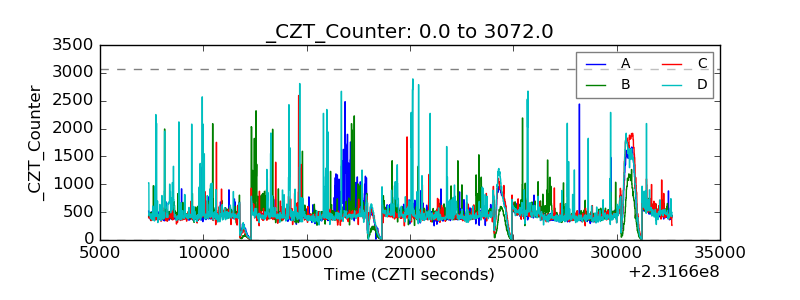 |
| +2.5 Volts monitor |  |
| +5 Volts monitor |  |
| _ROLL_ROT | 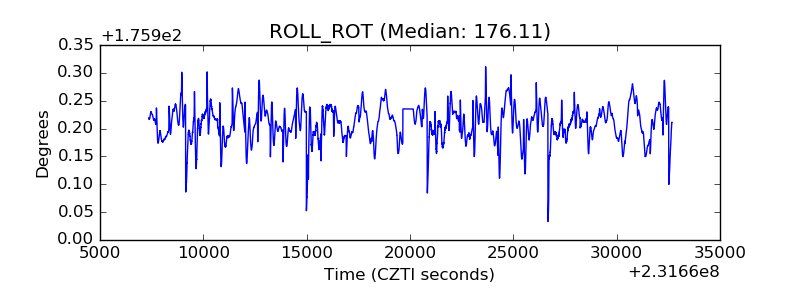 |
| _Roll_DEC | 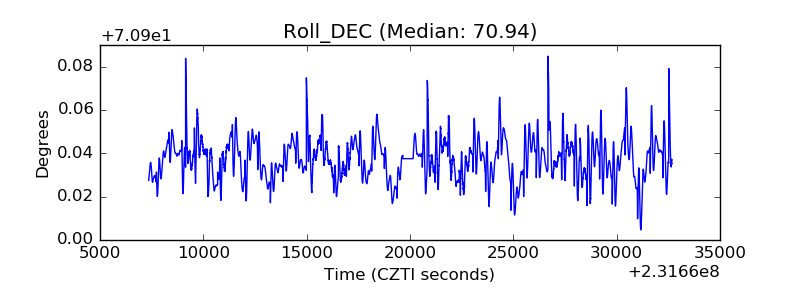 |
| _Roll_RA | 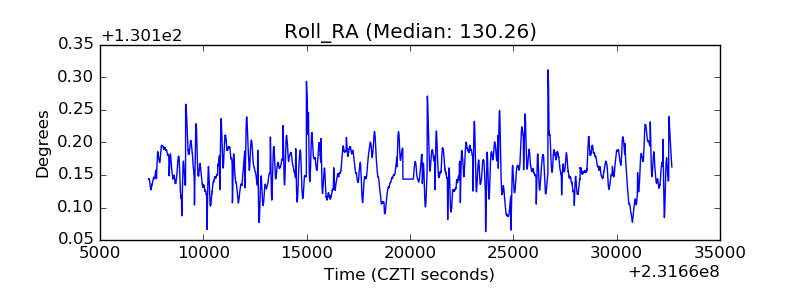 |
| Veto Counter | 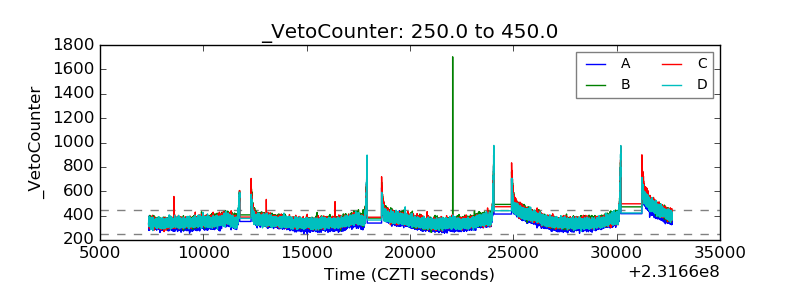 |