| Param | Original file | Final file |
|---|---|---|
| Filename | modeM0/AS1G07_024T01_9000001206_08667cztM0_level2.evt | modeM0/AS1G07_024T01_9000001206_08667cztM0_level2_quad_clean.evt |
| Size (bytes) | 387,489,600 | 108,403,200 |
| Size | 369.5 MB | 103.4 MB |
| Events in quadrant A | 2,581,121 | 722,005 |
| Events in quadrant B | 2,996,615 | 736,765 |
| Events in quadrant C | 2,840,418 | 722,497 |
| Events in quadrant D | 2,925,225 | 699,730 |
| Mode M0 | |||
|---|---|---|---|
| Quadrant | BADHDUFLAG | Total packets | Discarded packets |
| A | 0 | 11811 | 2 |
| B | 0 | 12916 | 1 |
| C | 0 | 12476 | 1 |
| D | 0 | 12879 | 1 |
| Mode M9 | |||
|---|---|---|---|
| Quadrant | BADHDUFLAG | Total packets | Discarded packets |
| A | 0 | 12 | 0 |
| B | 0 | 12 | 0 |
| C | 0 | 12 | 0 |
| D | 0 | 12 | 0 |
| Mode SS | |||
|---|---|---|---|
| Quadrant | BADHDUFLAG | Total packets | Discarded packets |
| A | 0 | 116 | 0 |
| B | 0 | 116 | 0 |
| C | 0 | 116 | 0 |
| D | 0 | 116 | 0 |
| Quadrant | Total seconds | Saturated seconds | Saturation percentage |
|---|---|---|---|
| A | 5757 | 33 | 0.573215% |
| B | 5757 | 69 | 1.198541% |
| C | 5757 | 139 | 2.414452% |
| D | 5757 | 116 | 2.014938% |
Noise dominated data is calculated using 1-second bins in cleaned event files. If a bin has >2000 counts, and if more than 50% of those come from <1% of pixels, then it is considered to be noise-dominated and hence unusable.
| Quadrant | # 1 sec bins | Bins with >0 counts | Bins with >2000 counts | High rate bins dominated by noise | Noise dominated (total time) | Noise dominated (detector-on time) | Marked lightcurve |
|---|---|---|---|---|---|---|---|
| A | 6913 | 5757 | 1 | 1 | 0.01% | 0.02% | 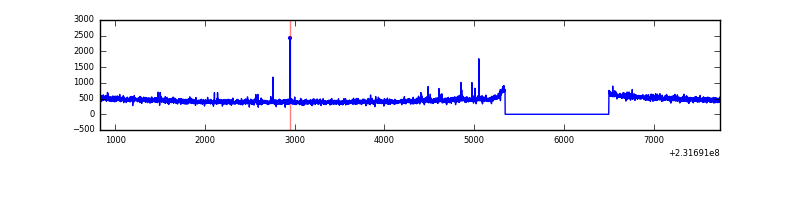 |
| B | 6913 | 5757 | 23 | 23 | 0.33% | 0.40% | 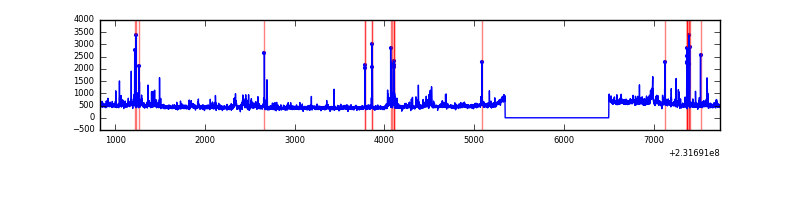 |
| C | 6913 | 5757 | 65 | 65 | 0.94% | 1.13% | 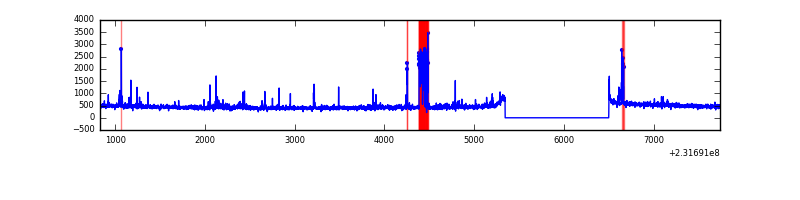 |
| D | 6913 | 5757 | 71 | 71 | 1.03% | 1.23% | 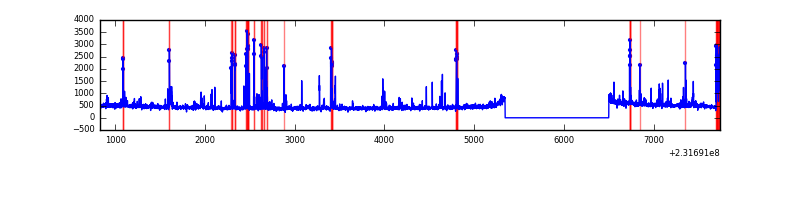 |
Top three noisy pixels from each quadrant. If the there are fewer than three noisy pixels in the level2.evt file, extra rows are filled as -1
| Pixel properties | Quadrant properties | ||||||
|---|---|---|---|---|---|---|---|
| Quadrant | DetID | PixID | Counts | Sigma | Mean | Median | Sigma |
| A | 5 | 16 | 13049 | 92.46 | 661 | 646 | 134.1 |
| A | 15 | 174 | 10189 | 71.14 | 661 | 646 | 134.1 |
| A | 13 | 251 | 6602 | 44.4 | 661 | 646 | 134.1 |
| B | 4 | 48 | 135857 | 1086.31 | 669 | 653 | 124.5 |
| B | 0 | 231 | 73227 | 583.1 | 669 | 653 | 124.5 |
| B | 0 | 219 | 62255 | 494.95 | 669 | 653 | 124.5 |
| C | 4 | 254 | 265400 | 1763.95 | 648 | 650 | 150.1 |
| C | 1 | 16 | 45063 | 295.91 | 648 | 650 | 150.1 |
| C | 13 | 61 | 5137 | 29.9 | 648 | 650 | 150.1 |
| D | 10 | 253 | 137826 | 872.67 | 650 | 629 | 157.2 |
| D | 7 | 71 | 119239 | 754.44 | 650 | 629 | 157.2 |
| D | 2 | 152 | 86808 | 548.16 | 650 | 629 | 157.2 |
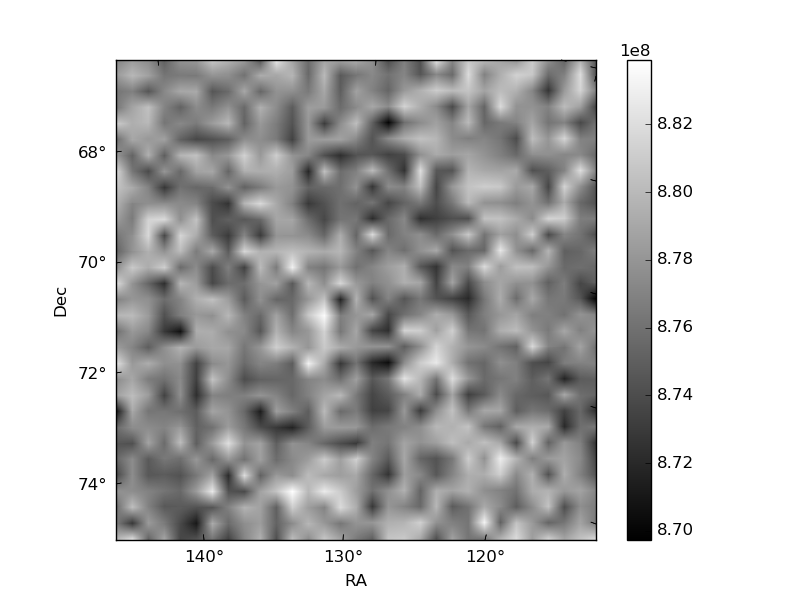
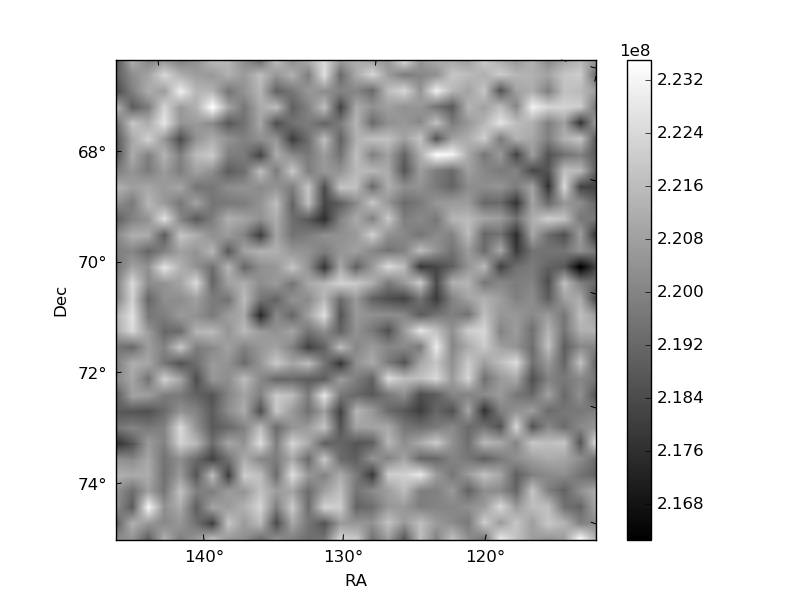
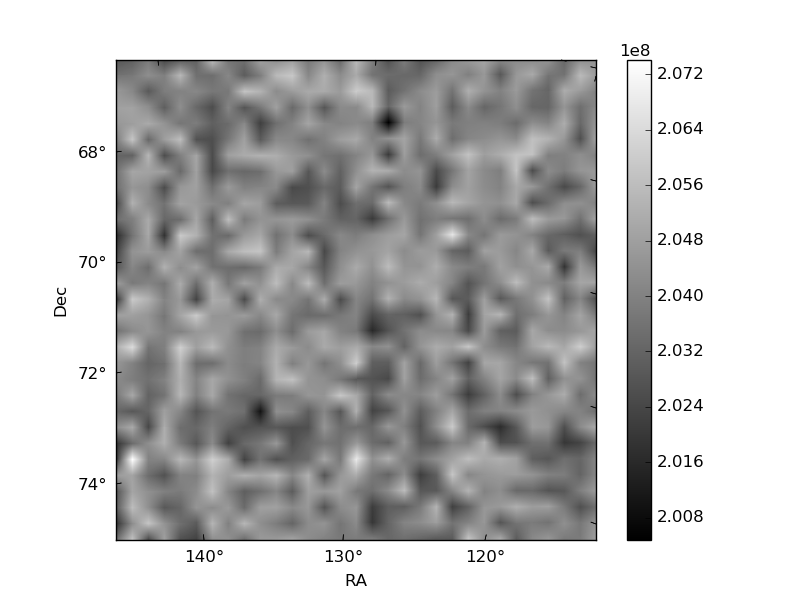
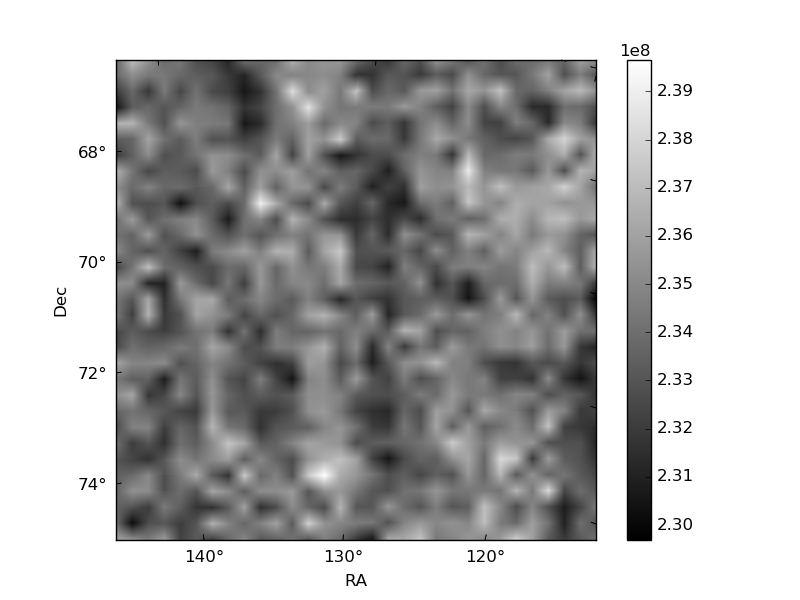
Histogram calculated using DETX and DETY for each event in the final _common_clean file
| Quadrant A | 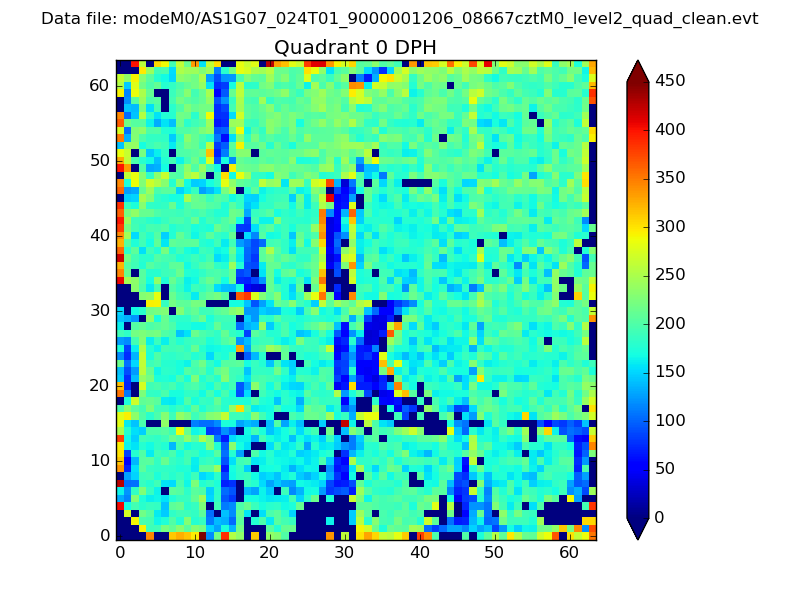 |
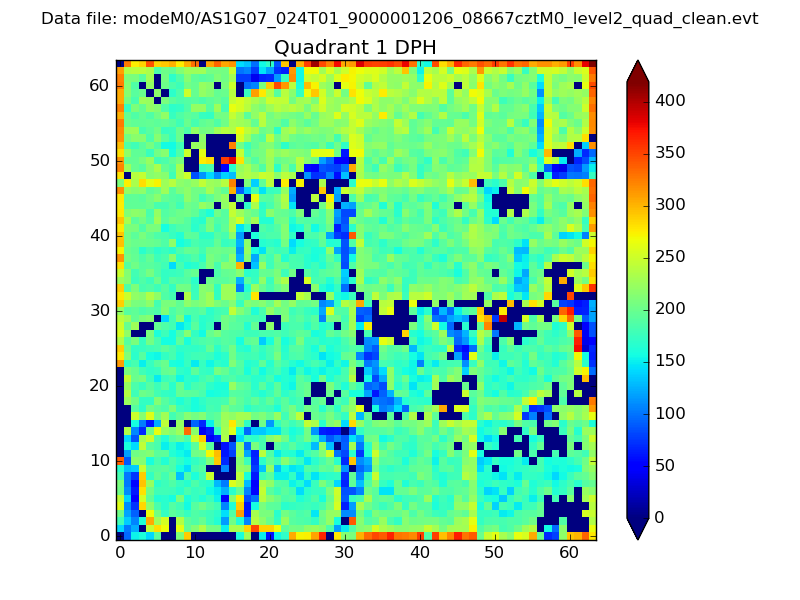 |
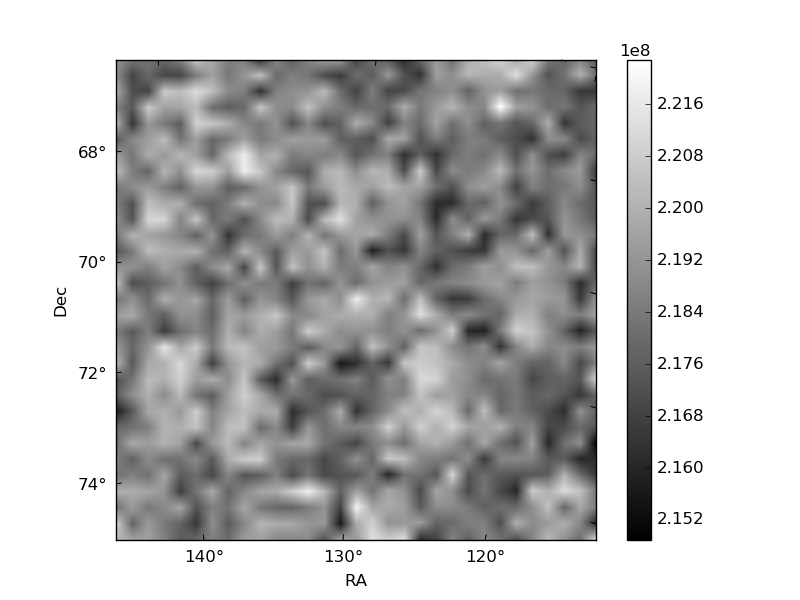
Quadrant B |
|---|---|---|---|
| Quadrant D | 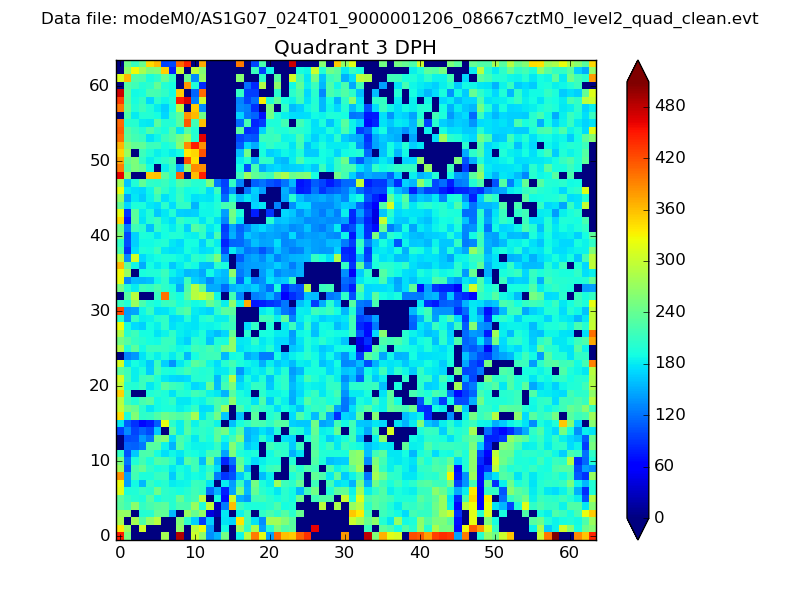 |
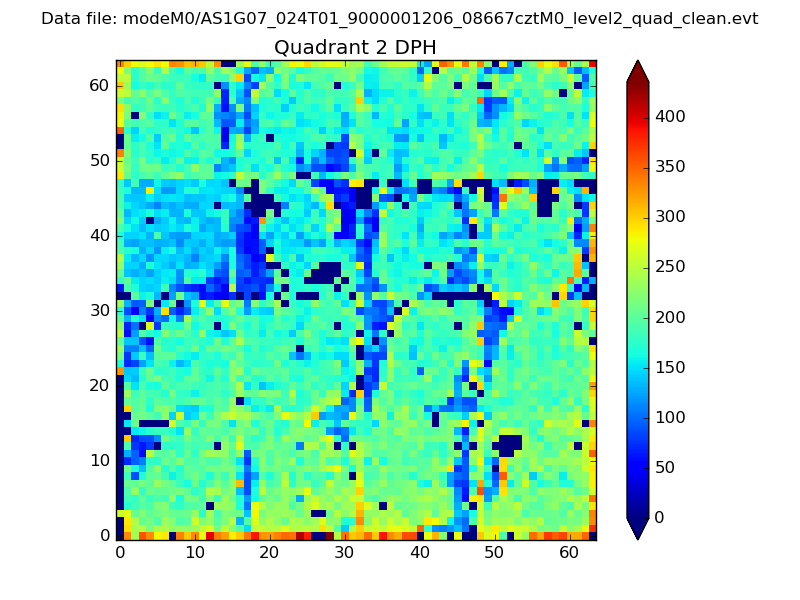 |
Quadrant C |
| Plot type | Count rate plots | Images |
|---|---|---|
| Comparison with Poisson distribution Blue bars denote a histogram of data divided into 1 sec bins. Red curve is a Poisson curve with rate = median count rate of data. |
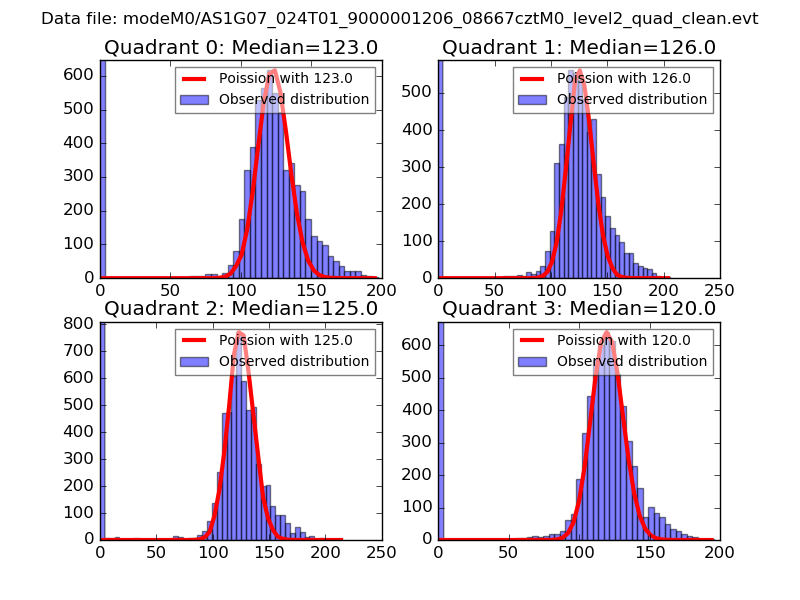 |
 |
| Quadrant-wise count rates Data is divided into 100 sec bins |
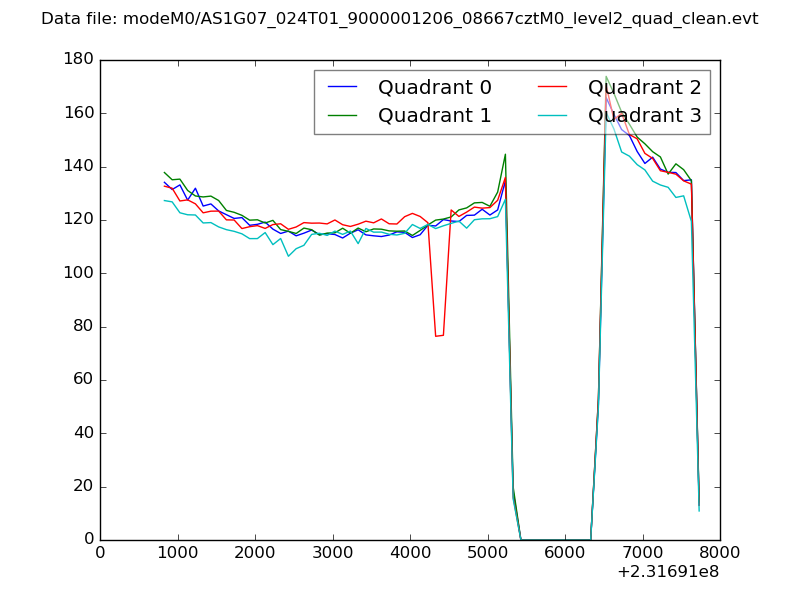 |
|
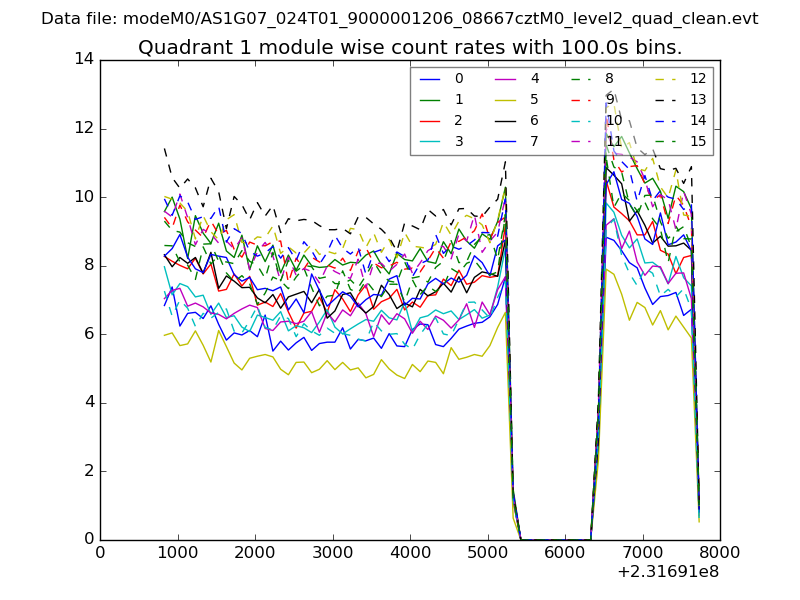
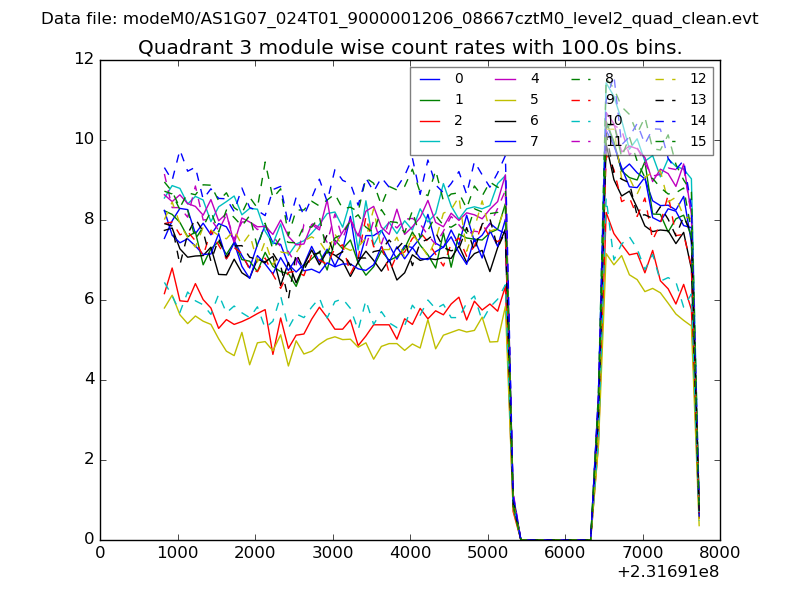
| Module-wise count rates for Quadrant A Data is divided into 100 sec bins |
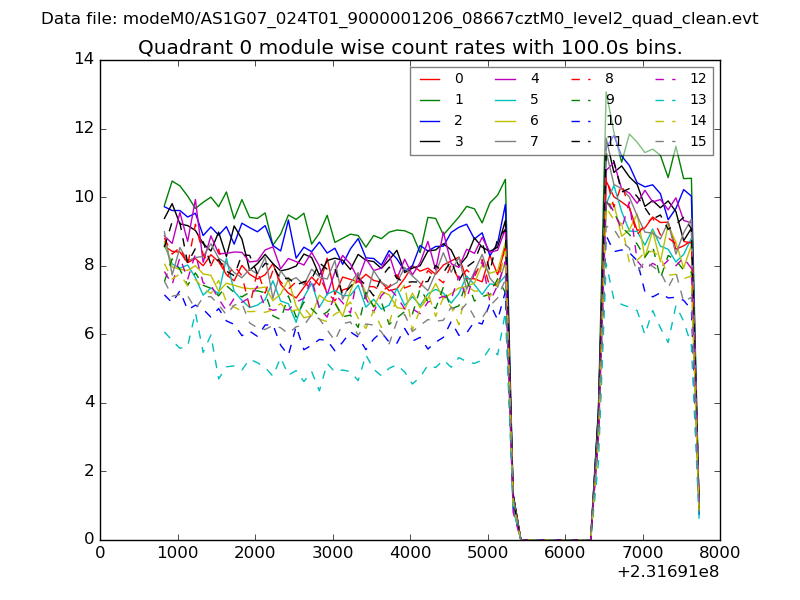 |
 |
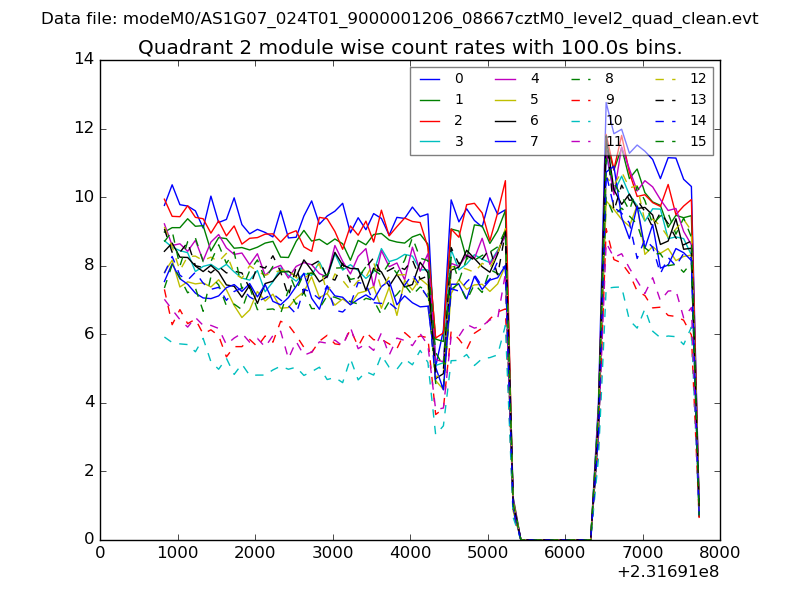
| Module-wise count rates for Quadrant B Data is divided into 100 sec bins |
 |
 |
| Module-wise count rates for Quadrant C Data is divided into 100 sec bins |
 |
 |
| Module-wise count rates for Quadrant D Data is divided into 100 sec bins |
 |
 |
| Parameter | Plot |
|---|---|
| CZT HV Monitor | 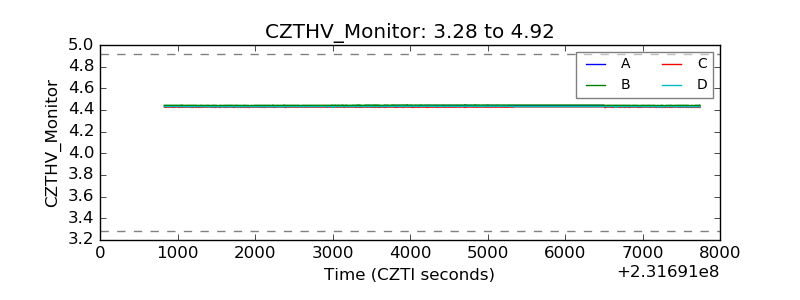 |
| D_VDD | 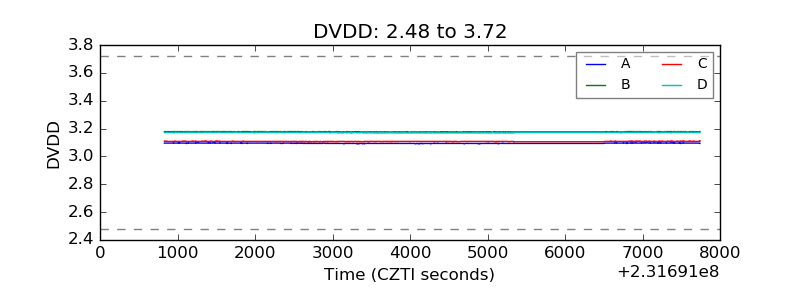 |
| Temperature 1 | 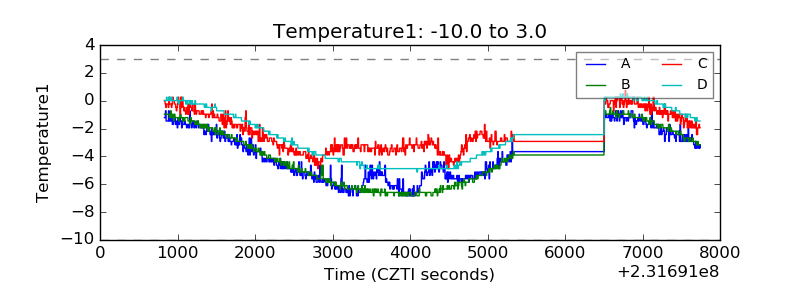 |
| Veto HV Monitor | 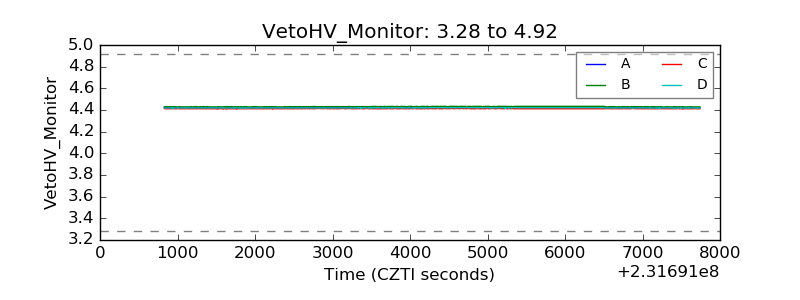 |
| Veto LLD | 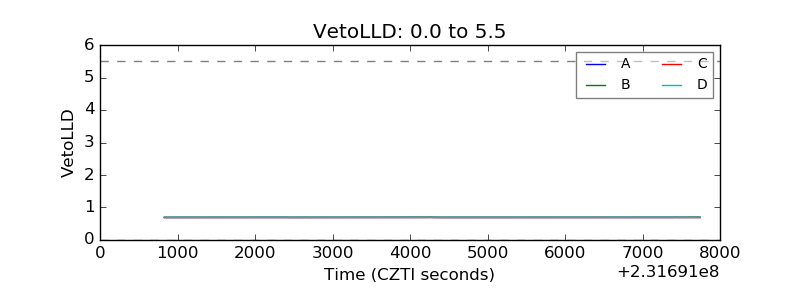 |
| Alpha Counter | 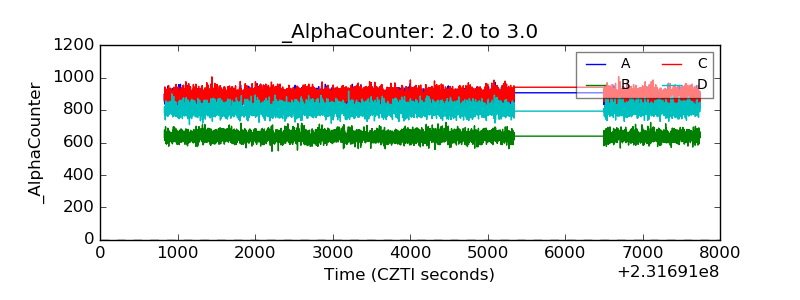 |
| _CPM_Rate | 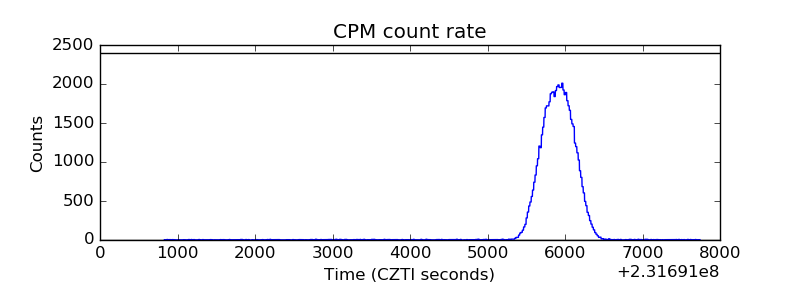 |
| CZT Counter | 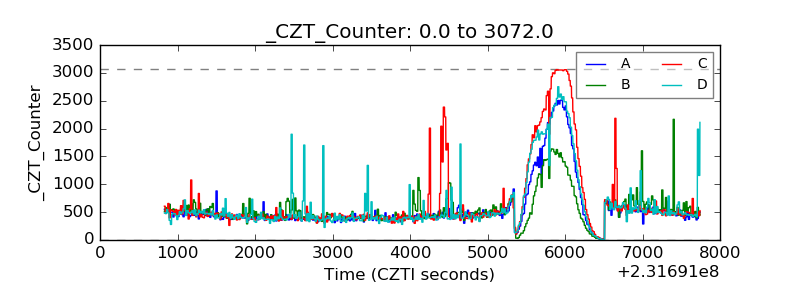 |
| +2.5 Volts monitor | 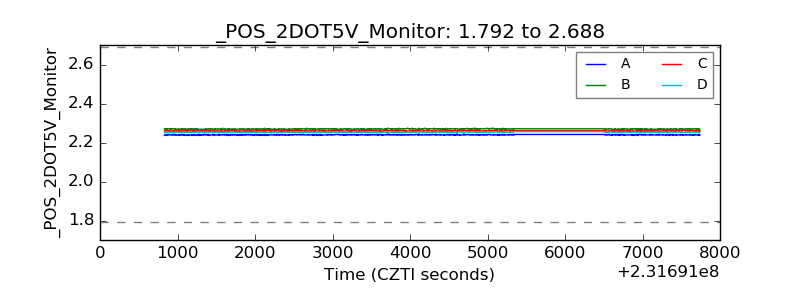 |
| +5 Volts monitor | 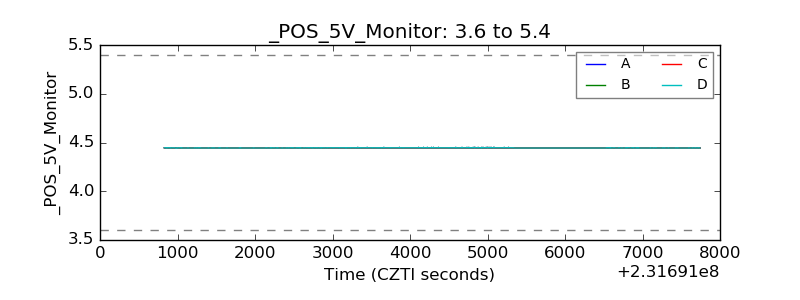 |
| _ROLL_ROT | 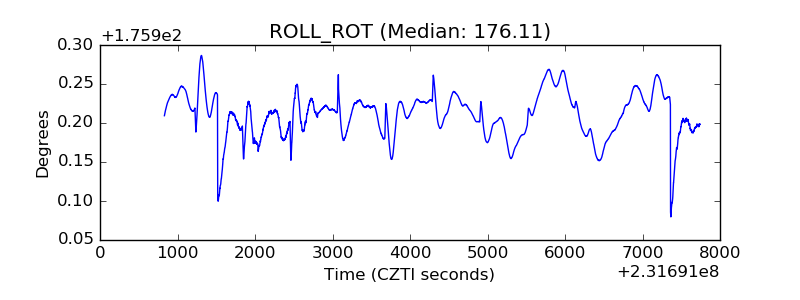 |
| _Roll_DEC | 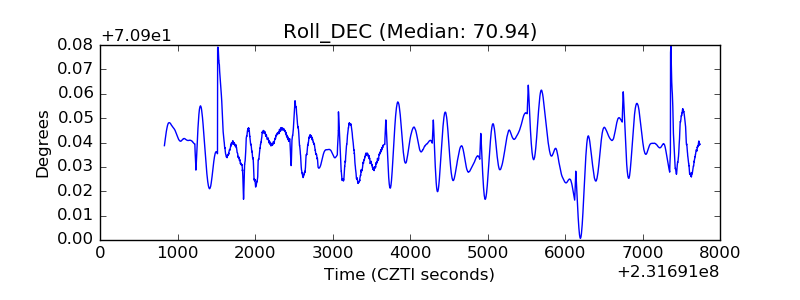 |
| _Roll_RA | 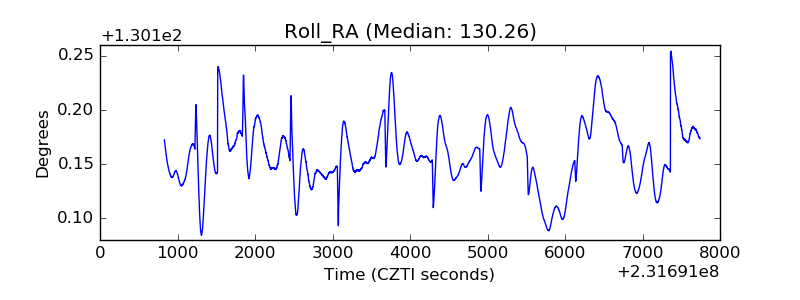 |
| Veto Counter | 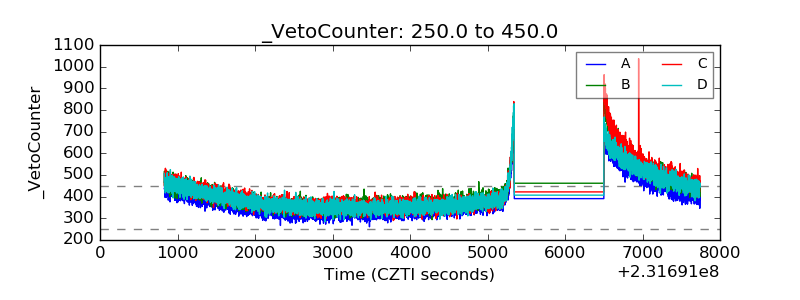 |