| Param | Original file | Final file |
|---|---|---|
| Filename | modeM0/AS1G07_024T01_9000001206_08669cztM0_level2.evt | modeM0/AS1G07_024T01_9000001206_08669cztM0_level2_quad_clean.evt |
| Size (bytes) | 412,925,760 | 124,361,280 |
| Size | 393.8 MB | 118.6 MB |
| Events in quadrant A | 2,936,484 | 822,227 |
| Events in quadrant B | 3,224,721 | 856,521 |
| Events in quadrant C | 2,909,469 | 852,697 |
| Events in quadrant D | 3,014,779 | 804,203 |
| Mode M0 | |||
|---|---|---|---|
| Quadrant | BADHDUFLAG | Total packets | Discarded packets |
| A | 0 | 12897 | 3 |
| B | 0 | 13702 | 2 |
| C | 0 | 12821 | 2 |
| D | 0 | 13261 | 2 |
| Mode M9 | |||
|---|---|---|---|
| Quadrant | BADHDUFLAG | Total packets | Discarded packets |
| A | 0 | 13 | 0 |
| B | 0 | 13 | 0 |
| C | 0 | 13 | 0 |
| D | 0 | 13 | 0 |
| Mode SS | |||
|---|---|---|---|
| Quadrant | BADHDUFLAG | Total packets | Discarded packets |
| A | 0 | 126 | 0 |
| B | 0 | 126 | 0 |
| C | 0 | 126 | 0 |
| D | 0 | 126 | 0 |
| Quadrant | Total seconds | Saturated seconds | Saturation percentage |
|---|---|---|---|
| A | 6174 | 18 | 0.291545% |
| B | 6174 | 39 | 0.631681% |
| C | 6174 | 14 | 0.226757% |
| D | 6174 | 37 | 0.599287% |
Noise dominated data is calculated using 1-second bins in cleaned event files. If a bin has >2000 counts, and if more than 50% of those come from <1% of pixels, then it is considered to be noise-dominated and hence unusable.
| Quadrant | # 1 sec bins | Bins with >0 counts | Bins with >2000 counts | High rate bins dominated by noise | Noise dominated (total time) | Noise dominated (detector-on time) | Marked lightcurve |
|---|---|---|---|---|---|---|---|
| A | 7514 | 6175 | 4 | 4 | 0.05% | 0.06% | 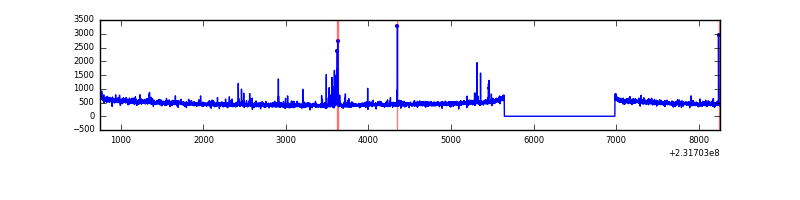 |
| B | 7514 | 6175 | 14 | 14 | 0.19% | 0.23% | 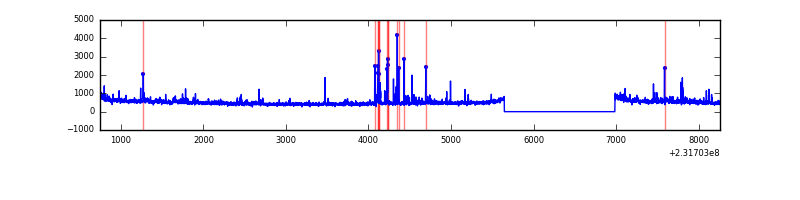 |
| C | 7514 | 6175 | 1 | 1 | 0.01% | 0.02% | 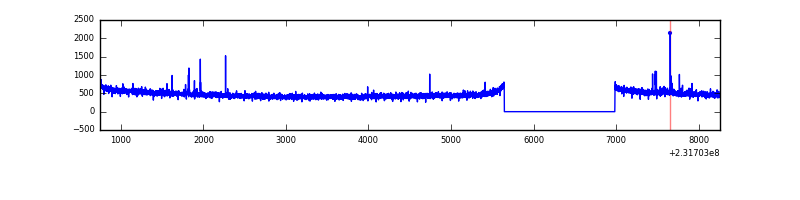 |
| D | 7514 | 6175 | 23 | 23 | 0.31% | 0.37% | 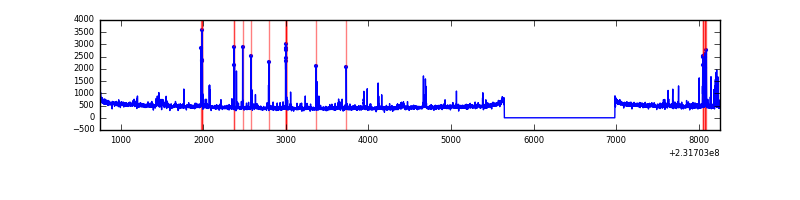 |
Top three noisy pixels from each quadrant. If the there are fewer than three noisy pixels in the level2.evt file, extra rows are filled as -1
| Pixel properties | Quadrant properties | ||||||
|---|---|---|---|---|---|---|---|
| Quadrant | DetID | PixID | Counts | Sigma | Mean | Median | Sigma |
| A | 13 | 248 | 42081 | 283.5 | 732 | 717 | 145.9 |
| A | 13 | 251 | 37445 | 251.73 | 732 | 717 | 145.9 |
| A | 15 | 174 | 27068 | 180.61 | 732 | 717 | 145.9 |
| B | 10 | 16 | 73933 | 536.65 | 748 | 732 | 136.4 |
| B | 10 | 252 | 49619 | 358.4 | 748 | 732 | 136.4 |
| B | 0 | 231 | 33732 | 241.93 | 748 | 732 | 136.4 |
| C | 1 | 16 | 26096 | 150.98 | 736 | 740 | 167.9 |
| C | 13 | 61 | 5557 | 28.68 | 736 | 740 | 167.9 |
| C | 8 | 128 | 3647 | 17.31 | 736 | 740 | 167.9 |
| D | 7 | 71 | 89349 | 509.68 | 725 | 703 | 173.9 |
| D | 2 | 152 | 62334 | 354.36 | 725 | 703 | 173.9 |
| D | 12 | 233 | 41112 | 232.34 | 725 | 703 | 173.9 |
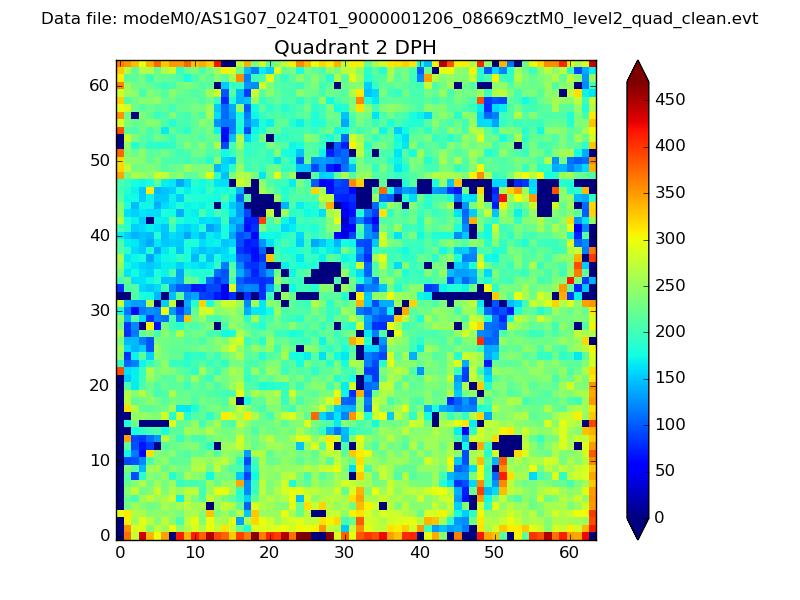
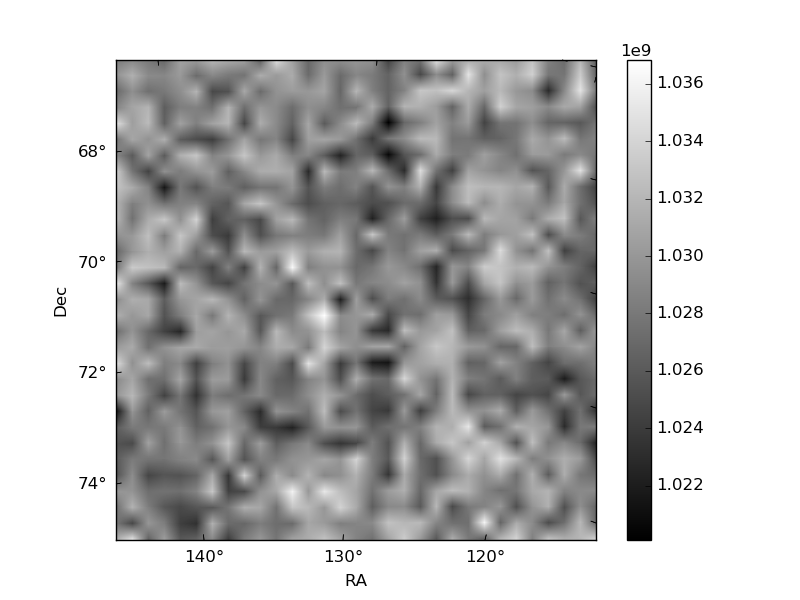
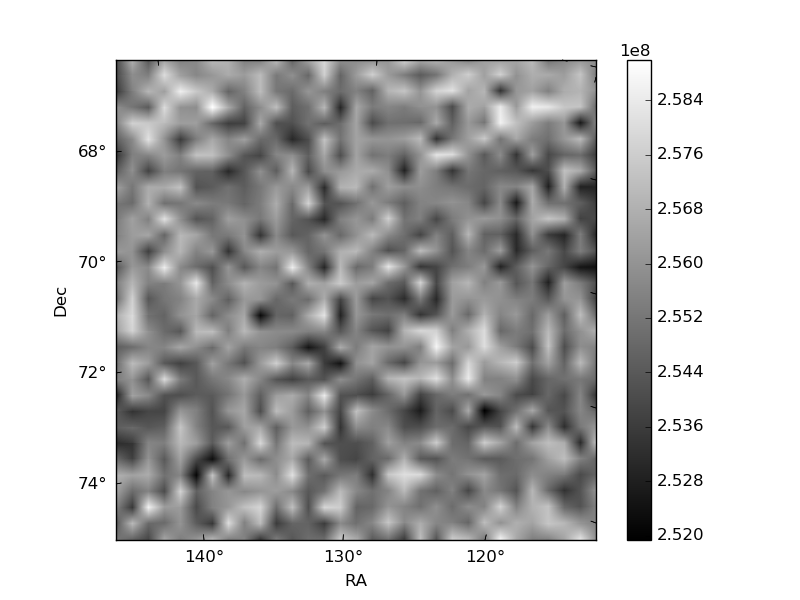
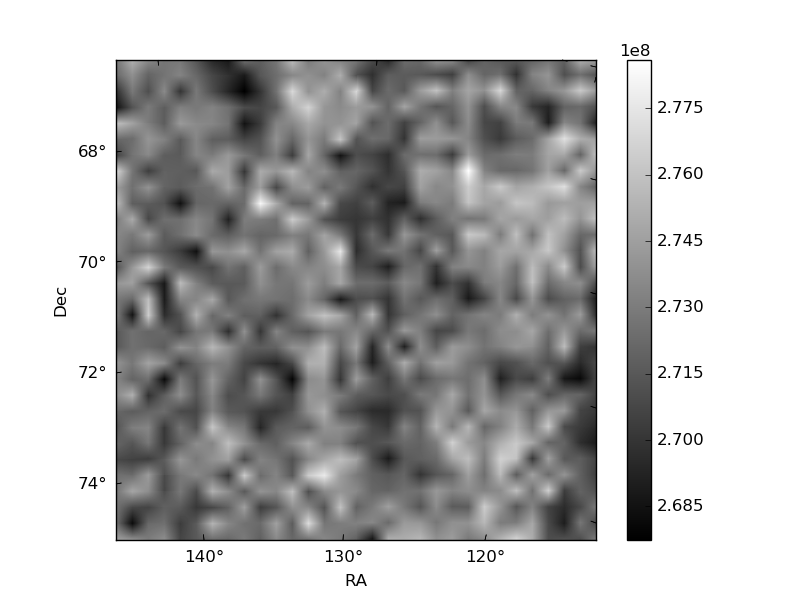
Histogram calculated using DETX and DETY for each event in the final _common_clean file
| Quadrant A | 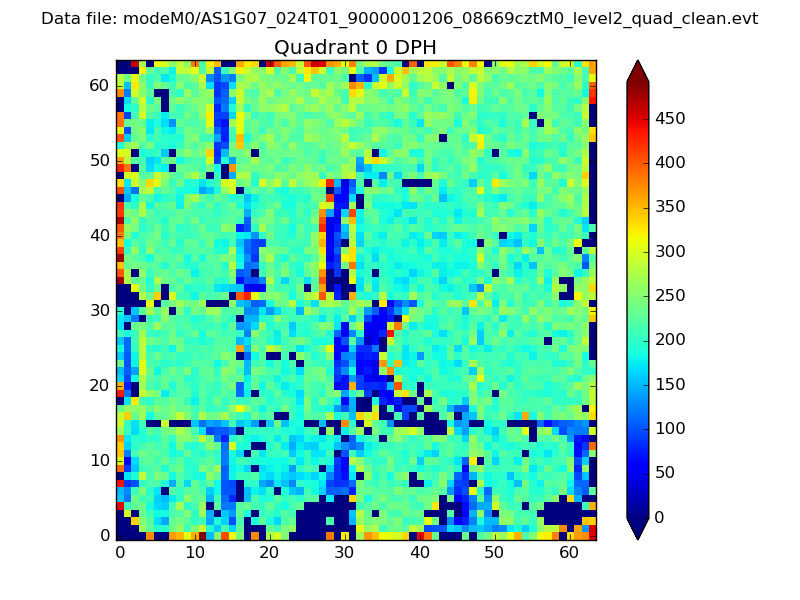 |
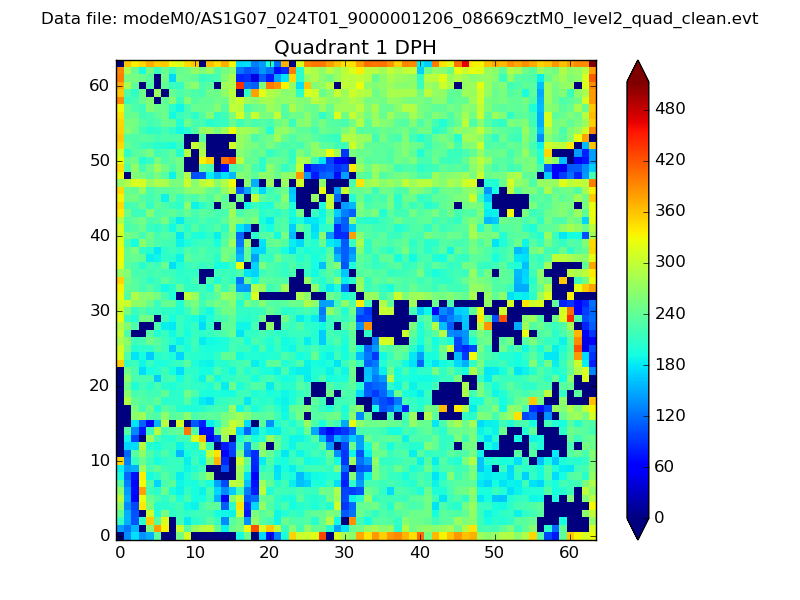 |
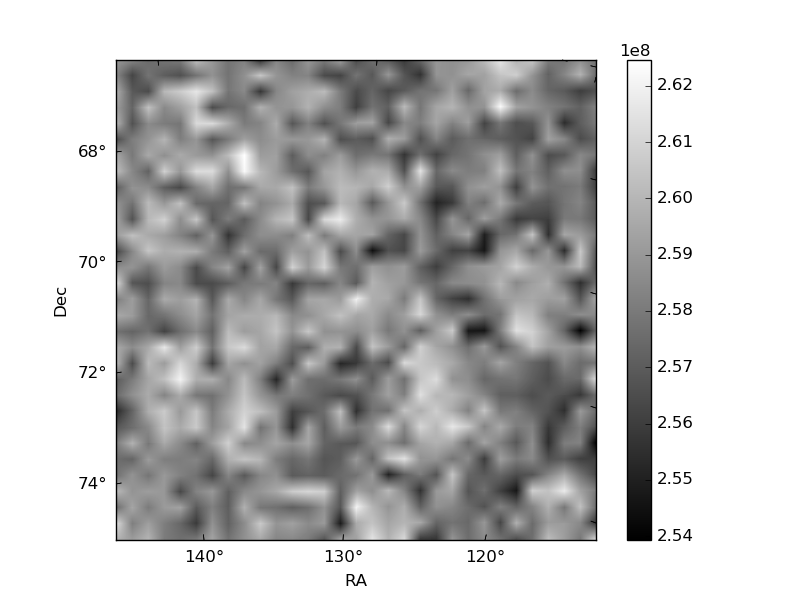
Quadrant B |
|---|---|---|---|
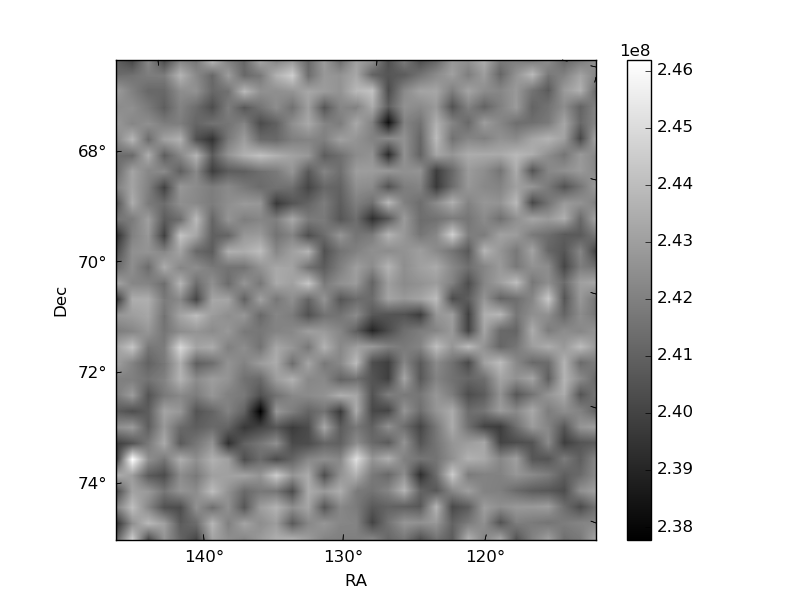
| Quadrant D | 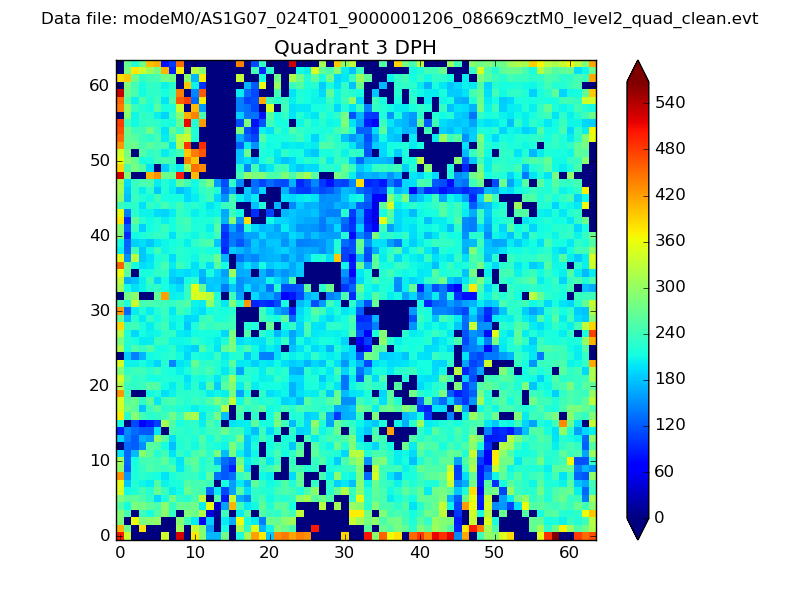 |
 |
Quadrant C |
| Plot type | Count rate plots | Images |
|---|---|---|
| Comparison with Poisson distribution Blue bars denote a histogram of data divided into 1 sec bins. Red curve is a Poisson curve with rate = median count rate of data. |
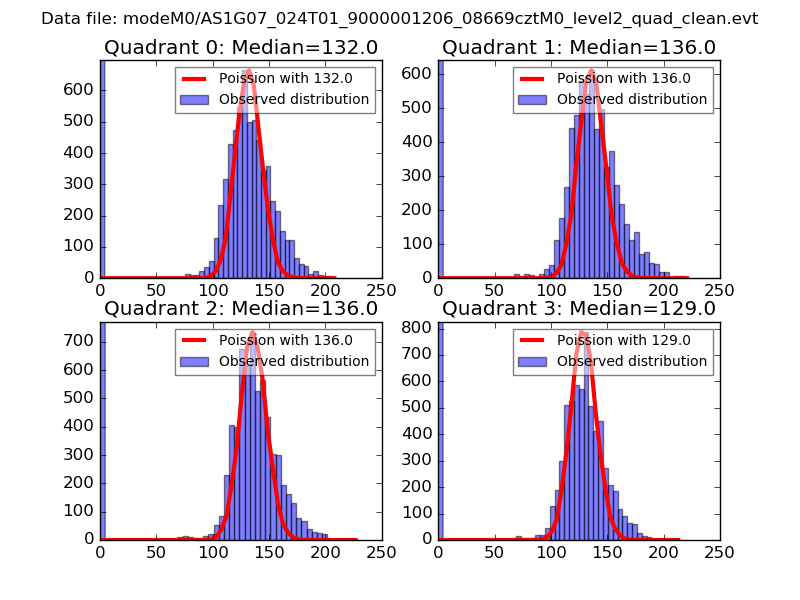 |
 |
| Quadrant-wise count rates Data is divided into 100 sec bins |
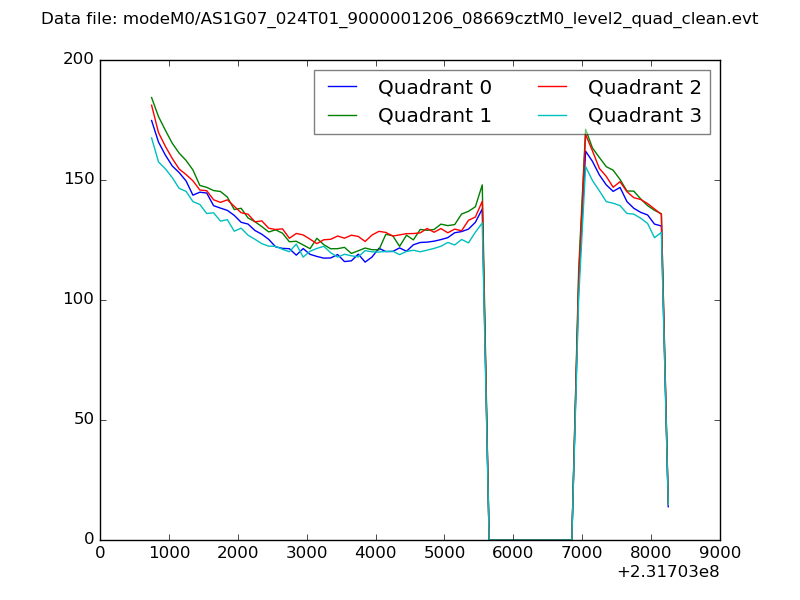 |
|
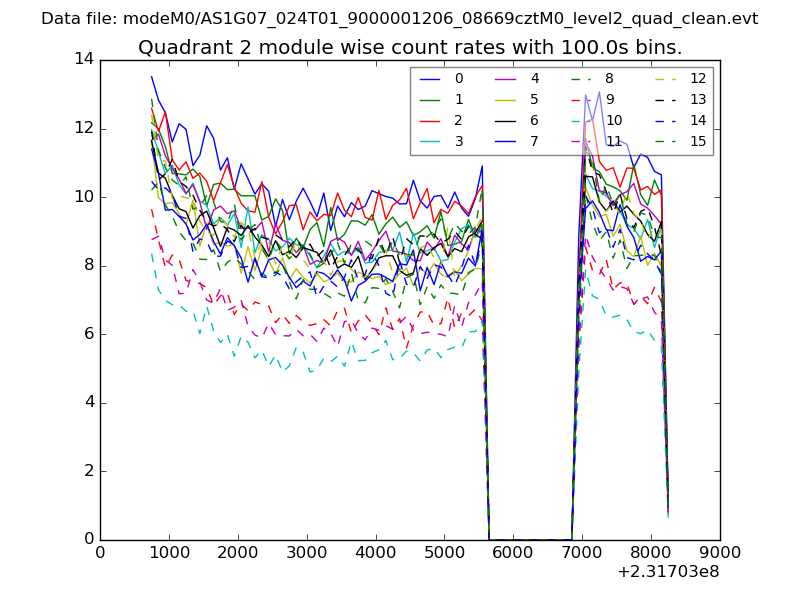
| Module-wise count rates for Quadrant A Data is divided into 100 sec bins |
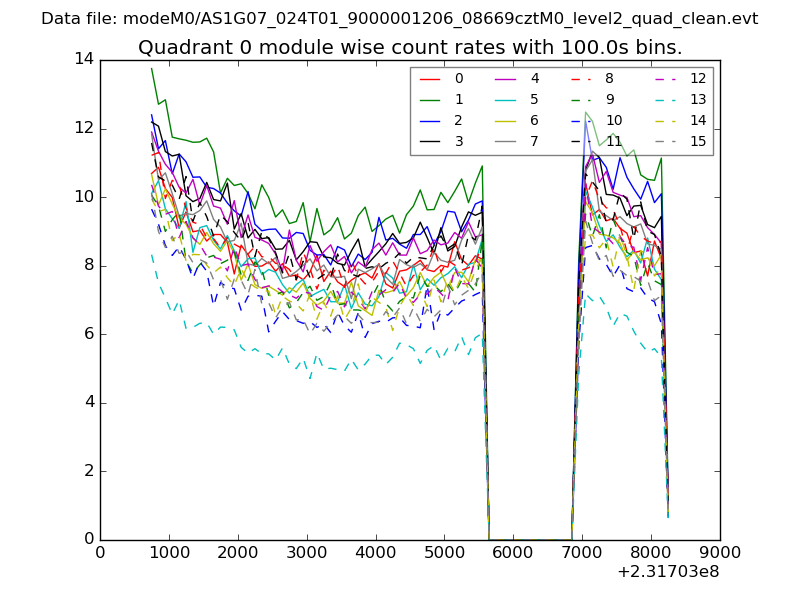 |
 |
| Module-wise count rates for Quadrant B Data is divided into 100 sec bins |
 |
 |
| Module-wise count rates for Quadrant C Data is divided into 100 sec bins |
 |
 |
| Module-wise count rates for Quadrant D Data is divided into 100 sec bins |
 |
 |
| Parameter | Plot |
|---|---|
| CZT HV Monitor | 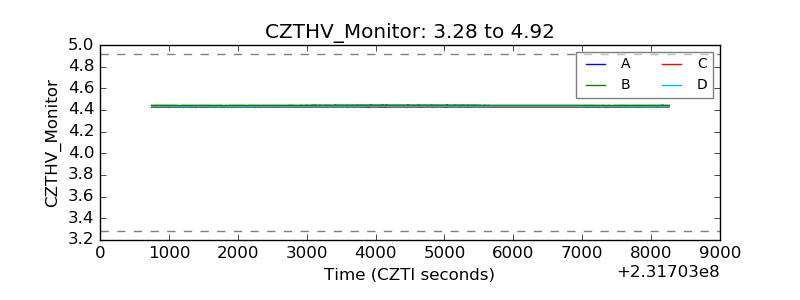 |
| D_VDD | 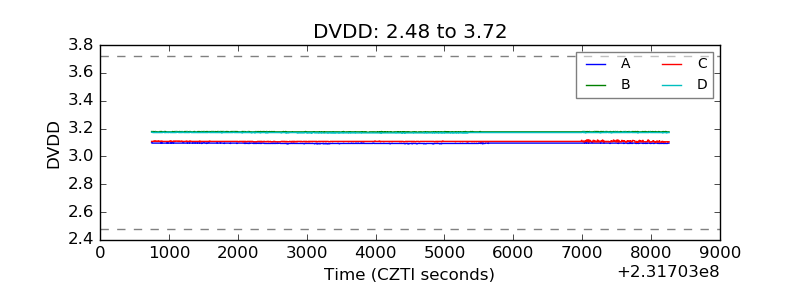 |
| Temperature 1 |  |
| Veto HV Monitor | 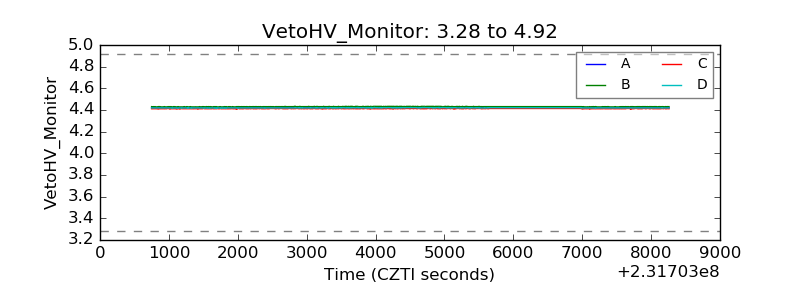 |
| Veto LLD | 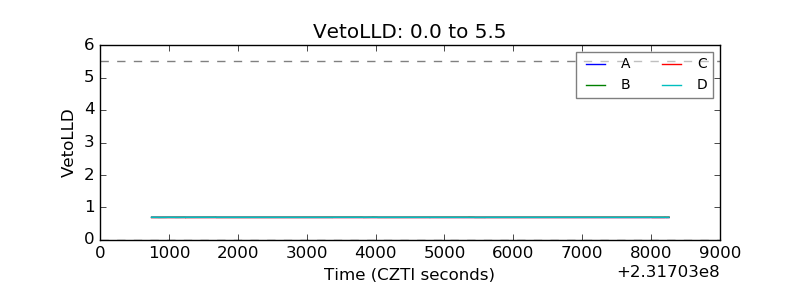 |
| Alpha Counter | 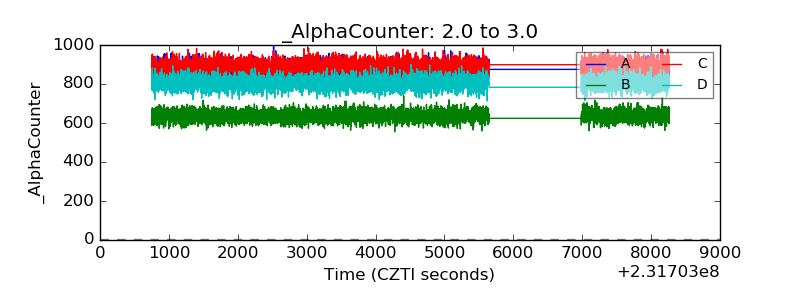 |
| _CPM_Rate | 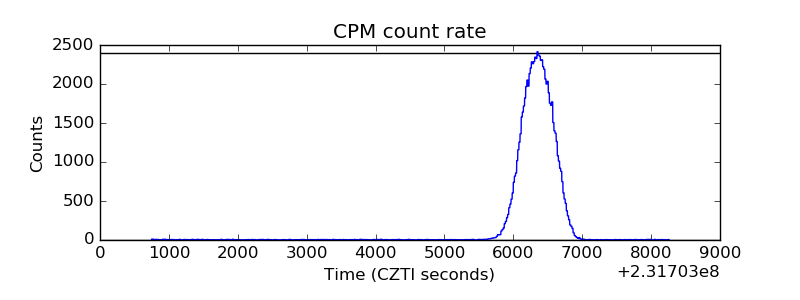 |
| CZT Counter | 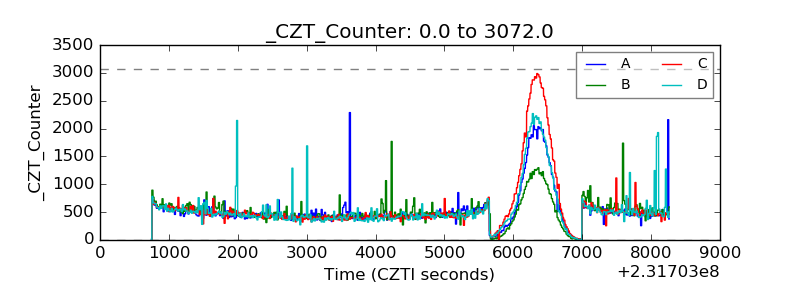 |
| +2.5 Volts monitor |  |
| +5 Volts monitor |  |
| _ROLL_ROT | 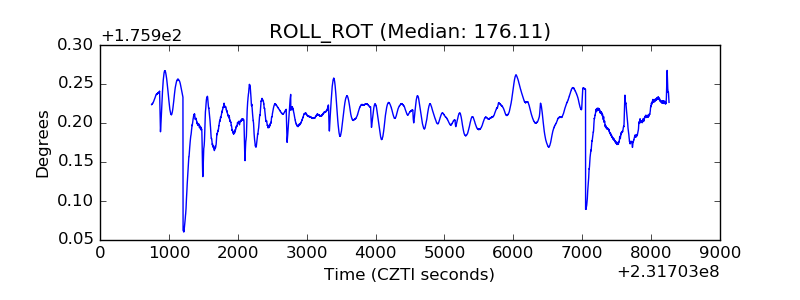 |
| _Roll_DEC |  |
| _Roll_RA | 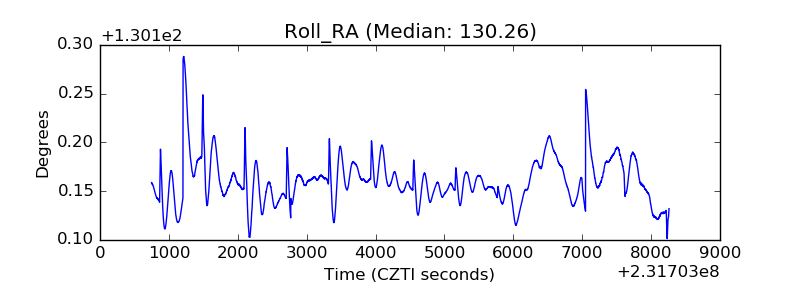 |
| Veto Counter |  |