| Param | Original file | Final file |
|---|---|---|
| Filename | modeM0/AS1G07_024T01_9000001206_08671cztM0_level2.evt | modeM0/AS1G07_024T01_9000001206_08671cztM0_level2_quad_clean.evt |
| Size (bytes) | 424,955,520 | 118,771,200 |
| Size | 405.3 MB | 113.3 MB |
| Events in quadrant A | 3,202,640 | 773,092 |
| Events in quadrant B | 3,203,352 | 812,606 |
| Events in quadrant C | 2,805,108 | 809,444 |
| Events in quadrant D | 3,230,887 | 763,264 |
| Mode M0 | |||
|---|---|---|---|
| Quadrant | BADHDUFLAG | Total packets | Discarded packets |
| A | 0 | 13912 | 3 |
| B | 0 | 13916 | 2 |
| C | 0 | 12854 | 2 |
| D | 0 | 14217 | 2 |
| Mode M9 | |||
|---|---|---|---|
| Quadrant | BADHDUFLAG | Total packets | Discarded packets |
| A | 0 | 25 | 0 |
| B | 0 | 25 | 0 |
| C | 0 | 25 | 0 |
| D | 0 | 25 | 0 |
| Mode SS | |||
|---|---|---|---|
| Quadrant | BADHDUFLAG | Total packets | Discarded packets |
| A | 0 | 130 | 0 |
| B | 0 | 130 | 0 |
| C | 0 | 130 | 0 |
| D | 0 | 130 | 0 |
| Quadrant | Total seconds | Saturated seconds | Saturation percentage |
|---|---|---|---|
| A | 6288 | 146 | 2.321883% |
| B | 6288 | 90 | 1.431298% |
| C | 6288 | 38 | 0.604326% |
| D | 6288 | 109 | 1.733461% |
Noise dominated data is calculated using 1-second bins in cleaned event files. If a bin has >2000 counts, and if more than 50% of those come from <1% of pixels, then it is considered to be noise-dominated and hence unusable.
| Quadrant | # 1 sec bins | Bins with >0 counts | Bins with >2000 counts | High rate bins dominated by noise | Noise dominated (total time) | Noise dominated (detector-on time) | Marked lightcurve |
|---|---|---|---|---|---|---|---|
| A | 8793 | 6289 | 107 | 107 | 1.22% | 1.70% | 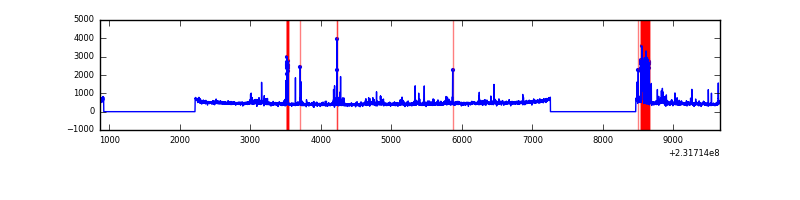 |
| B | 8793 | 6289 | 27 | 27 | 0.31% | 0.43% | 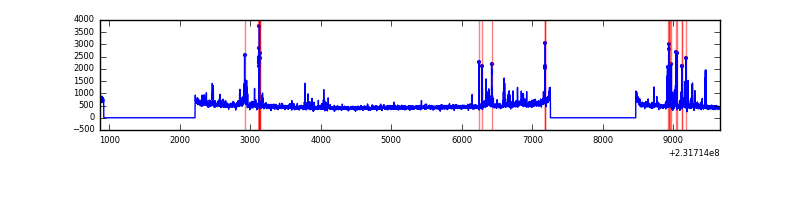 |
| C | 8793 | 6290 | 0 | 0 | 0.00% | 0.00% | 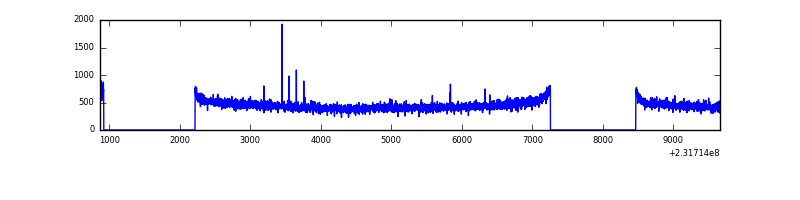 |
| D | 8793 | 6289 | 72 | 72 | 0.82% | 1.14% | 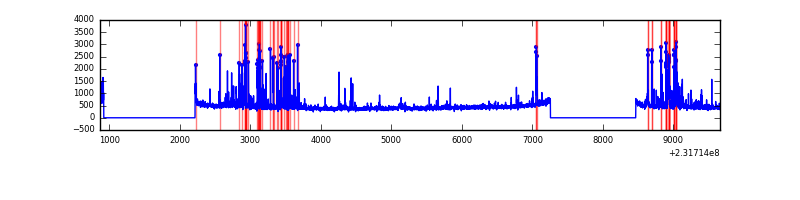 |
Top three noisy pixels from each quadrant. If the there are fewer than three noisy pixels in the level2.evt file, extra rows are filled as -1
| Pixel properties | Quadrant properties | ||||||
|---|---|---|---|---|---|---|---|
| Quadrant | DetID | PixID | Counts | Sigma | Mean | Median | Sigma |
| A | 0 | 254 | 285932 | 1979.15 | 709 | 692 | 144.1 |
| A | 13 | 251 | 127598 | 880.54 | 709 | 692 | 144.1 |
| A | 15 | 174 | 27474 | 185.83 | 709 | 692 | 144.1 |
| B | 0 | 231 | 105680 | 768.2 | 733 | 716 | 136.6 |
| B | 10 | 16 | 98969 | 719.08 | 733 | 716 | 136.6 |
| B | 4 | 80 | 41173 | 296.09 | 733 | 716 | 136.6 |
| C | 1 | 16 | 7877 | 43.8 | 715 | 718 | 163.4 |
| C | 13 | 61 | 5495 | 29.23 | 715 | 718 | 163.4 |
| C | 12 | 4 | 3921 | 19.6 | 715 | 718 | 163.4 |
| D | 2 | 152 | 205886 | 1203.54 | 701 | 678 | 170.5 |
| D | 12 | 233 | 201163 | 1175.84 | 701 | 678 | 170.5 |
| D | 2 | 14 | 35801 | 205.99 | 701 | 678 | 170.5 |
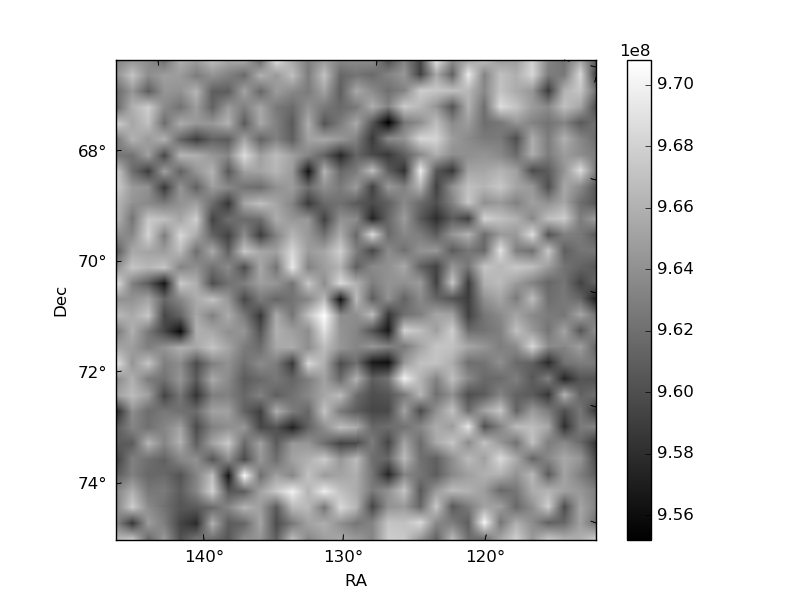
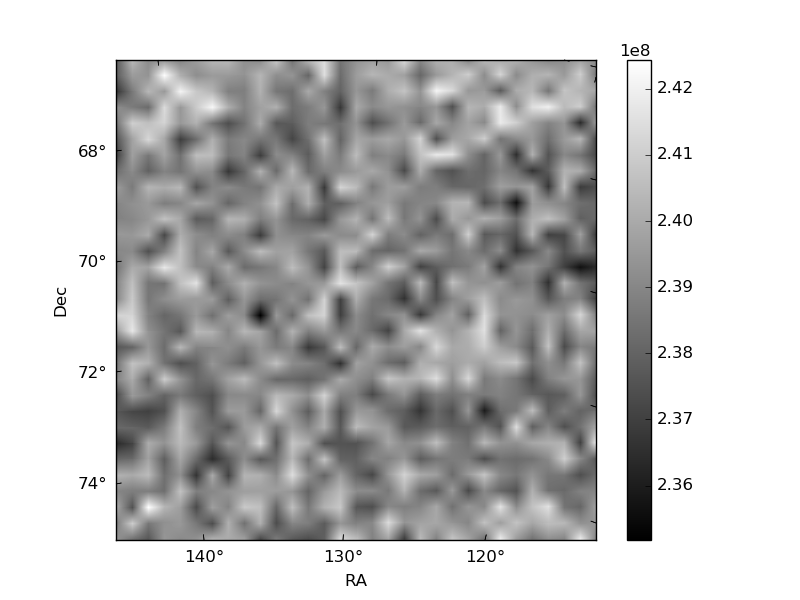
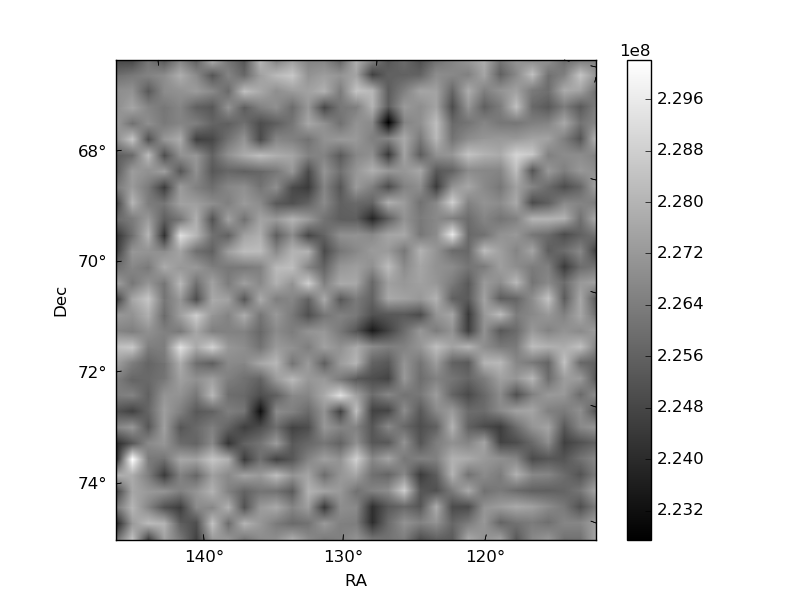
Histogram calculated using DETX and DETY for each event in the final _common_clean file
| Quadrant A | 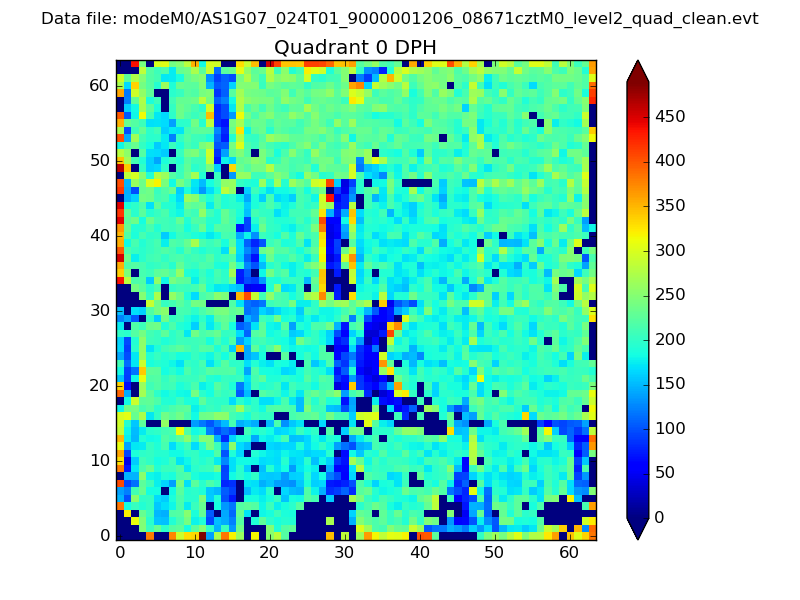 |
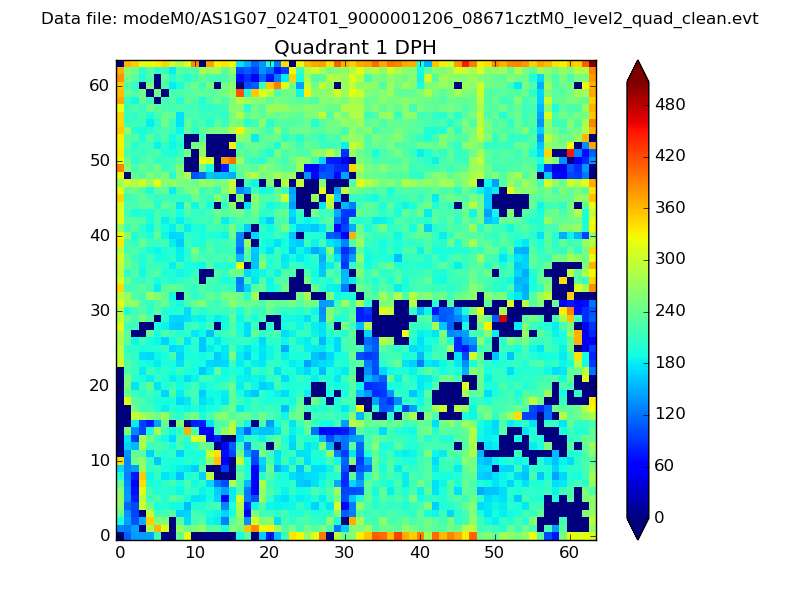 |
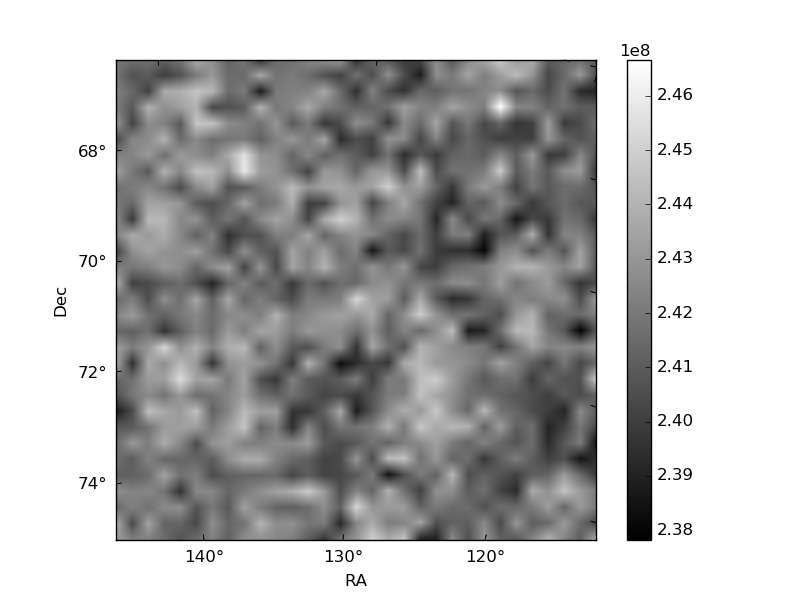
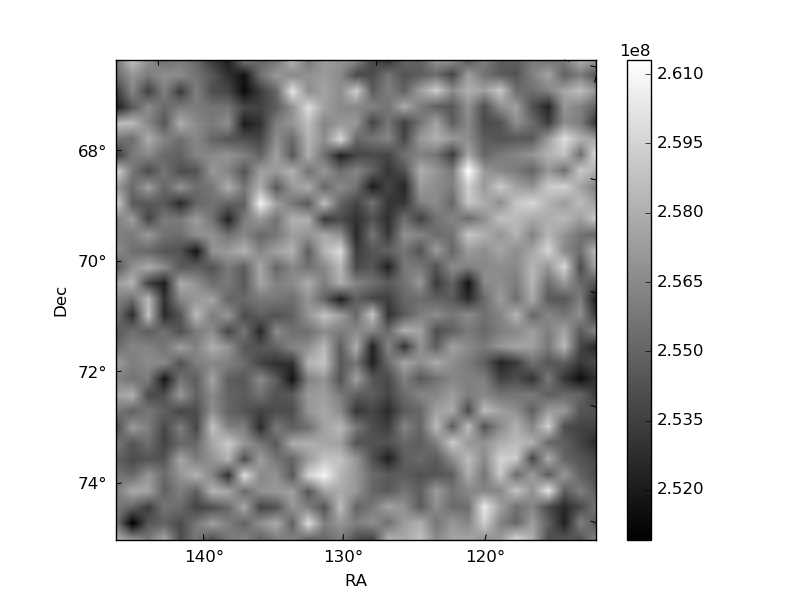
Quadrant B |
|---|---|---|---|
| Quadrant D | 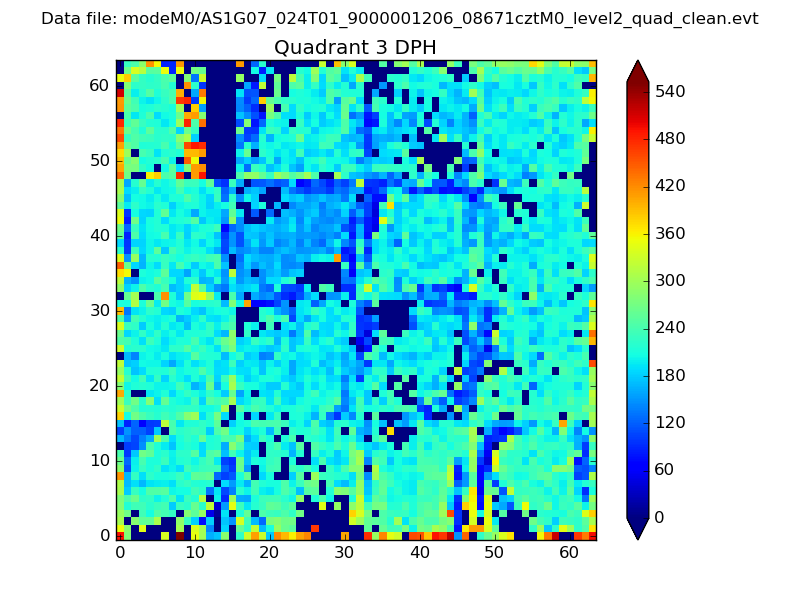 |
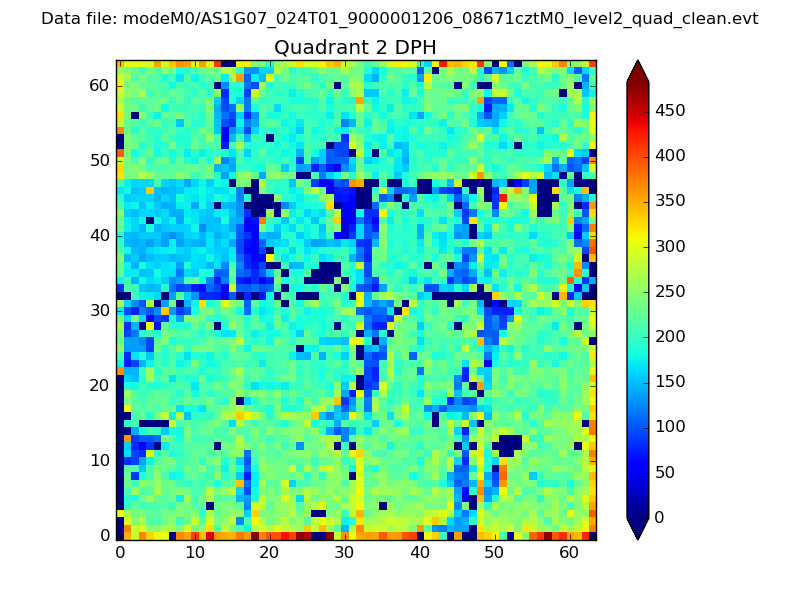 |
Quadrant C |
| Plot type | Count rate plots | Images |
|---|---|---|
| Comparison with Poisson distribution Blue bars denote a histogram of data divided into 1 sec bins. Red curve is a Poisson curve with rate = median count rate of data. |
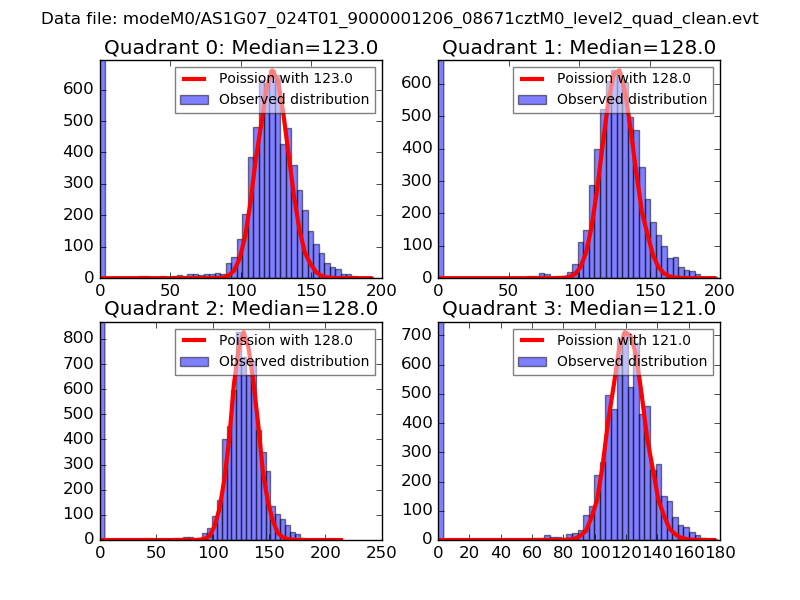 |
 |
| Quadrant-wise count rates Data is divided into 100 sec bins |
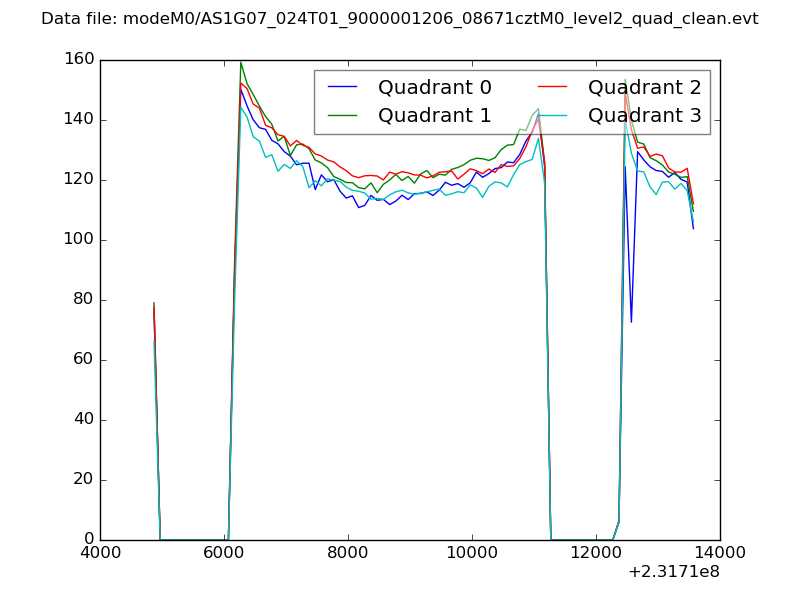 |
|
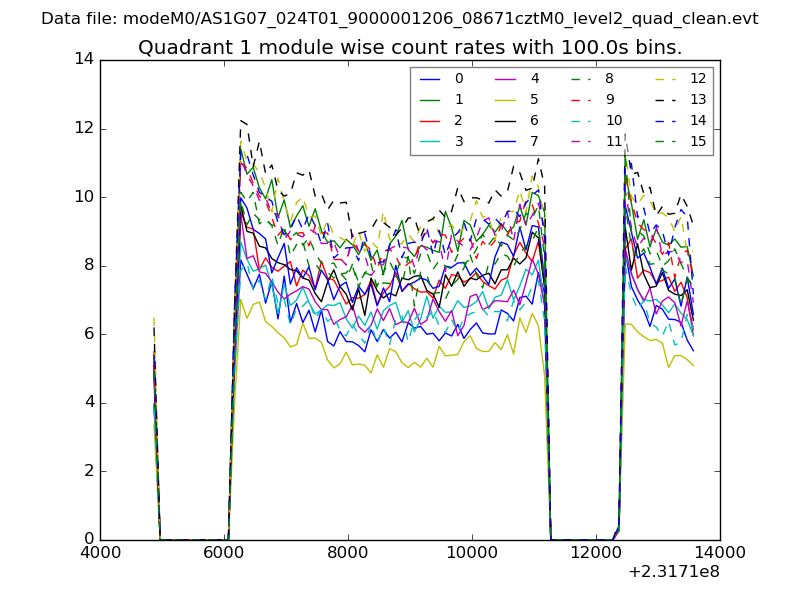
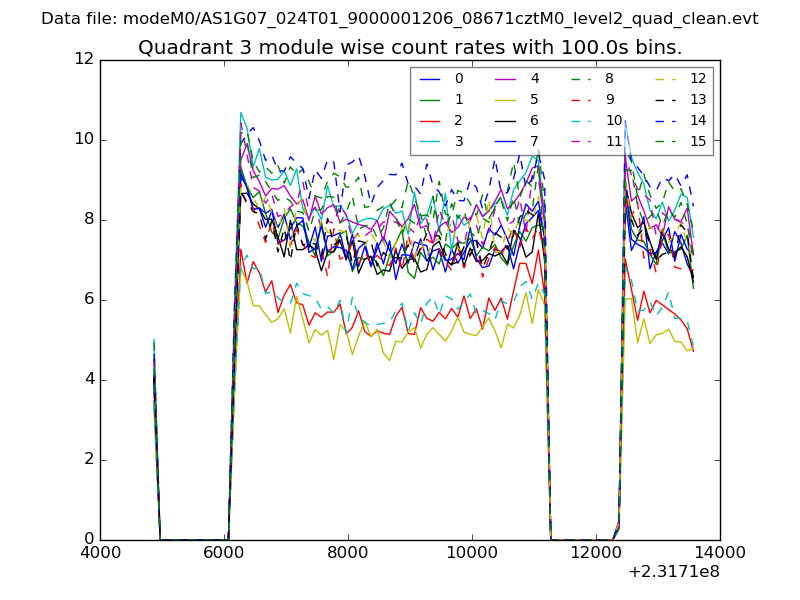
| Module-wise count rates for Quadrant A Data is divided into 100 sec bins |
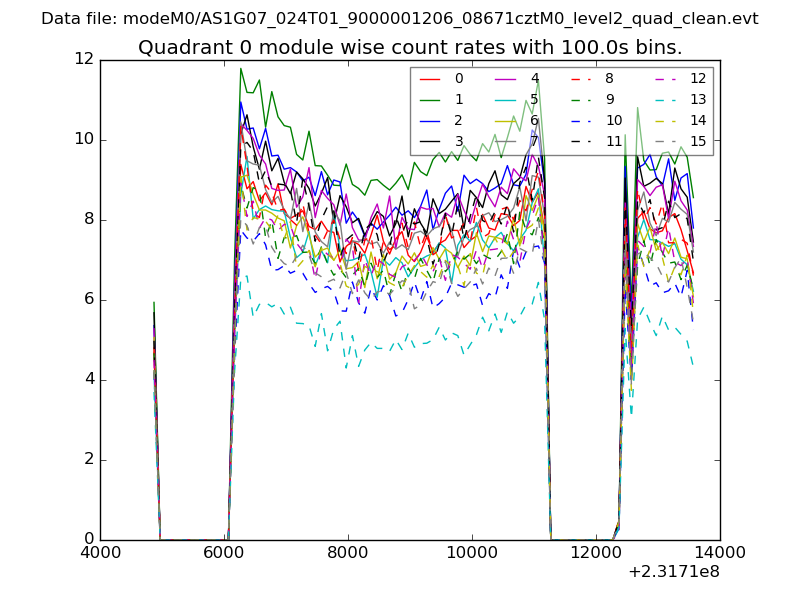 |
 |
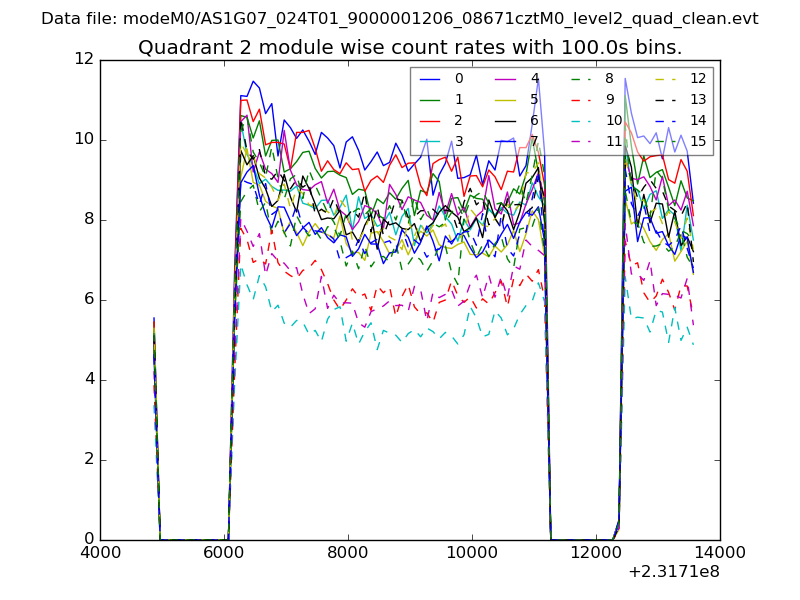
| Module-wise count rates for Quadrant B Data is divided into 100 sec bins |
 |
 |
| Module-wise count rates for Quadrant C Data is divided into 100 sec bins |
 |
 |
| Module-wise count rates for Quadrant D Data is divided into 100 sec bins |
 |
 |
| Parameter | Plot |
|---|---|
| CZT HV Monitor | 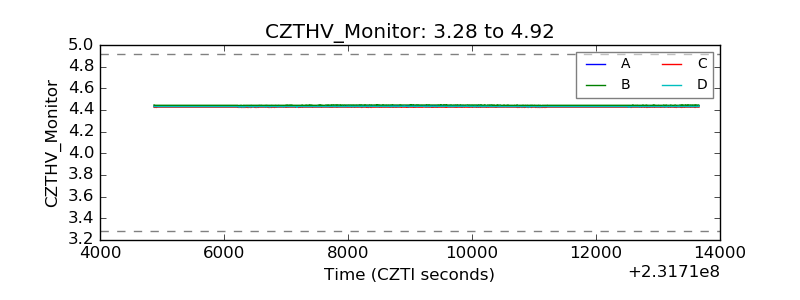 |
| D_VDD | 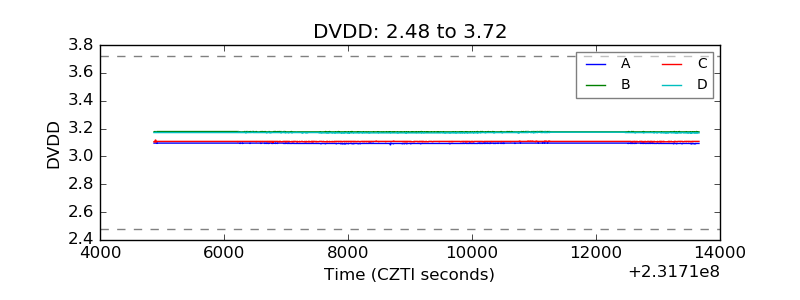 |
| Temperature 1 | 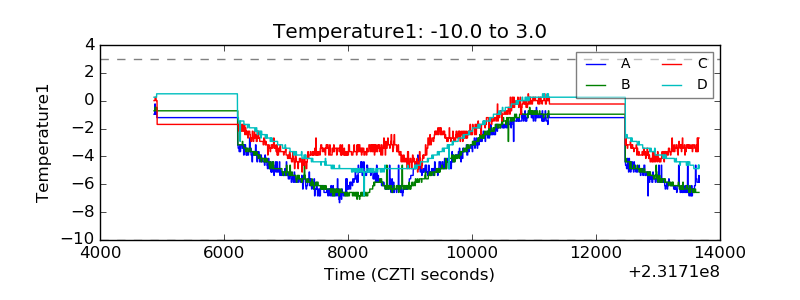 |
| Veto HV Monitor | 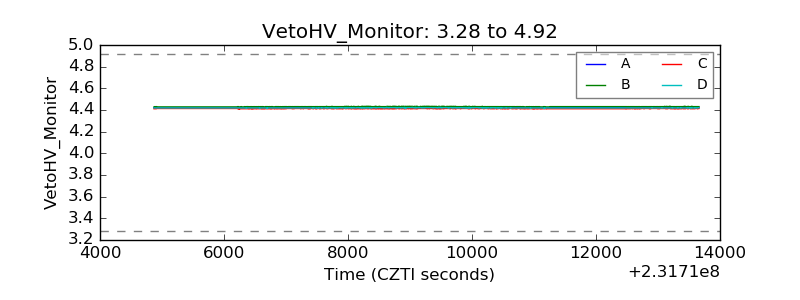 |
| Veto LLD | 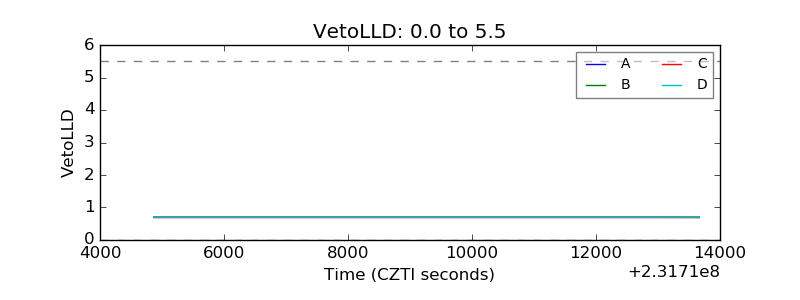 |
| Alpha Counter | 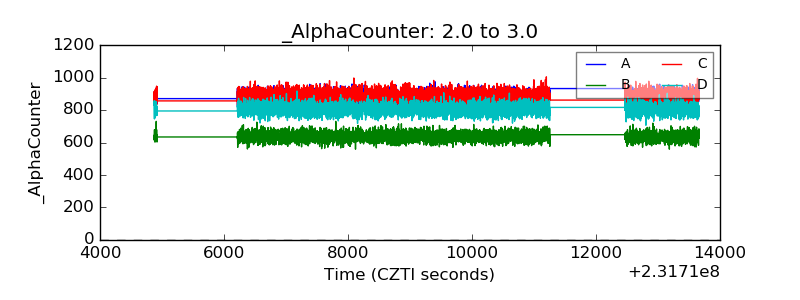 |
| _CPM_Rate | 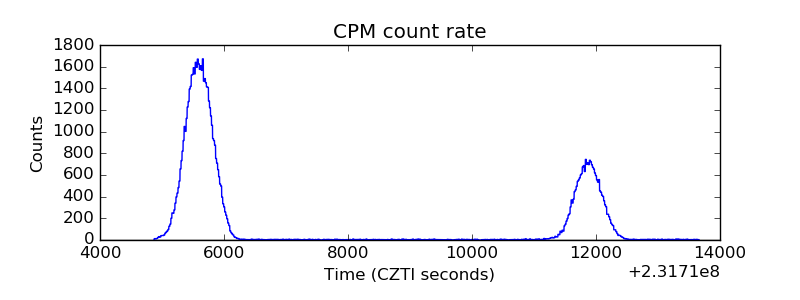 |
| CZT Counter | 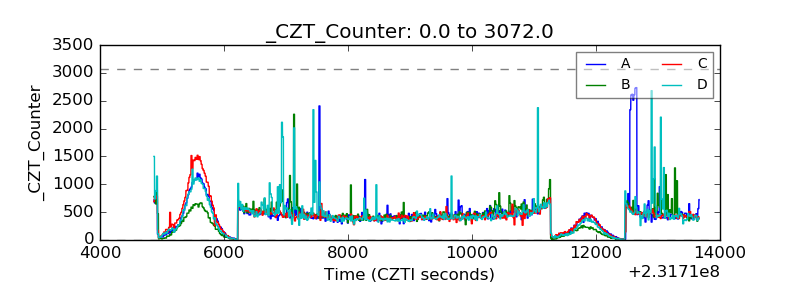 |
| +2.5 Volts monitor | 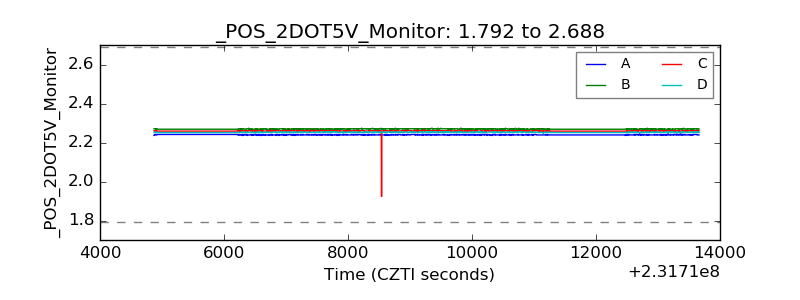 |
| +5 Volts monitor | 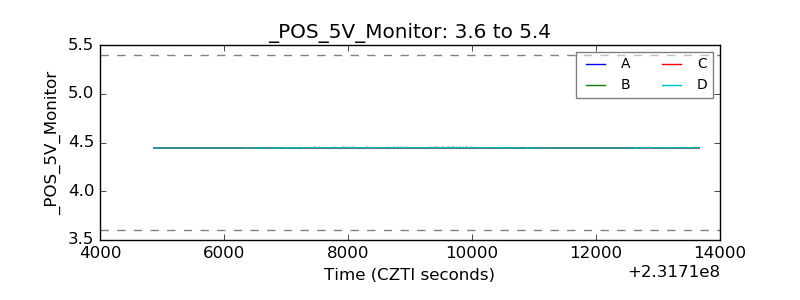 |
| _ROLL_ROT | 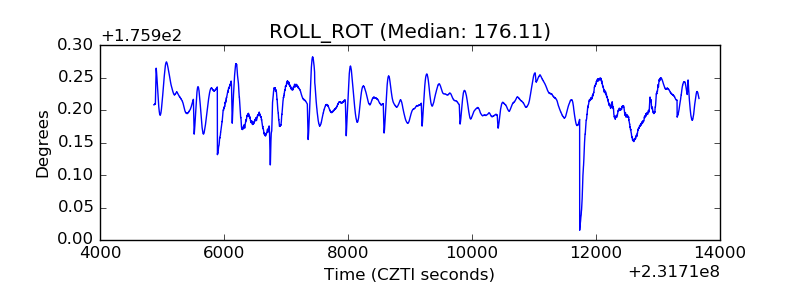 |
| _Roll_DEC | 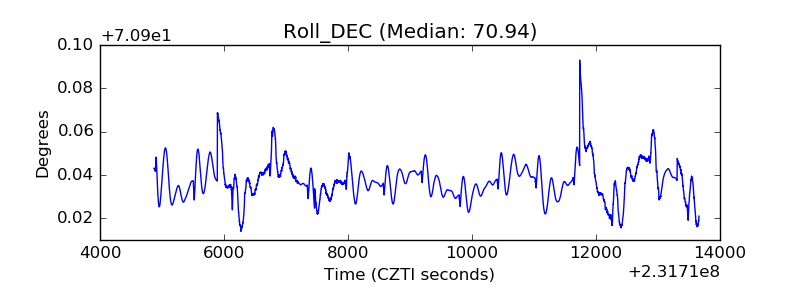 |
| _Roll_RA | 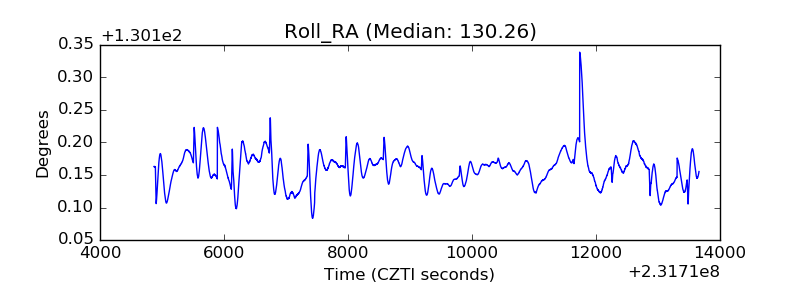 |
| Veto Counter | 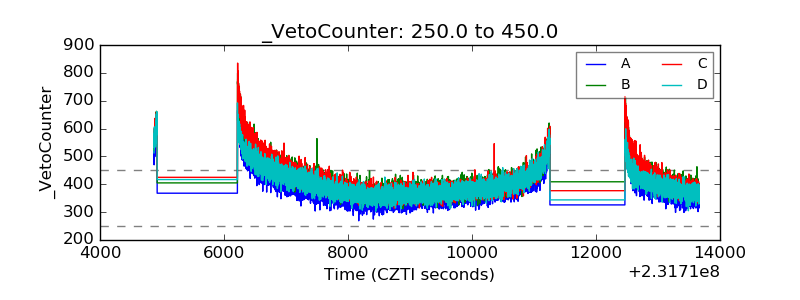 |