| Param | Original file | Final file |
|---|---|---|
| Filename | modeM0/AS1G07_024T01_9000001206_08672cztM0_level2.evt | modeM0/AS1G07_024T01_9000001206_08672cztM0_level2_quad_clean.evt |
| Size (bytes) | 483,048,000 | 131,751,360 |
| Size | 460.7 MB | 125.6 MB |
| Events in quadrant A | 3,540,398 | 859,612 |
| Events in quadrant B | 3,663,813 | 893,763 |
| Events in quadrant C | 3,174,531 | 891,466 |
| Events in quadrant D | 3,757,407 | 840,721 |
| Mode M0 | |||
|---|---|---|---|
| Quadrant | BADHDUFLAG | Total packets | Discarded packets |
| A | 0 | 15838 | 3 |
| B | 0 | 16090 | 2 |
| C | 0 | 14839 | 2 |
| D | 0 | 16530 | 2 |
| Mode M9 | |||
|---|---|---|---|
| Quadrant | BADHDUFLAG | Total packets | Discarded packets |
| A | 0 | 20 | 0 |
| B | 0 | 20 | 0 |
| C | 0 | 20 | 0 |
| D | 0 | 20 | 0 |
| Mode SS | |||
|---|---|---|---|
| Quadrant | BADHDUFLAG | Total packets | Discarded packets |
| A | 0 | 152 | 0 |
| B | 0 | 152 | 0 |
| C | 0 | 152 | 0 |
| D | 0 | 152 | 0 |
| Quadrant | Total seconds | Saturated seconds | Saturation percentage |
|---|---|---|---|
| A | 7240 | 170 | 2.348066% |
| B | 7240 | 142 | 1.961326% |
| C | 7240 | 30 | 0.414365% |
| D | 7240 | 117 | 1.616022% |
Noise dominated data is calculated using 1-second bins in cleaned event files. If a bin has >2000 counts, and if more than 50% of those come from <1% of pixels, then it is considered to be noise-dominated and hence unusable.
| Quadrant | # 1 sec bins | Bins with >0 counts | Bins with >2000 counts | High rate bins dominated by noise | Noise dominated (total time) | Noise dominated (detector-on time) | Marked lightcurve |
|---|---|---|---|---|---|---|---|
| A | 9320 | 7240 | 106 | 106 | 1.14% | 1.46% | 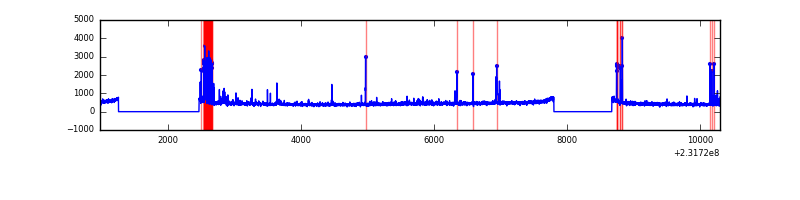 |
| B | 9320 | 7240 | 39 | 39 | 0.42% | 0.54% | 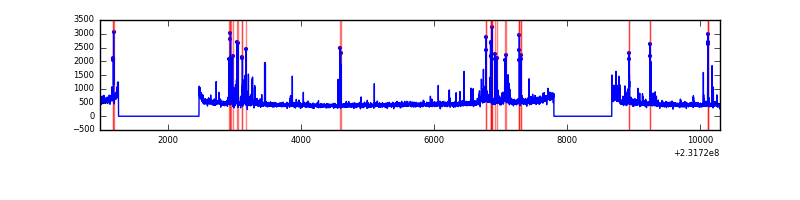 |
| C | 9320 | 7242 | 0 | 0 | 0.00% | 0.00% | 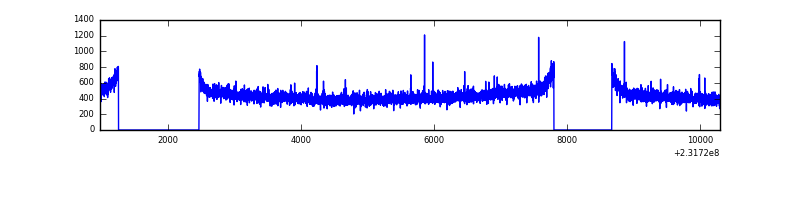 |
| D | 9320 | 7242 | 84 | 84 | 0.90% | 1.16% | 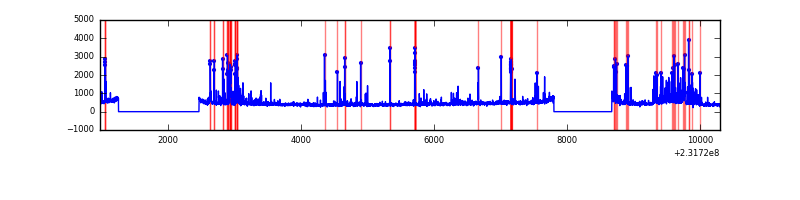 |
Top three noisy pixels from each quadrant. If the there are fewer than three noisy pixels in the level2.evt file, extra rows are filled as -1
| Pixel properties | Quadrant properties | ||||||
|---|---|---|---|---|---|---|---|
| Quadrant | DetID | PixID | Counts | Sigma | Mean | Median | Sigma |
| A | 0 | 254 | 251924 | 1514.62 | 808 | 789 | 165.8 |
| A | 15 | 174 | 80903 | 483.17 | 808 | 789 | 165.8 |
| A | 13 | 251 | 65421 | 389.8 | 808 | 789 | 165.8 |
| B | 10 | 16 | 302190 | 1932.95 | 831 | 808 | 155.9 |
| B | 0 | 219 | 23289 | 144.18 | 831 | 808 | 155.9 |
| B | 0 | 231 | 16930 | 103.4 | 831 | 808 | 155.9 |
| C | 1 | 16 | 7327 | 35.01 | 810 | 813 | 186.1 |
| C | 13 | 61 | 6153 | 28.7 | 810 | 813 | 186.1 |
| C | 8 | 222 | 3054 | 12.04 | 810 | 813 | 186.1 |
| D | 12 | 233 | 350192 | 1811.39 | 794 | 769 | 192.9 |
| D | 2 | 152 | 170490 | 879.82 | 794 | 769 | 192.9 |
| D | 7 | 71 | 75763 | 388.76 | 794 | 769 | 192.9 |
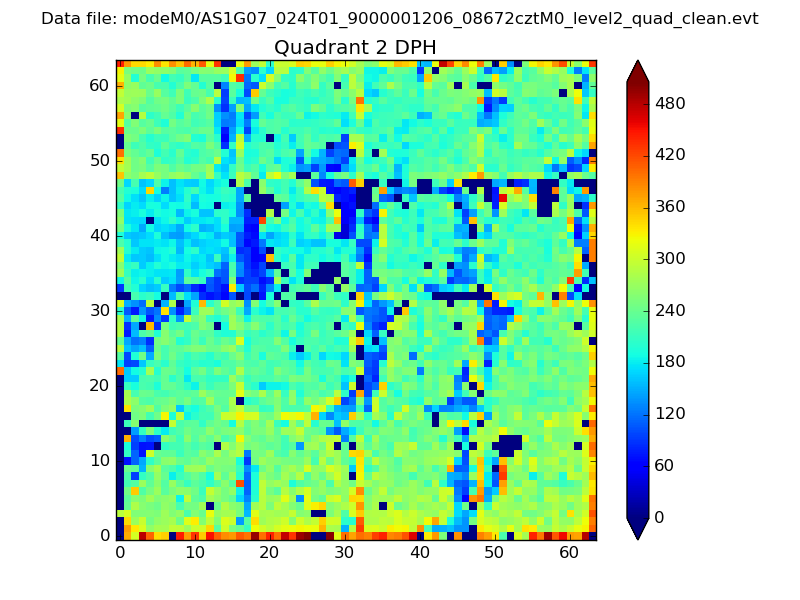
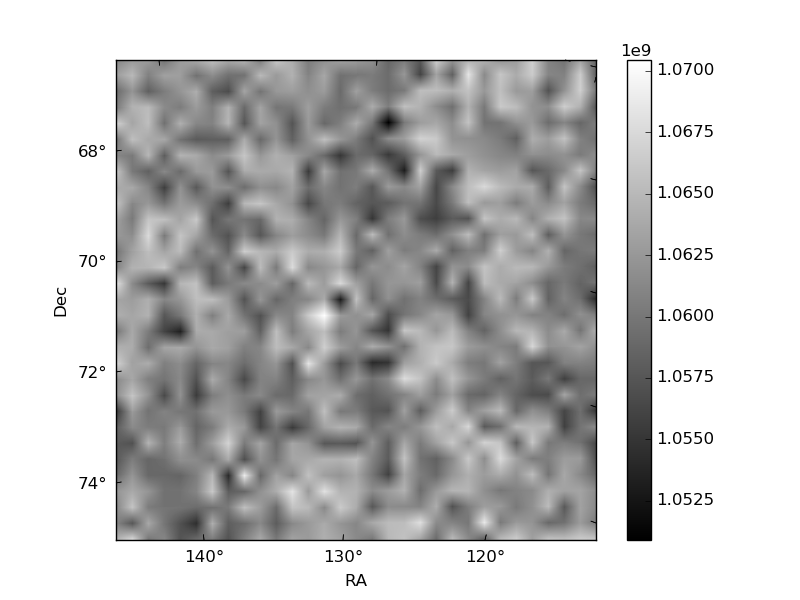
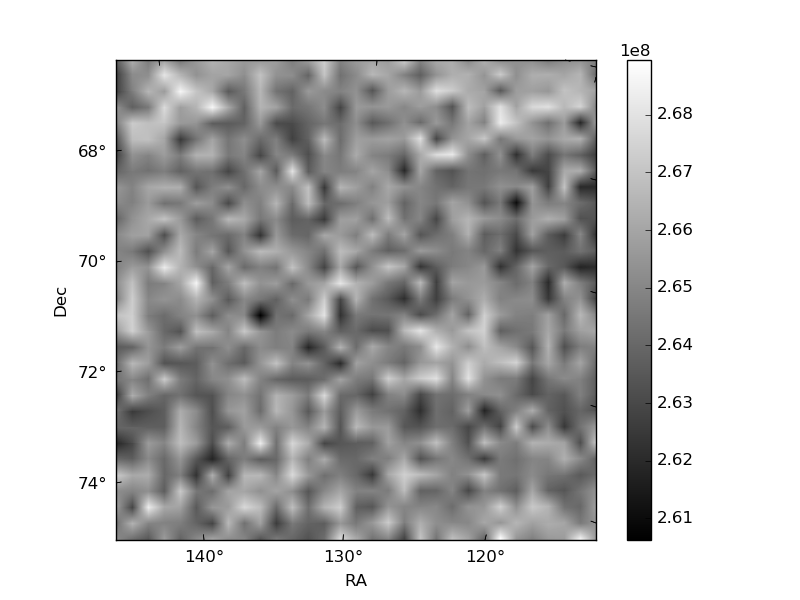
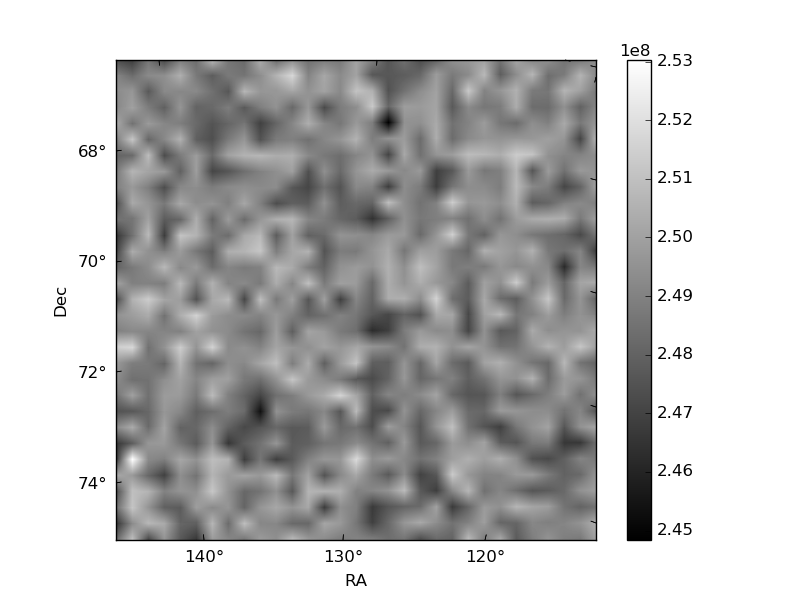
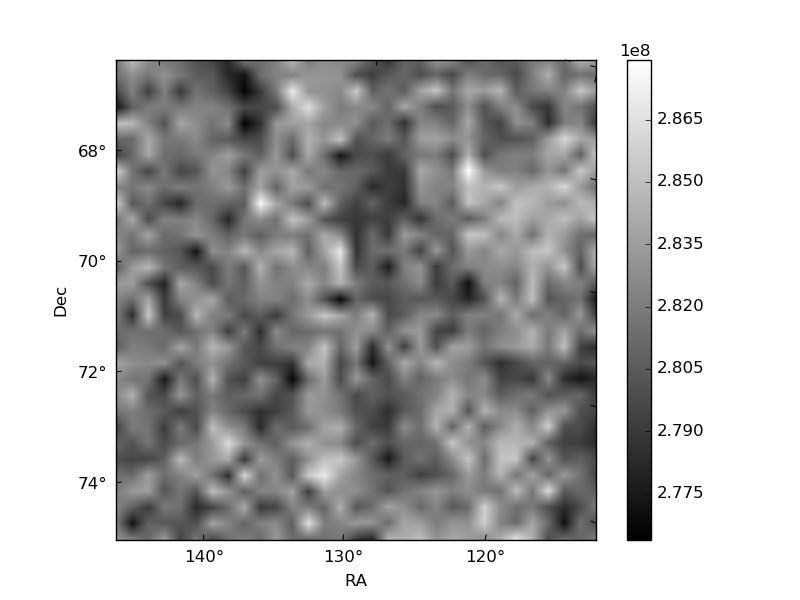
Histogram calculated using DETX and DETY for each event in the final _common_clean file
| Quadrant A | 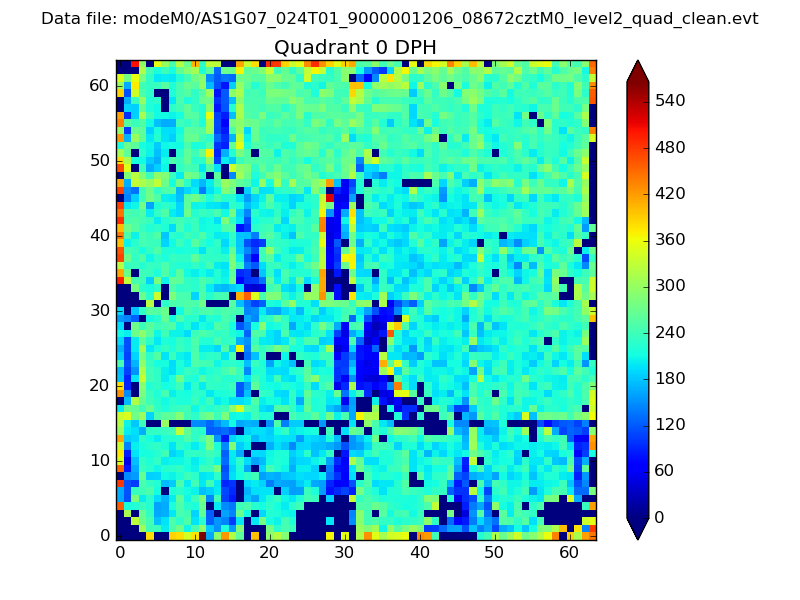 |
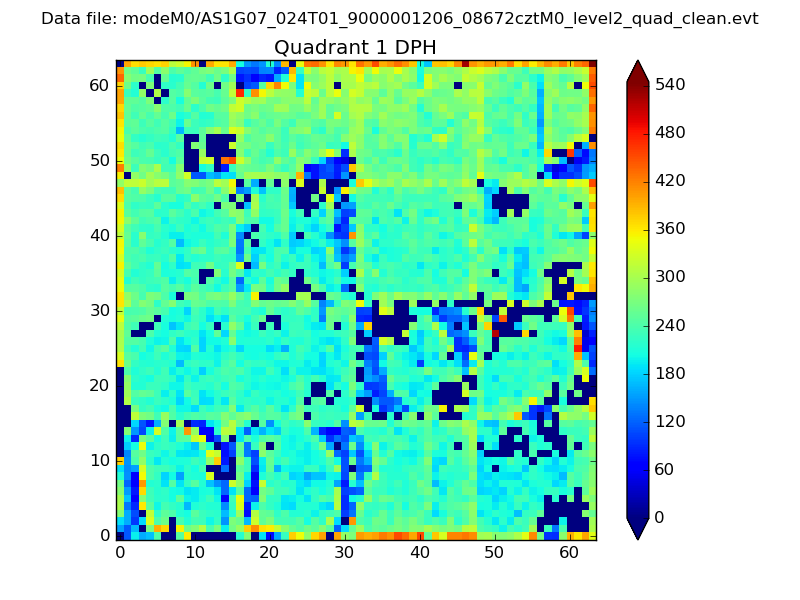 |
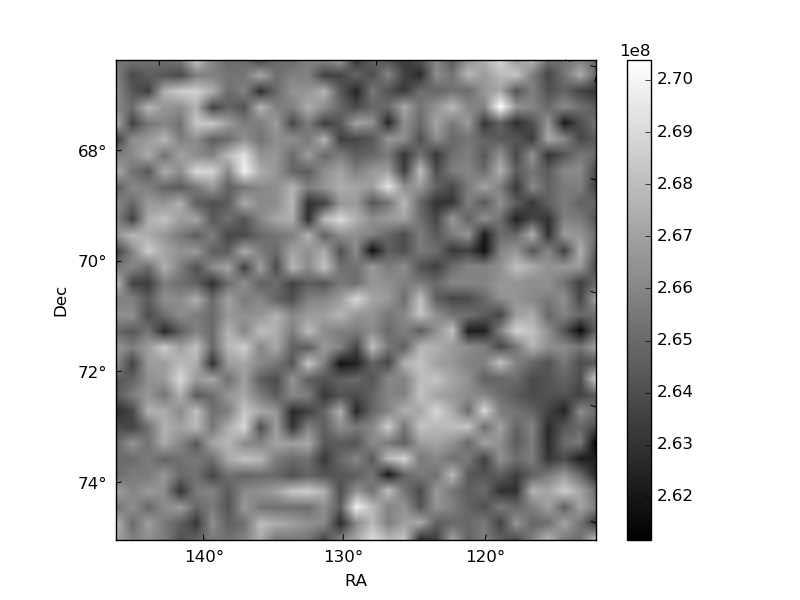
Quadrant B |
|---|---|---|---|
| Quadrant D | 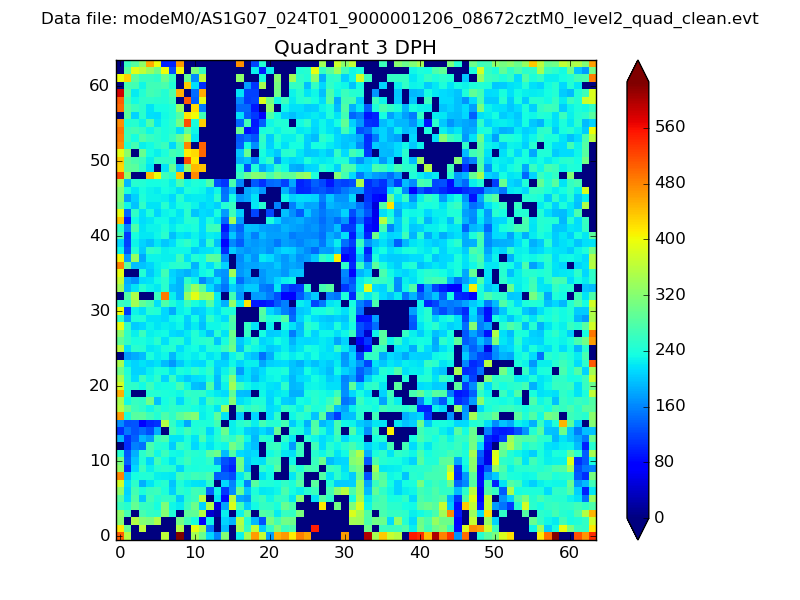 |
 |
Quadrant C |
| Plot type | Count rate plots | Images |
|---|---|---|
| Comparison with Poisson distribution Blue bars denote a histogram of data divided into 1 sec bins. Red curve is a Poisson curve with rate = median count rate of data. |
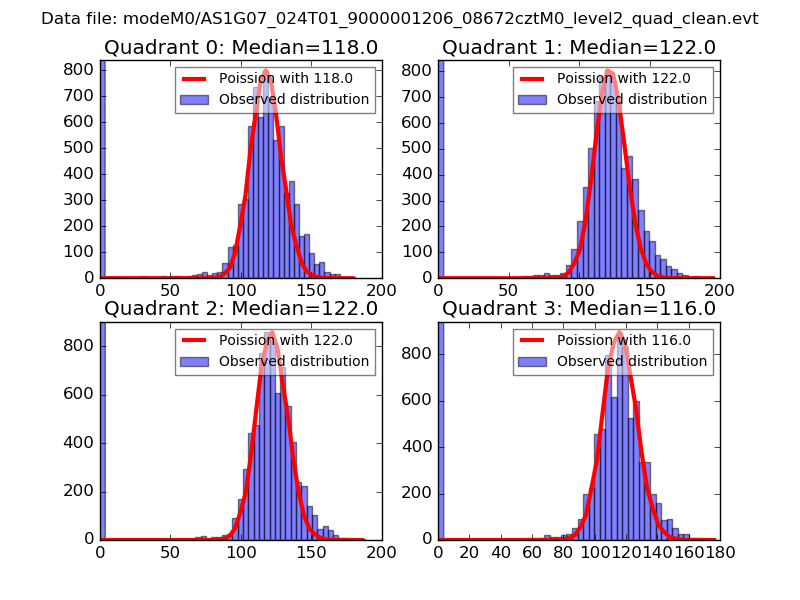 |
 |
| Quadrant-wise count rates Data is divided into 100 sec bins |
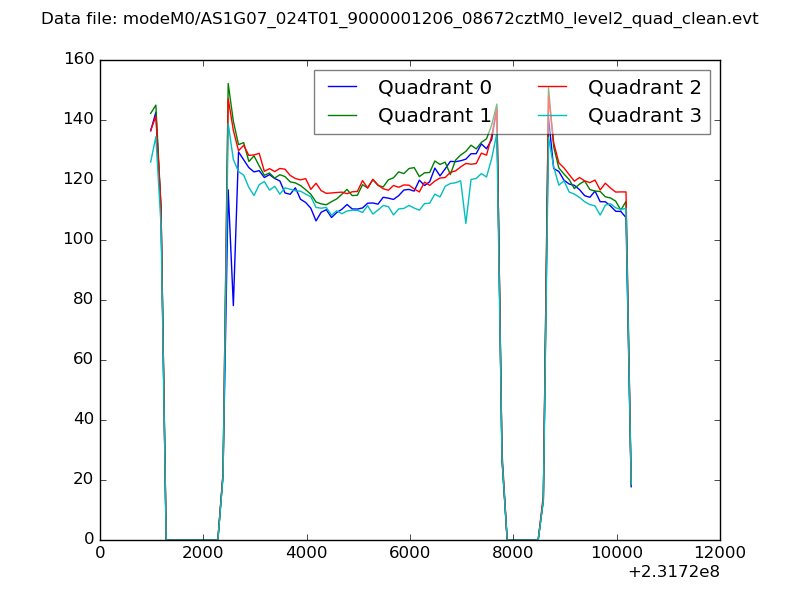 |
|
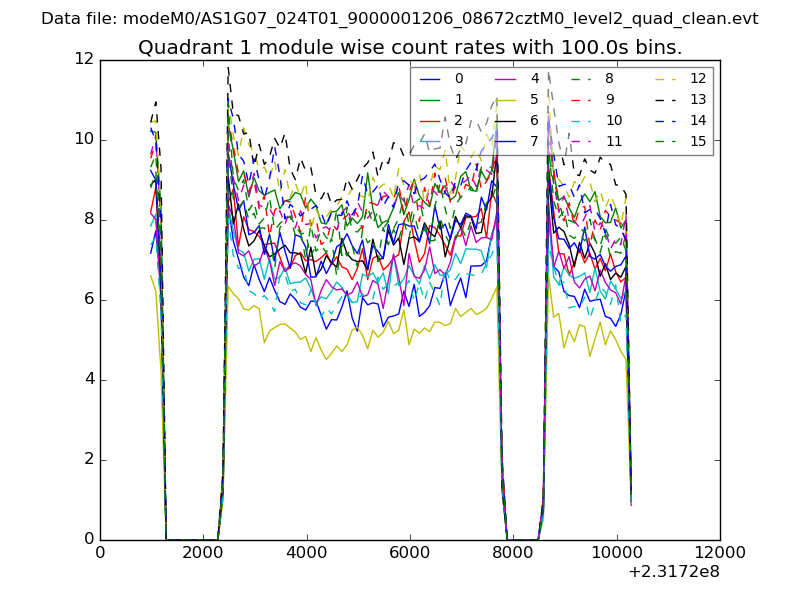
| Module-wise count rates for Quadrant A Data is divided into 100 sec bins |
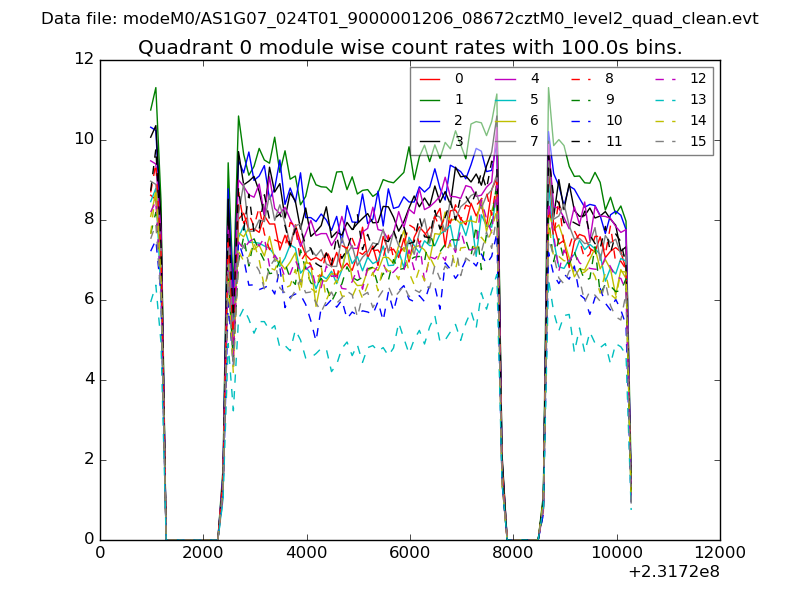 |
 |
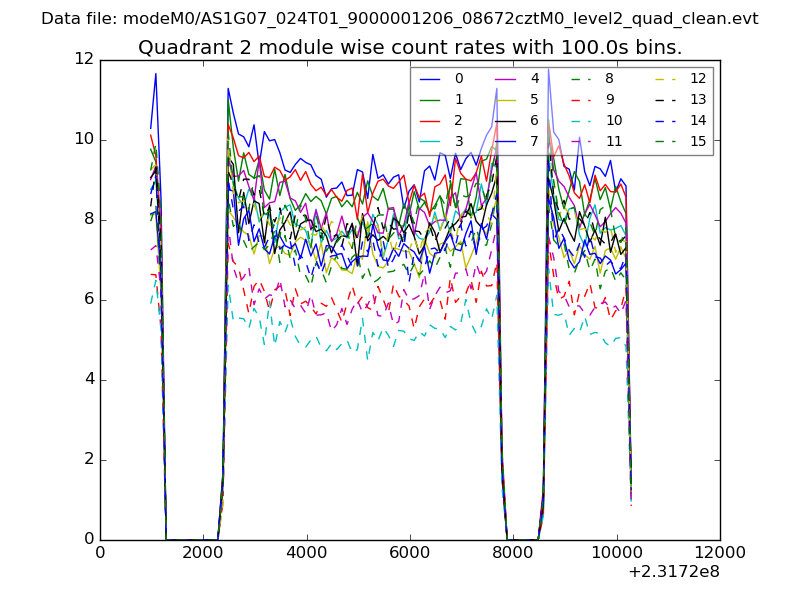
| Module-wise count rates for Quadrant B Data is divided into 100 sec bins |
 |
 |
| Module-wise count rates for Quadrant C Data is divided into 100 sec bins |
 |
 |
| Module-wise count rates for Quadrant D Data is divided into 100 sec bins |
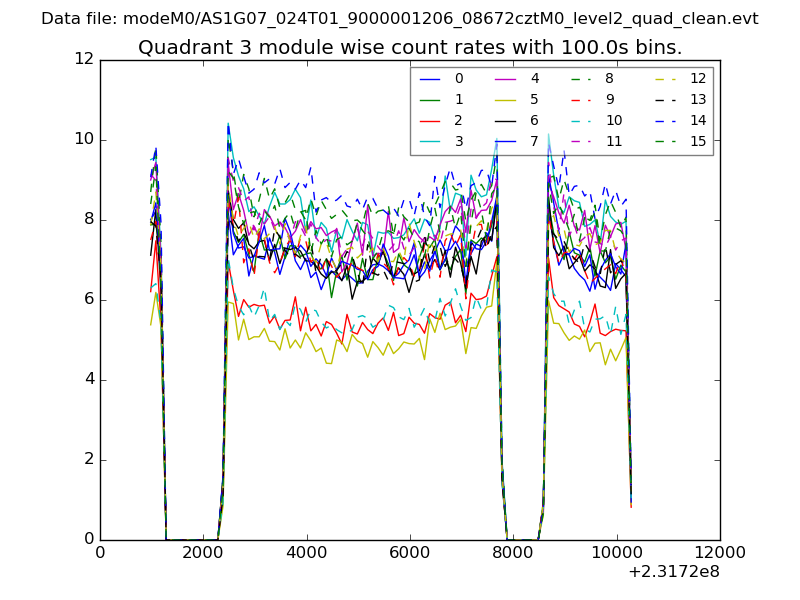 |
 |
| Parameter | Plot |
|---|---|
| CZT HV Monitor | 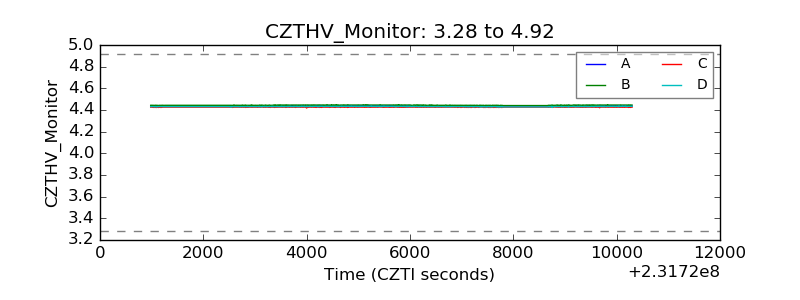 |
| D_VDD | 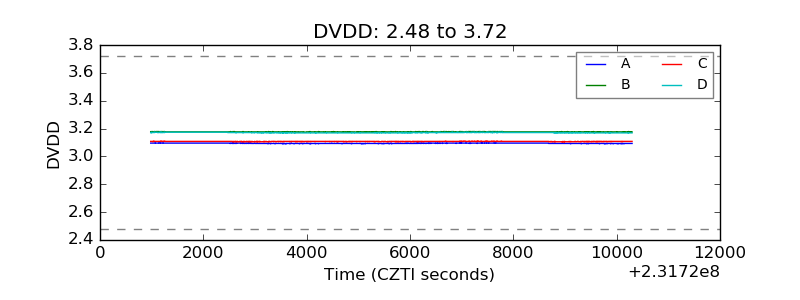 |
| Temperature 1 | 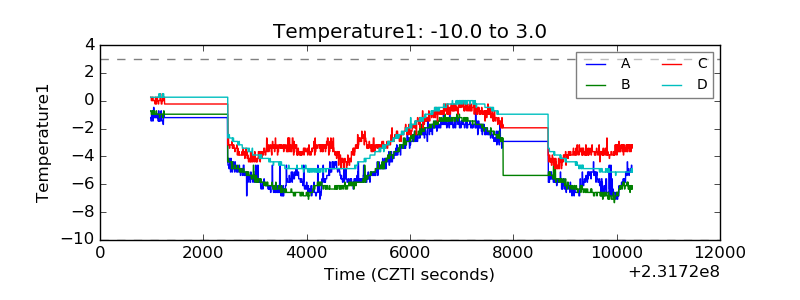 |
| Veto HV Monitor | 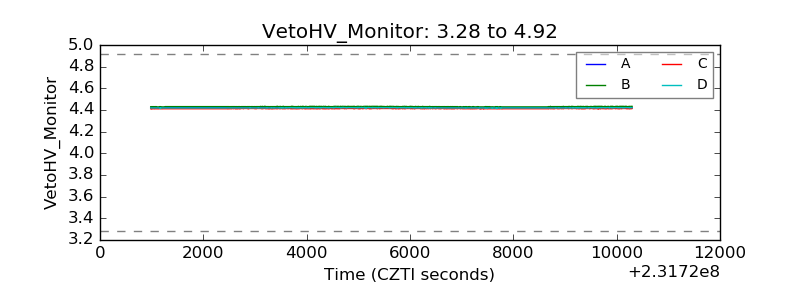 |
| Veto LLD | 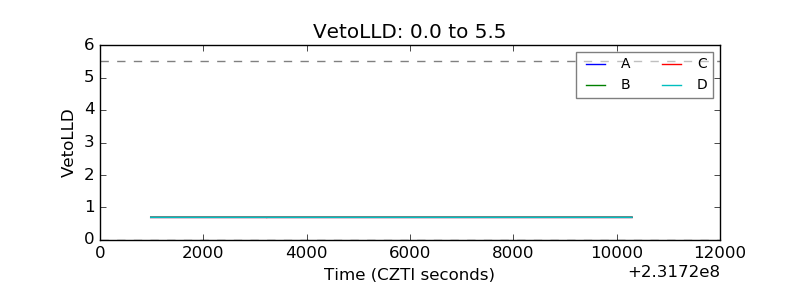 |
| Alpha Counter | 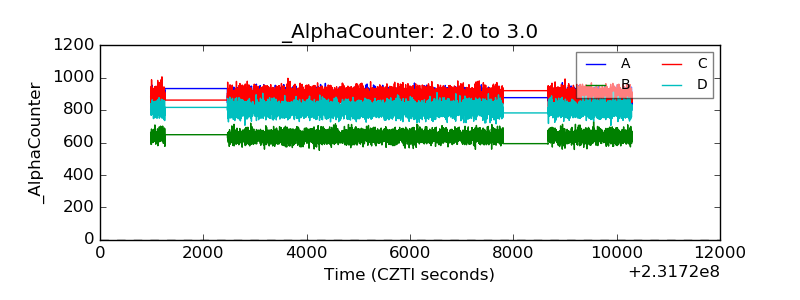 |
| _CPM_Rate | 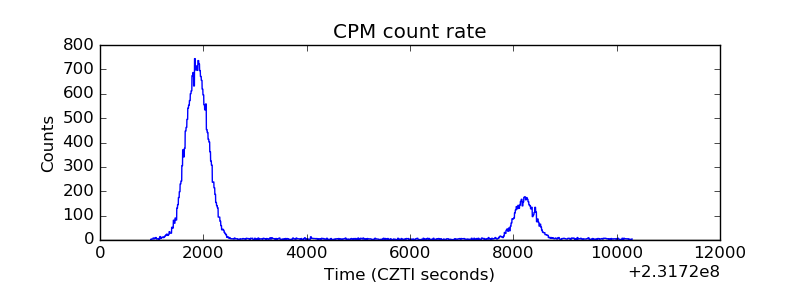 |
| CZT Counter | 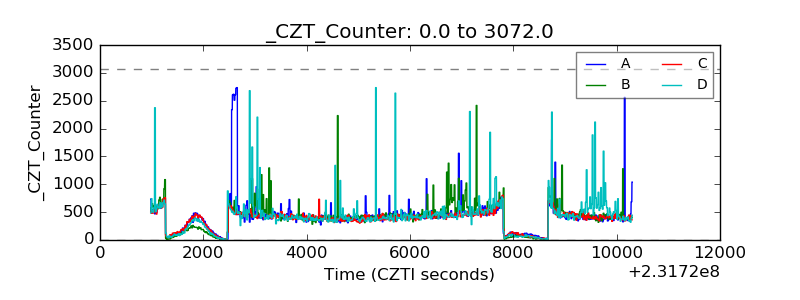 |
| +2.5 Volts monitor |  |
| +5 Volts monitor | 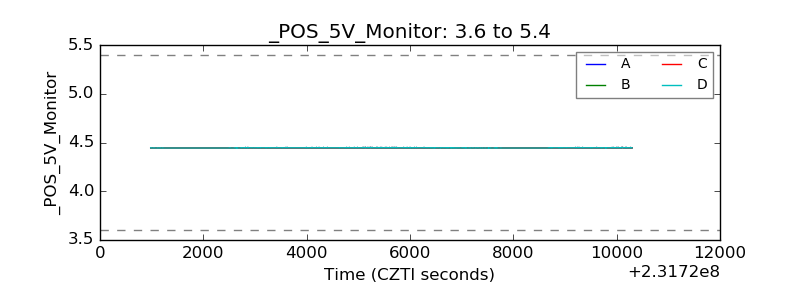 |
| _ROLL_ROT | 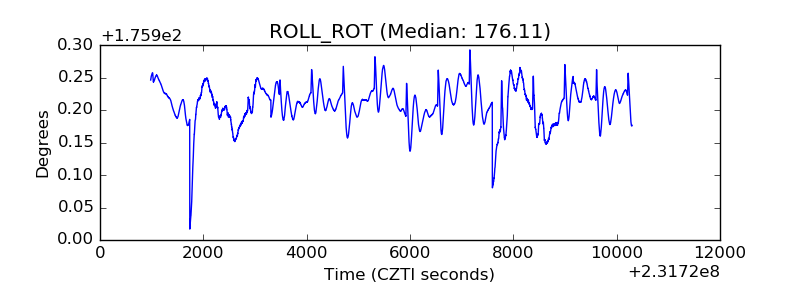 |
| _Roll_DEC | 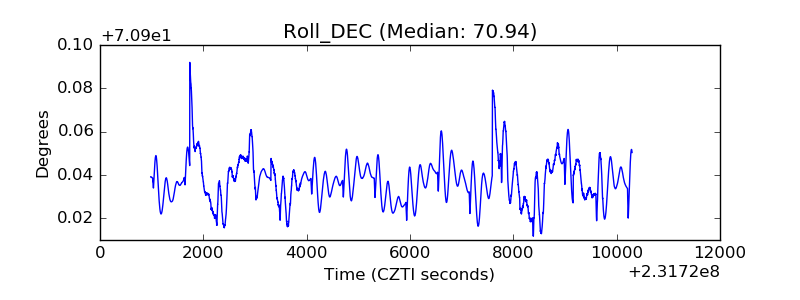 |
| _Roll_RA | 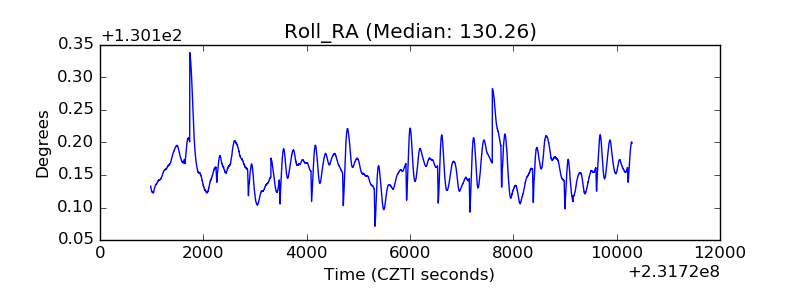 |
| Veto Counter | 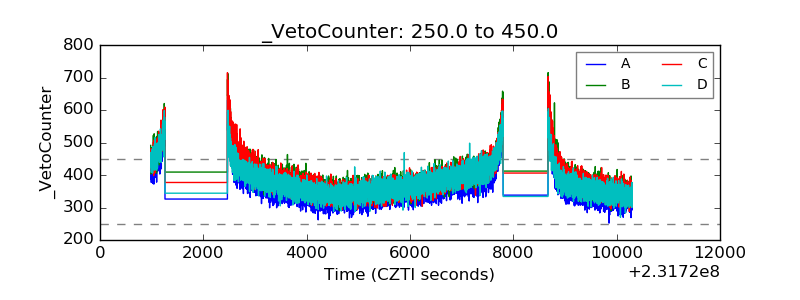 |