| Param | Original file | Final file |
|---|---|---|
| Filename | modeM0/AS1G07_024T01_9000001206_08673cztM0_level2.evt | modeM0/AS1G07_024T01_9000001206_08673cztM0_level2_quad_clean.evt |
| Size (bytes) | 476,409,600 | 133,493,760 |
| Size | 454.3 MB | 127.3 MB |
| Events in quadrant A | 3,340,476 | 874,689 |
| Events in quadrant B | 3,700,988 | 897,814 |
| Events in quadrant C | 3,251,566 | 896,904 |
| Events in quadrant D | 3,624,731 | 851,656 |
| Mode M0 | |||
|---|---|---|---|
| Quadrant | BADHDUFLAG | Total packets | Discarded packets |
| A | 0 | 15510 | 3 |
| B | 0 | 16308 | 2 |
| C | 0 | 15327 | 2 |
| D | 0 | 16429 | 2 |
| Mode M9 | |||
|---|---|---|---|
| Quadrant | BADHDUFLAG | Total packets | Discarded packets |
| A | 0 | 10 | 0 |
| B | 0 | 10 | 0 |
| C | 0 | 10 | 0 |
| D | 0 | 11 | 0 |
| Mode SS | |||
|---|---|---|---|
| Quadrant | BADHDUFLAG | Total packets | Discarded packets |
| A | 0 | 154 | 0 |
| B | 0 | 154 | 0 |
| C | 0 | 154 | 0 |
| D | 0 | 154 | 0 |
| Quadrant | Total seconds | Saturated seconds | Saturation percentage |
|---|---|---|---|
| A | 7504 | 99 | 1.319296% |
| B | 7504 | 206 | 2.745203% |
| C | 7504 | 51 | 0.679638% |
| D | 7504 | 122 | 1.625800% |
Noise dominated data is calculated using 1-second bins in cleaned event files. If a bin has >2000 counts, and if more than 50% of those come from <1% of pixels, then it is considered to be noise-dominated and hence unusable.
| Quadrant | # 1 sec bins | Bins with >0 counts | Bins with >2000 counts | High rate bins dominated by noise | Noise dominated (total time) | Noise dominated (detector-on time) | Marked lightcurve |
|---|---|---|---|---|---|---|---|
| A | 7924 | 7506 | 13 | 13 | 0.16% | 0.17% | 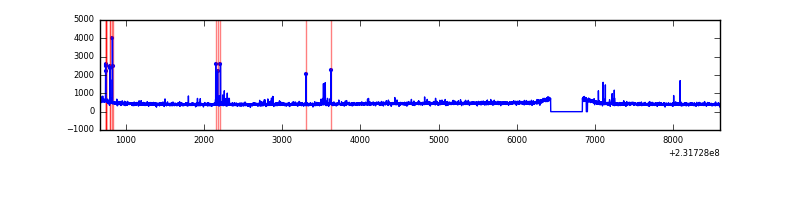 |
| B | 7924 | 7505 | 22 | 22 | 0.28% | 0.29% | 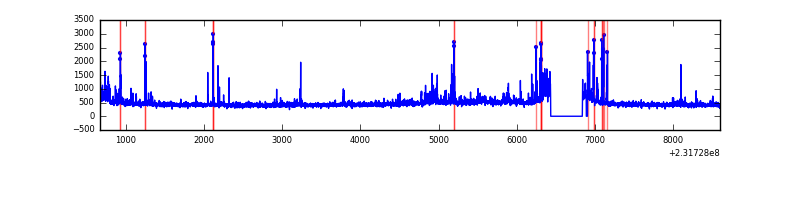 |
| C | 7924 | 7506 | 0 | 0 | 0.00% | 0.00% | 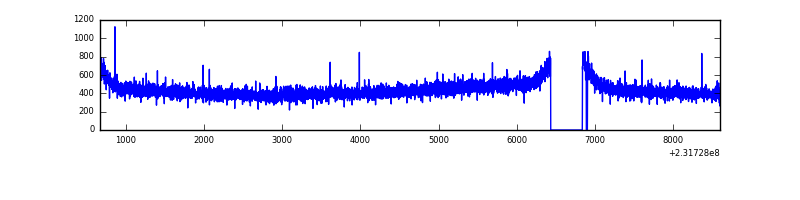 |
| D | 7924 | 7506 | 60 | 60 | 0.76% | 0.80% | 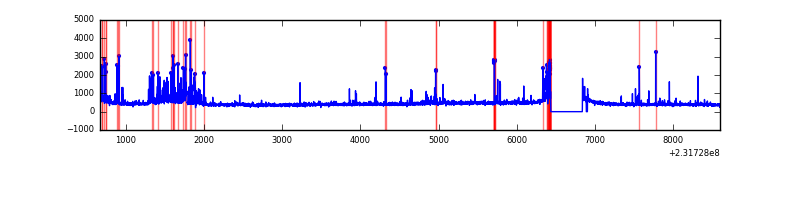 |
Top three noisy pixels from each quadrant. If the there are fewer than three noisy pixels in the level2.evt file, extra rows are filled as -1
| Pixel properties | Quadrant properties | ||||||
|---|---|---|---|---|---|---|---|
| Quadrant | DetID | PixID | Counts | Sigma | Mean | Median | Sigma |
| A | 13 | 248 | 42651 | 243.25 | 837 | 817 | 172.0 |
| A | 15 | 174 | 39868 | 227.07 | 837 | 817 | 172.0 |
| A | 13 | 251 | 24539 | 137.93 | 837 | 817 | 172.0 |
| B | 10 | 16 | 256709 | 1610.22 | 847 | 826 | 158.9 |
| B | 4 | 48 | 48528 | 300.18 | 847 | 826 | 158.9 |
| B | 4 | 173 | 28991 | 177.24 | 847 | 826 | 158.9 |
| C | 13 | 61 | 6535 | 29.83 | 829 | 832 | 191.2 |
| C | 1 | 16 | 5319 | 23.47 | 829 | 832 | 191.2 |
| C | 8 | 128 | 4670 | 20.07 | 829 | 832 | 191.2 |
| D | 12 | 233 | 233821 | 1180.57 | 812 | 788 | 197.4 |
| D | 10 | 253 | 90287 | 453.41 | 812 | 788 | 197.4 |
| D | 7 | 71 | 89636 | 450.11 | 812 | 788 | 197.4 |
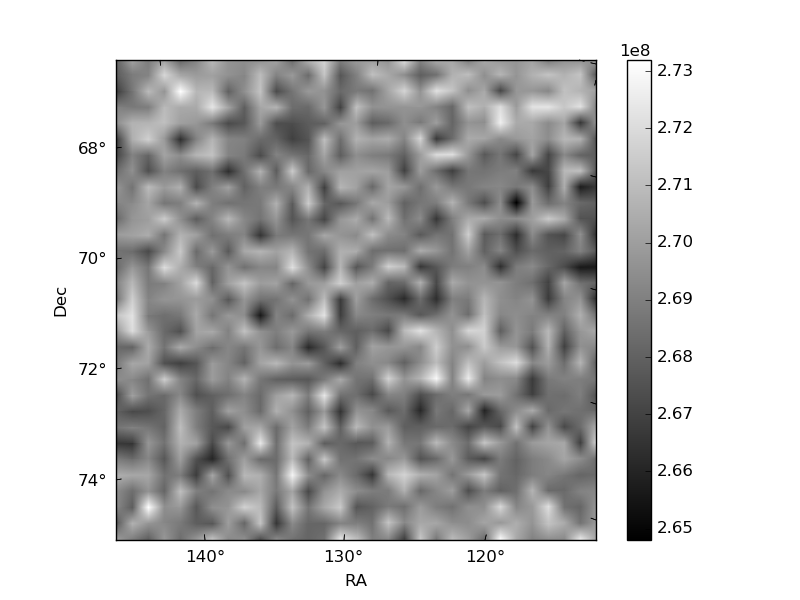
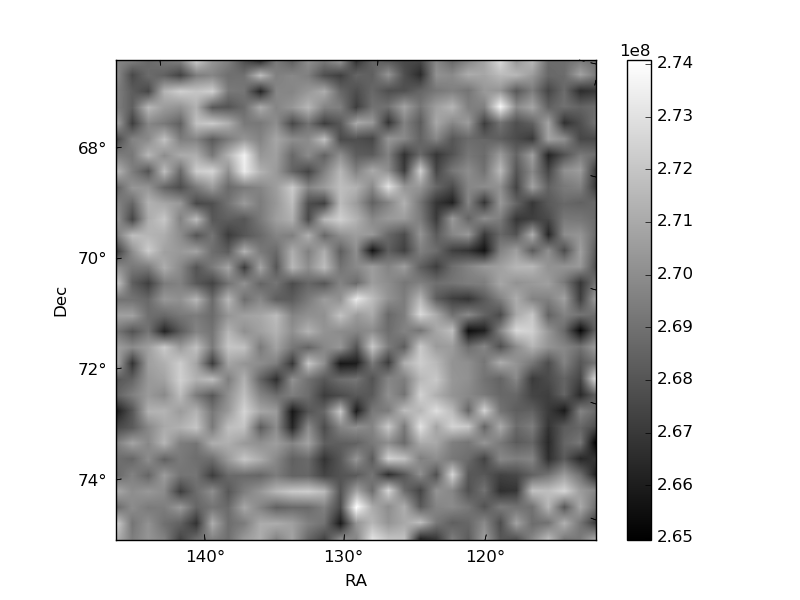
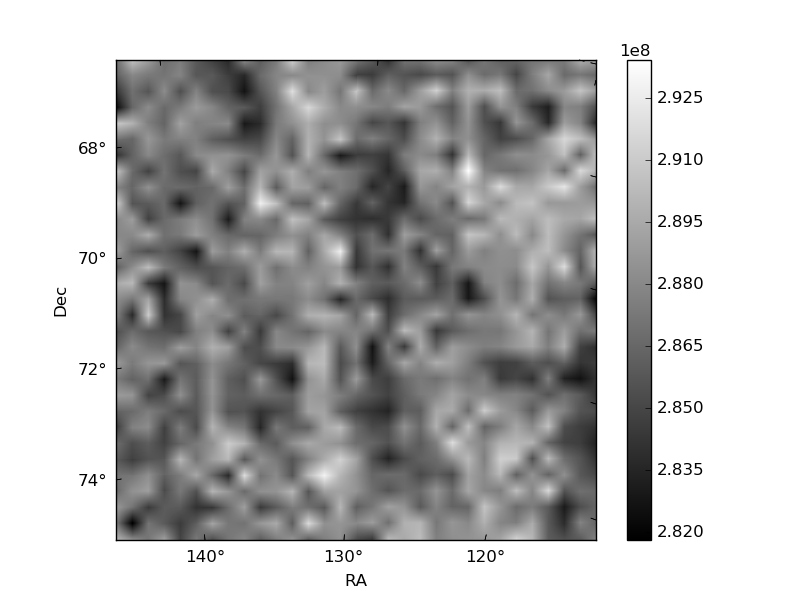
Histogram calculated using DETX and DETY for each event in the final _common_clean file
| Quadrant A | 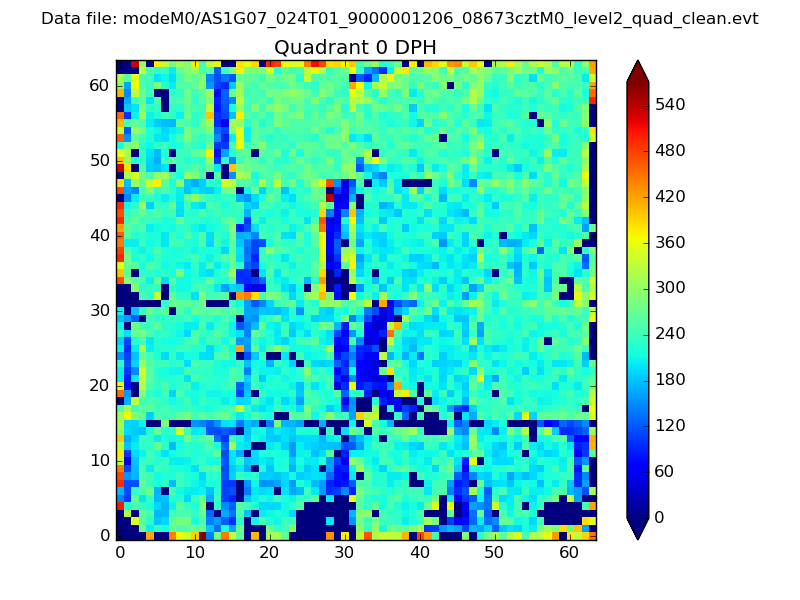 |
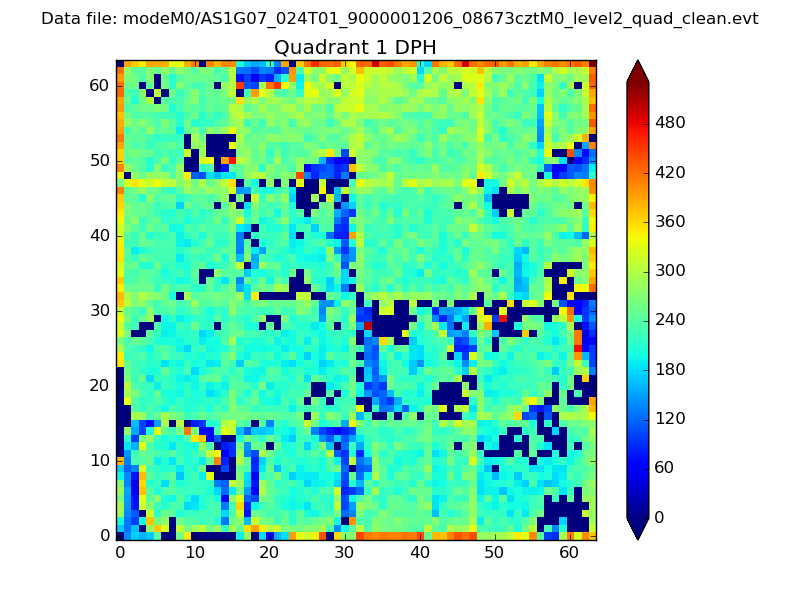 |
Quadrant B |
|---|---|---|---|
| Quadrant D | 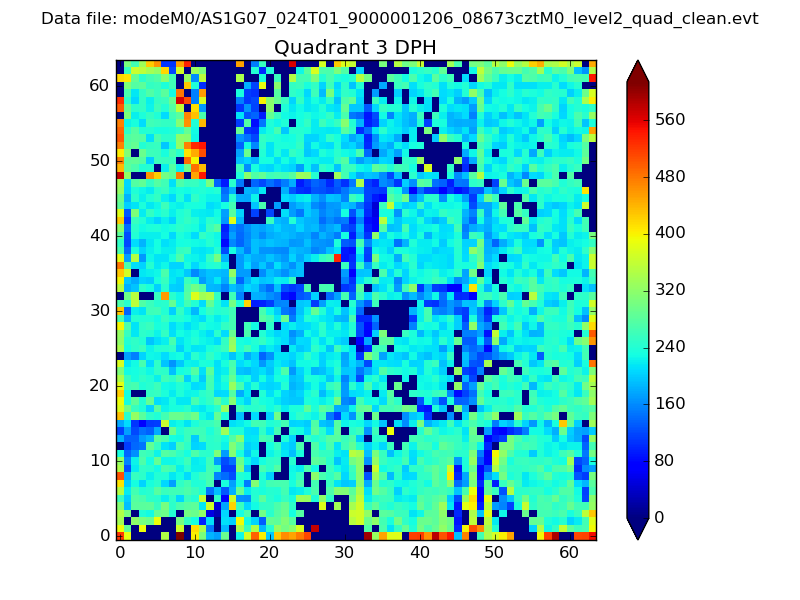 |
 |
Quadrant C |
| Plot type | Count rate plots | Images |
|---|---|---|
| Comparison with Poisson distribution Blue bars denote a histogram of data divided into 1 sec bins. Red curve is a Poisson curve with rate = median count rate of data. |
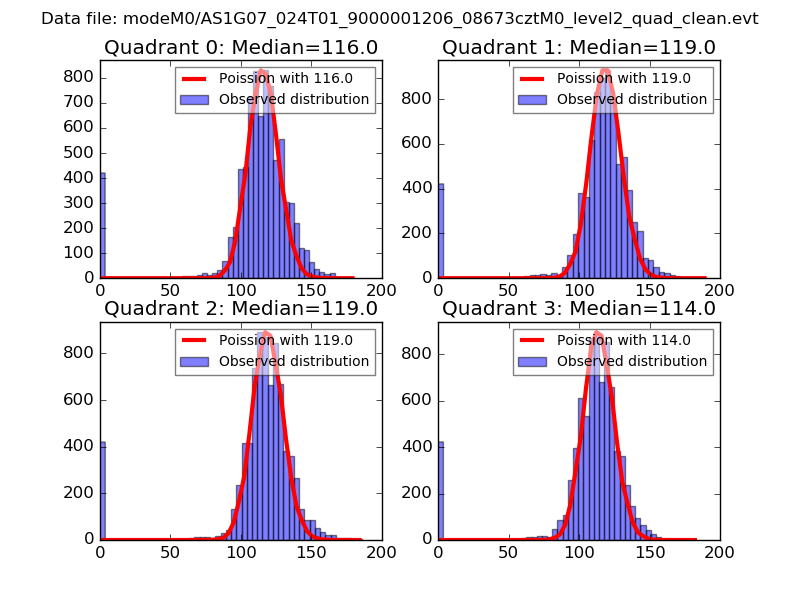 |
 |
| Quadrant-wise count rates Data is divided into 100 sec bins |
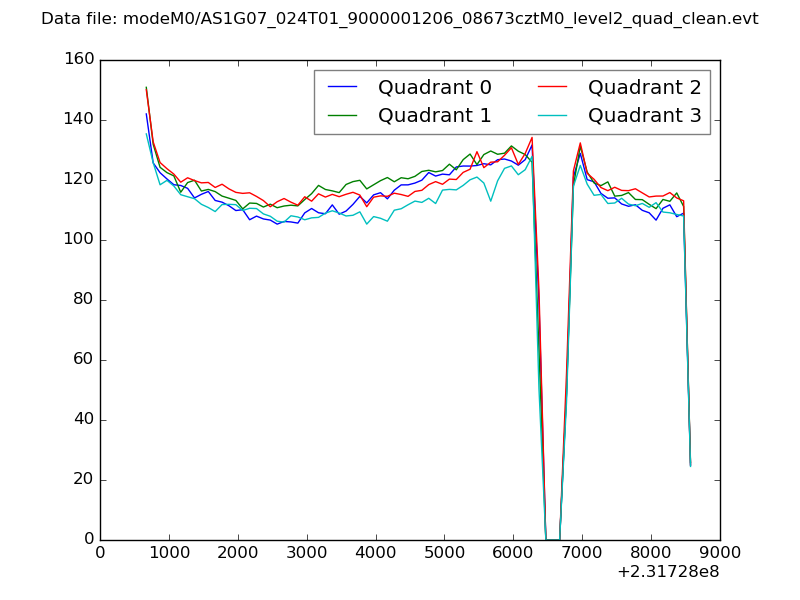 |
|
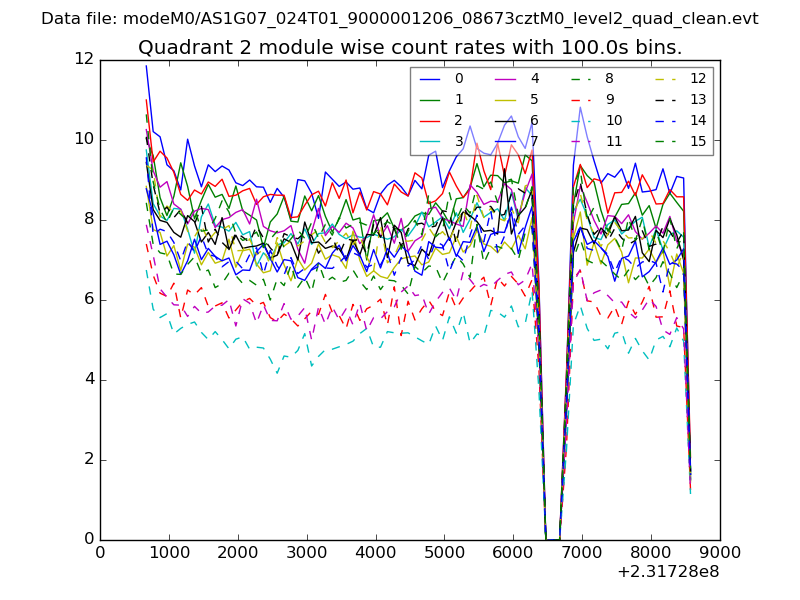
| Module-wise count rates for Quadrant A Data is divided into 100 sec bins |
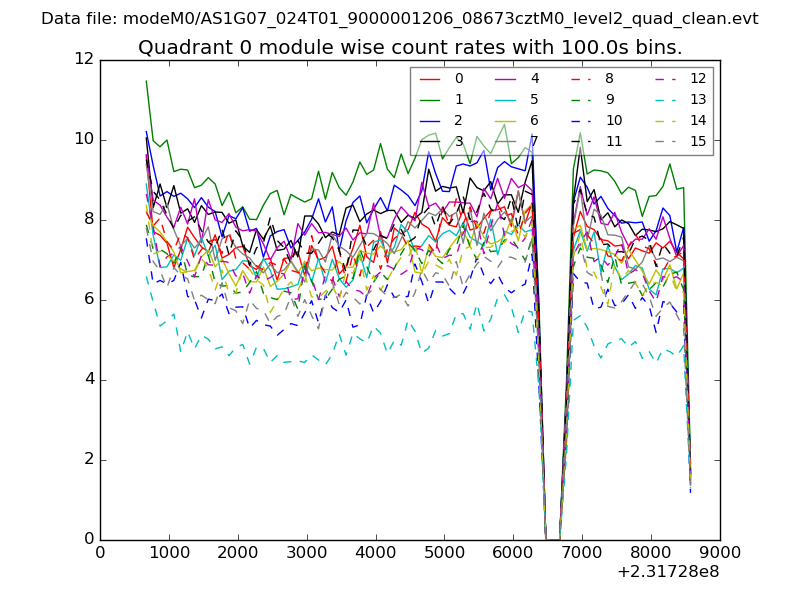 |
 |
| Module-wise count rates for Quadrant B Data is divided into 100 sec bins |
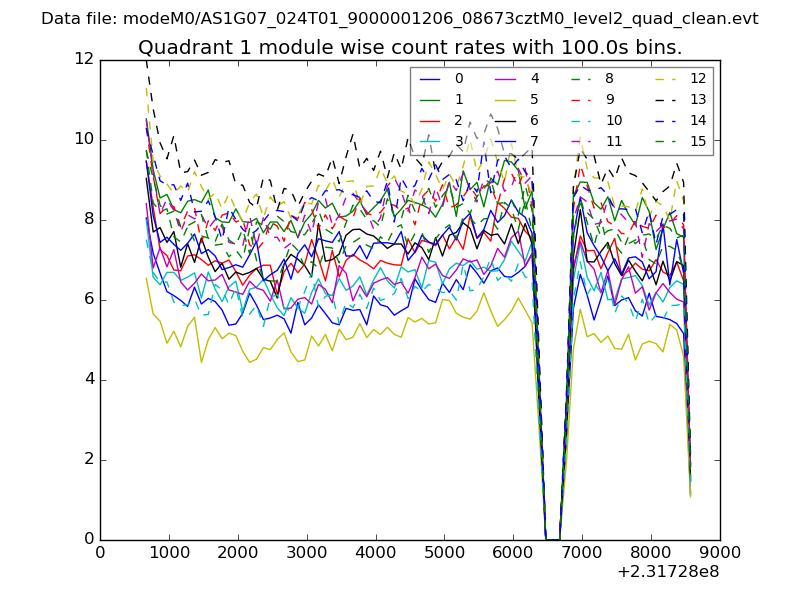 |
 |
| Module-wise count rates for Quadrant C Data is divided into 100 sec bins |
 |
 |
| Module-wise count rates for Quadrant D Data is divided into 100 sec bins |
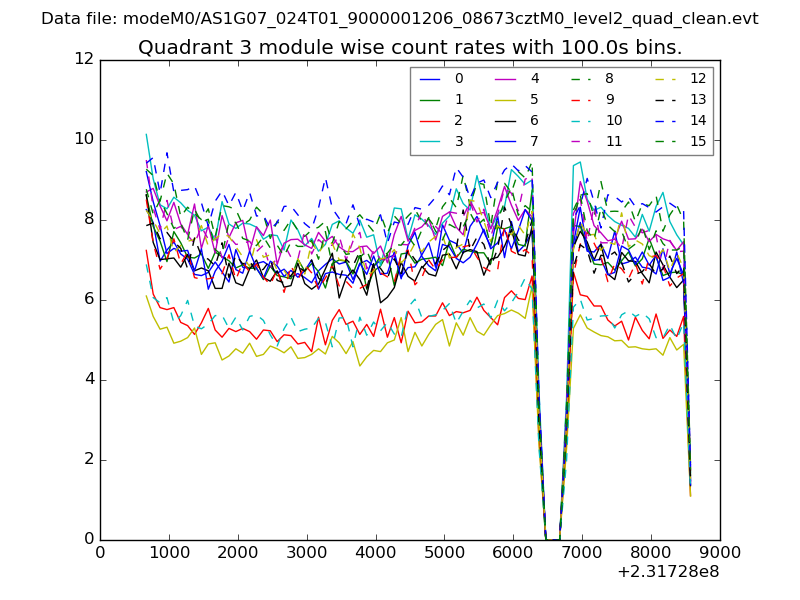 |
 |
| Parameter | Plot |
|---|---|
| CZT HV Monitor | 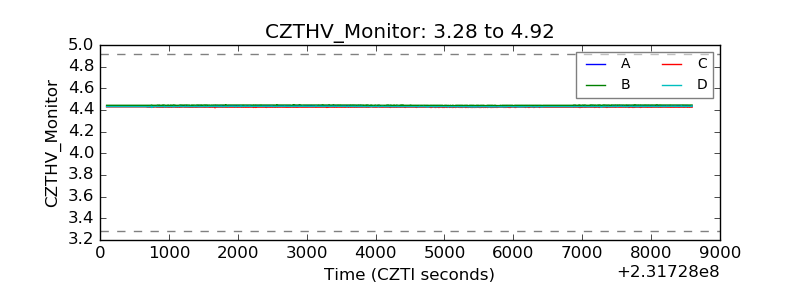 |
| D_VDD | 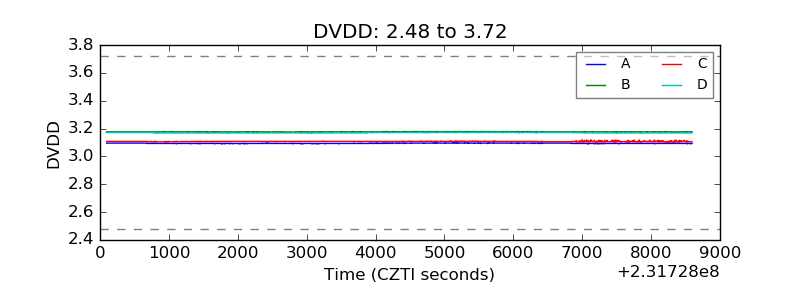 |
| Temperature 1 | 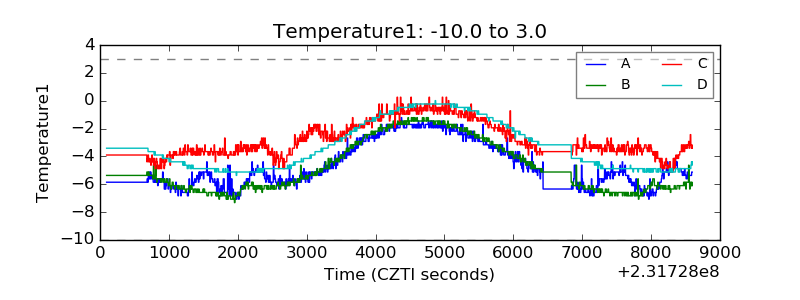 |
| Veto HV Monitor | 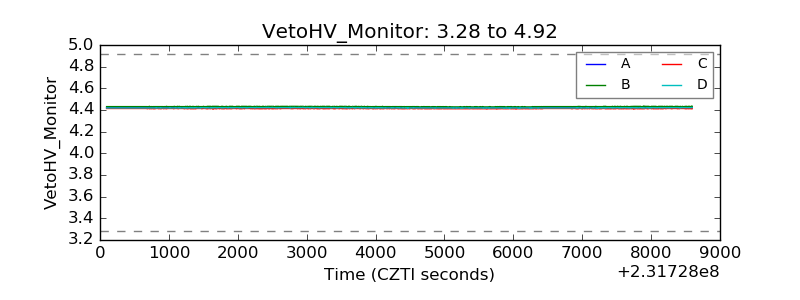 |
| Veto LLD | 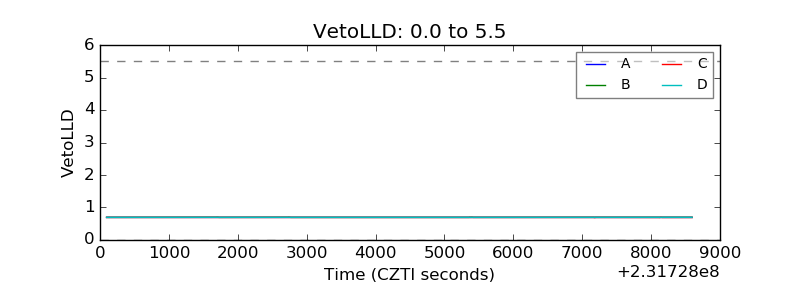 |
| Alpha Counter | 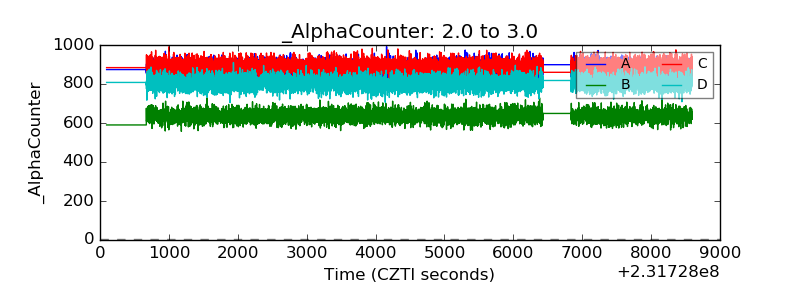 |
| _CPM_Rate | 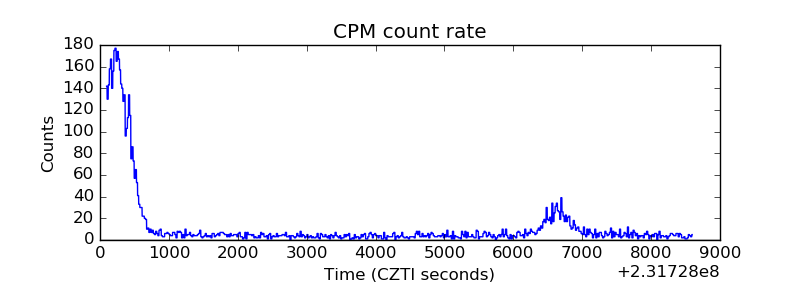 |
| CZT Counter | 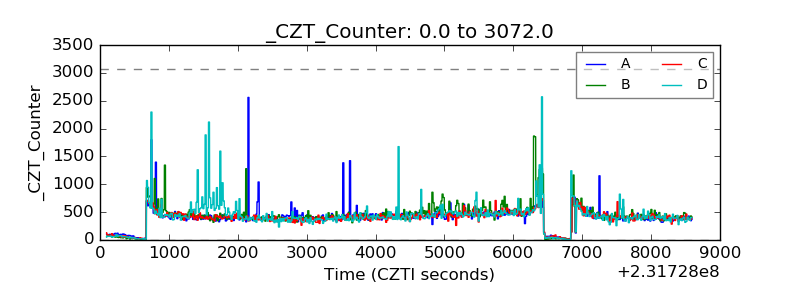 |
| +2.5 Volts monitor |  |
| +5 Volts monitor |  |
| _ROLL_ROT | 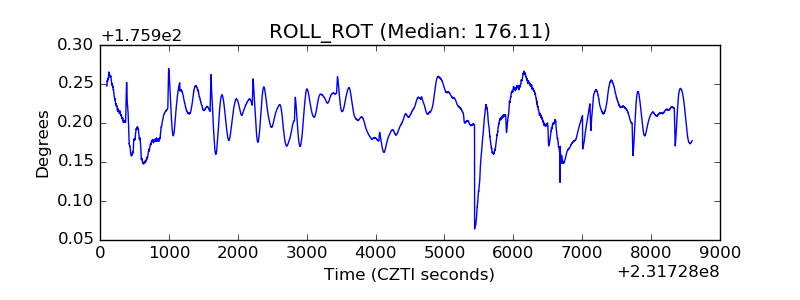 |
| _Roll_DEC | 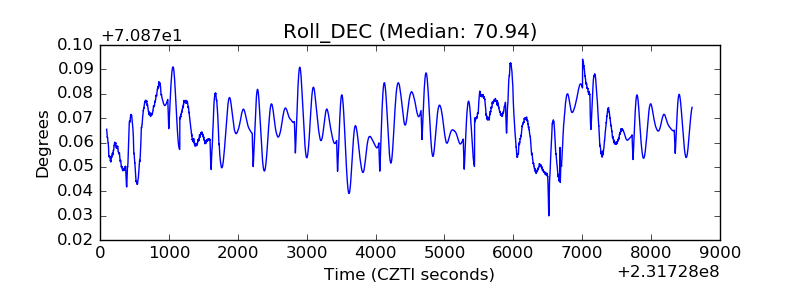 |
| _Roll_RA | 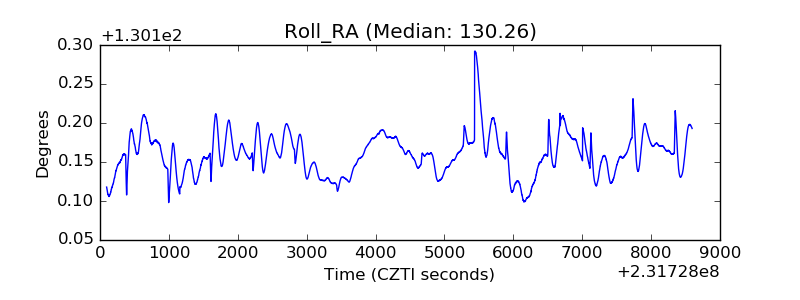 |
| Veto Counter | 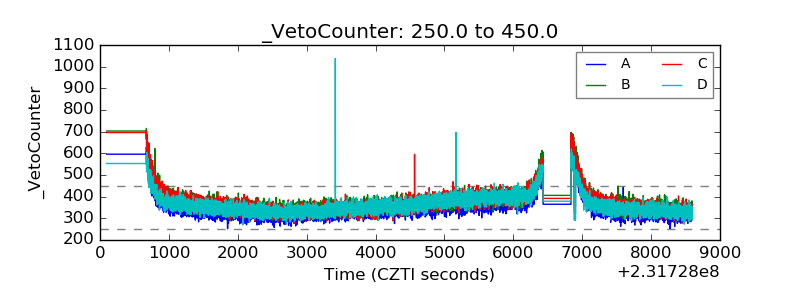 |