| Param | Original file | Final file |
|---|---|---|
| Filename | modeM0/AS1G07_024T01_9000001206_08674cztM0_level2.evt | modeM0/AS1G07_024T01_9000001206_08674cztM0_level2_quad_clean.evt |
| Size (bytes) | 429,099,840 | 121,285,440 |
| Size | 409.2 MB | 115.7 MB |
| Events in quadrant A | 3,072,033 | 790,533 |
| Events in quadrant B | 3,270,219 | 820,235 |
| Events in quadrant C | 2,982,623 | 810,848 |
| Events in quadrant D | 3,203,593 | 773,845 |
| Mode M0 | |||
|---|---|---|---|
| Quadrant | BADHDUFLAG | Total packets | Discarded packets |
| A | 0 | 14211 | 2 |
| B | 0 | 14492 | 1 |
| C | 0 | 14025 | 1 |
| D | 0 | 14697 | 1 |
| Mode M9 | |||
|---|---|---|---|
| Quadrant | BADHDUFLAG | Total packets | Discarded packets |
| A | 0 | 2 | 0 |
| B | 0 | 2 | 0 |
| C | 0 | 2 | 0 |
| D | 0 | 2 | 0 |
| Mode SS | |||
|---|---|---|---|
| Quadrant | BADHDUFLAG | Total packets | Discarded packets |
| A | 0 | 138 | 0 |
| B | 0 | 138 | 0 |
| C | 0 | 138 | 0 |
| D | 0 | 138 | 0 |
| Quadrant | Total seconds | Saturated seconds | Saturation percentage |
|---|---|---|---|
| A | 6870 | 120 | 1.746725% |
| B | 6870 | 135 | 1.965066% |
| C | 6870 | 47 | 0.684134% |
| D | 6870 | 89 | 1.295488% |
Noise dominated data is calculated using 1-second bins in cleaned event files. If a bin has >2000 counts, and if more than 50% of those come from <1% of pixels, then it is considered to be noise-dominated and hence unusable.
| Quadrant | # 1 sec bins | Bins with >0 counts | Bins with >2000 counts | High rate bins dominated by noise | Noise dominated (total time) | Noise dominated (detector-on time) | Marked lightcurve |
|---|---|---|---|---|---|---|---|
| A | 6920 | 6873 | 18 | 18 | 0.26% | 0.26% | 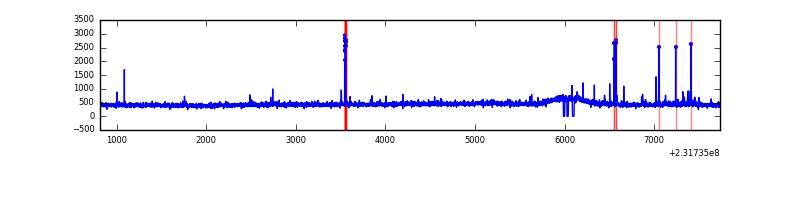 |
| B | 6920 | 6873 | 5 | 5 | 0.07% | 0.07% | 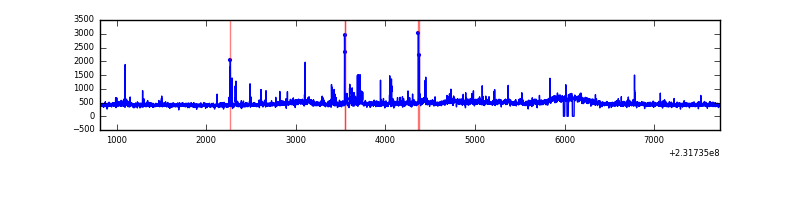 |
| C | 6920 | 6873 | 0 | 0 | 0.00% | 0.00% | 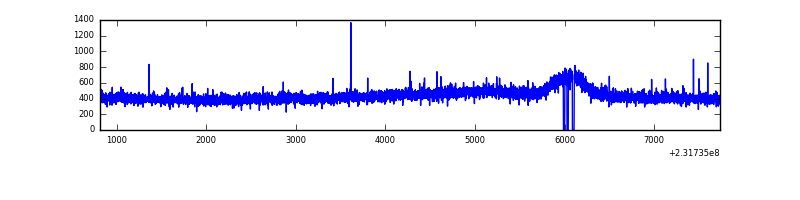 |
| D | 6920 | 6873 | 47 | 47 | 0.68% | 0.68% | 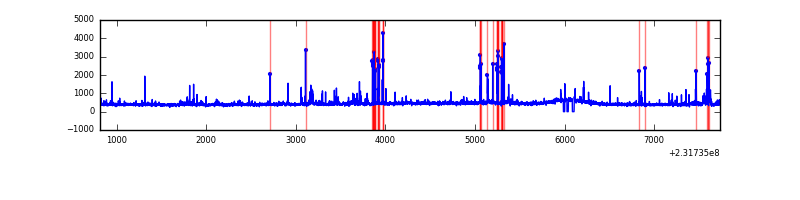 |
Top three noisy pixels from each quadrant. If the there are fewer than three noisy pixels in the level2.evt file, extra rows are filled as -1
| Pixel properties | Quadrant properties | ||||||
|---|---|---|---|---|---|---|---|
| Quadrant | DetID | PixID | Counts | Sigma | Mean | Median | Sigma |
| A | 15 | 174 | 38670 | 243.69 | 768 | 748 | 155.6 |
| A | 13 | 251 | 30813 | 193.2 | 768 | 748 | 155.6 |
| A | 5 | 16 | 26673 | 166.6 | 768 | 748 | 155.6 |
| B | 10 | 16 | 62512 | 415.97 | 782 | 762 | 148.4 |
| B | 4 | 48 | 46895 | 310.76 | 782 | 762 | 148.4 |
| B | 0 | 187 | 32901 | 216.5 | 782 | 762 | 148.4 |
| C | 8 | 128 | 9123 | 47.83 | 757 | 758 | 174.9 |
| C | 13 | 61 | 5949 | 29.68 | 757 | 758 | 174.9 |
| C | 8 | 112 | 5608 | 27.73 | 757 | 758 | 174.9 |
| D | 10 | 253 | 129291 | 704.4 | 748 | 722 | 182.5 |
| D | 2 | 152 | 96712 | 525.91 | 748 | 722 | 182.5 |
| D | 12 | 233 | 53911 | 291.41 | 748 | 722 | 182.5 |
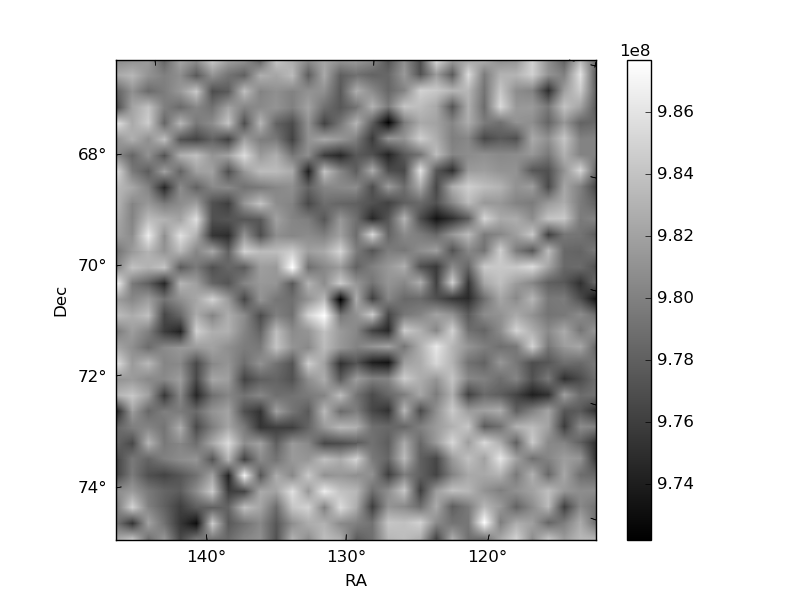
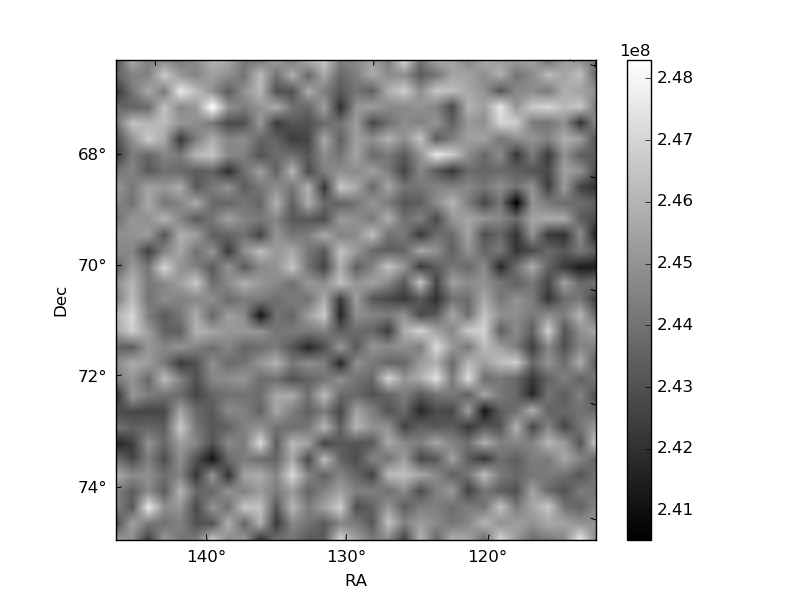
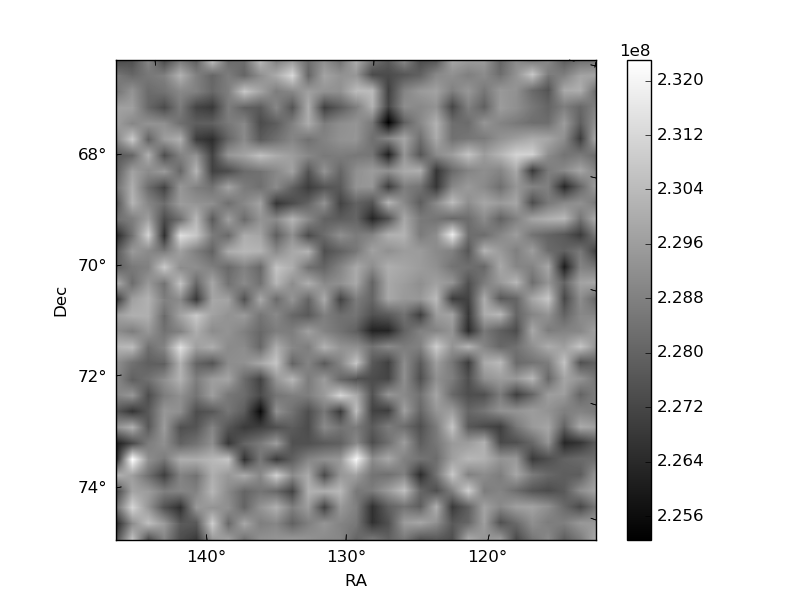
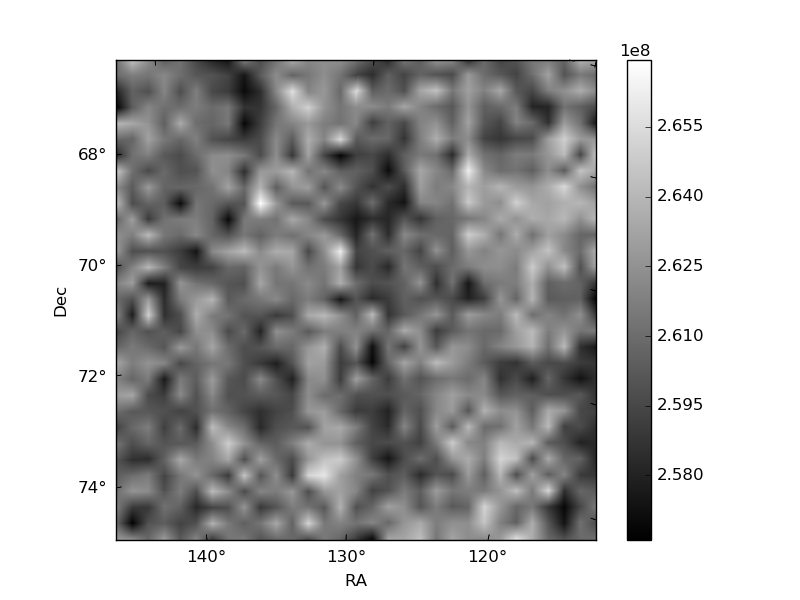
Histogram calculated using DETX and DETY for each event in the final _common_clean file
| Quadrant A | 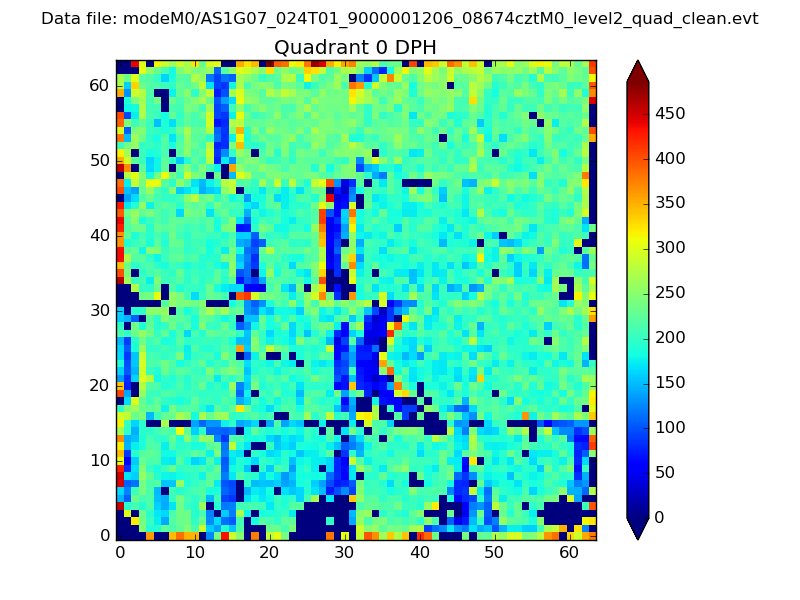 |
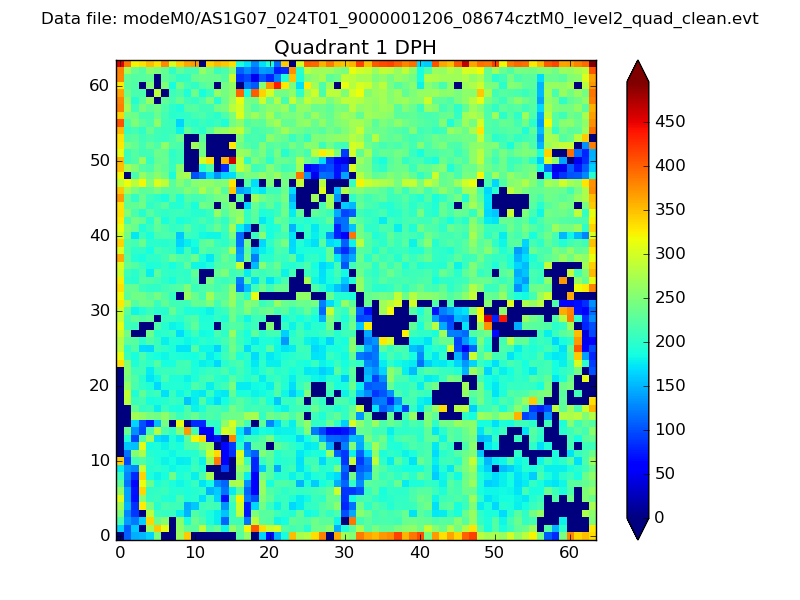 |
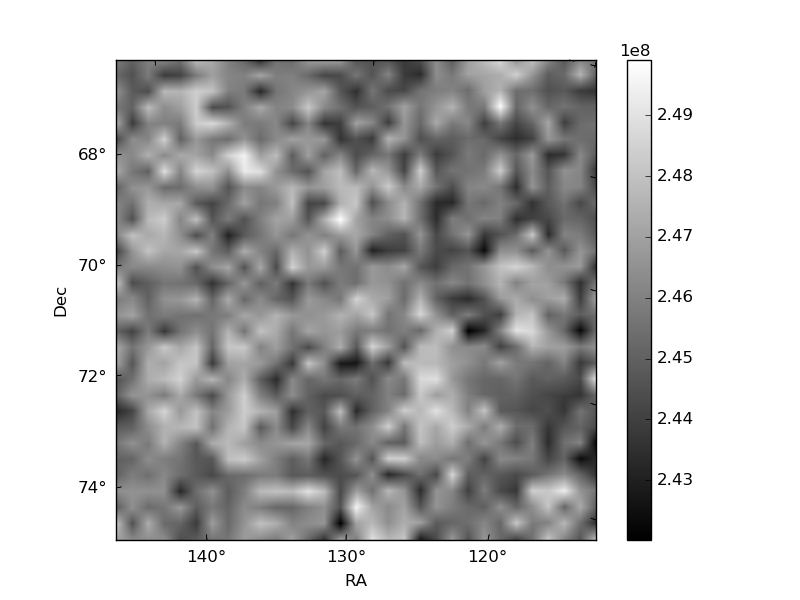
Quadrant B |
|---|---|---|---|
| Quadrant D | 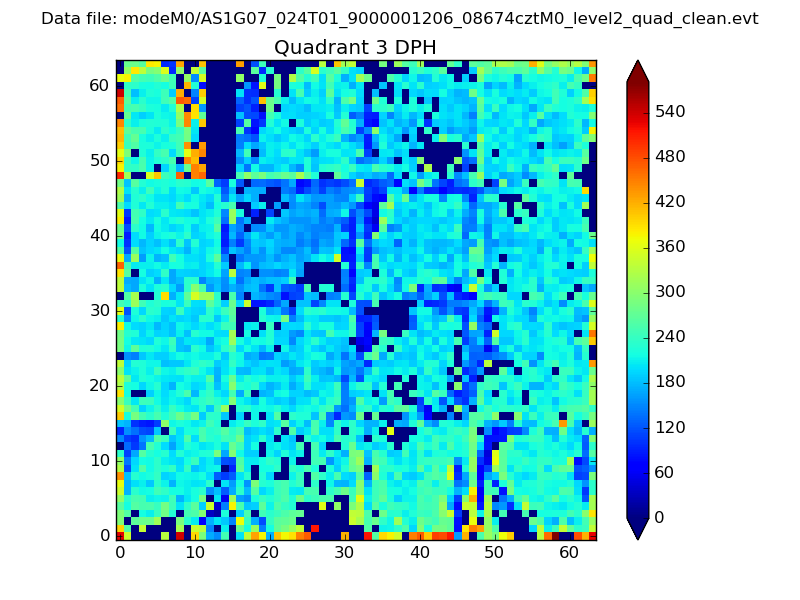 |
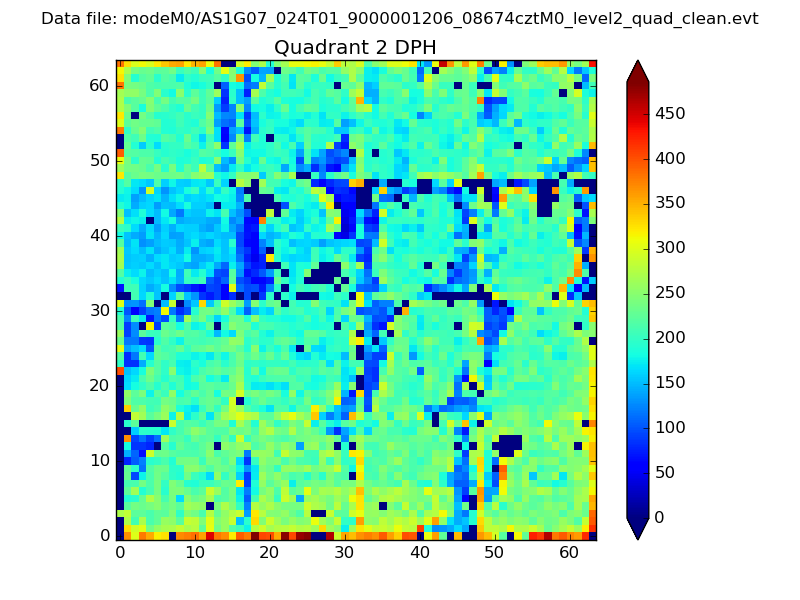 |
Quadrant C |
| Plot type | Count rate plots | Images |
|---|---|---|
| Comparison with Poisson distribution Blue bars denote a histogram of data divided into 1 sec bins. Red curve is a Poisson curve with rate = median count rate of data. |
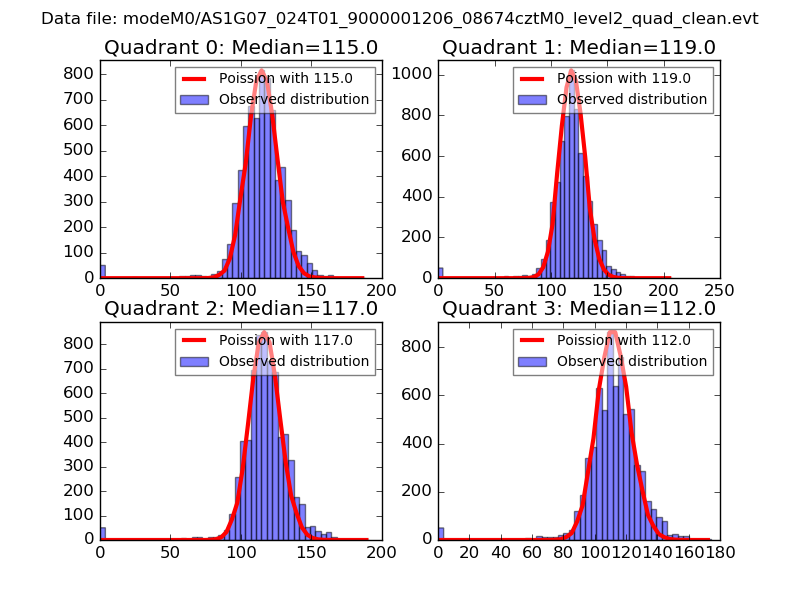 |
 |
| Quadrant-wise count rates Data is divided into 100 sec bins |
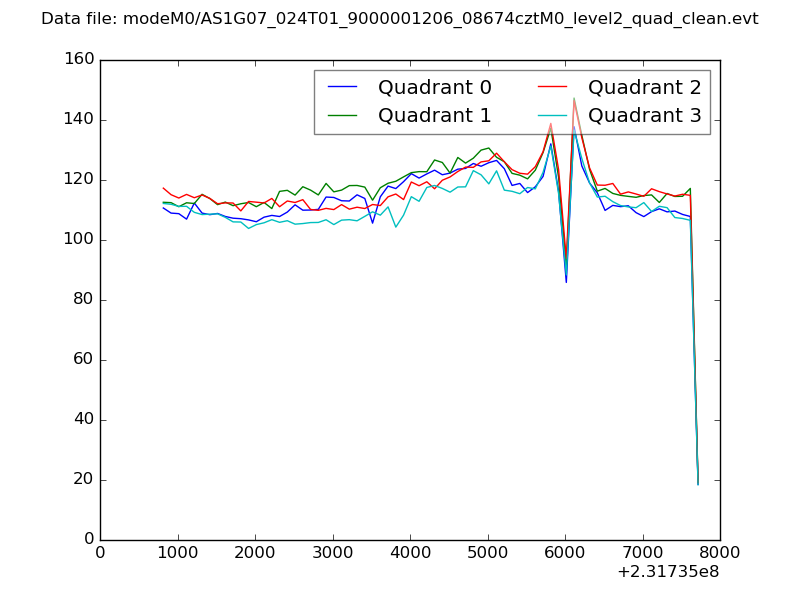 |
|
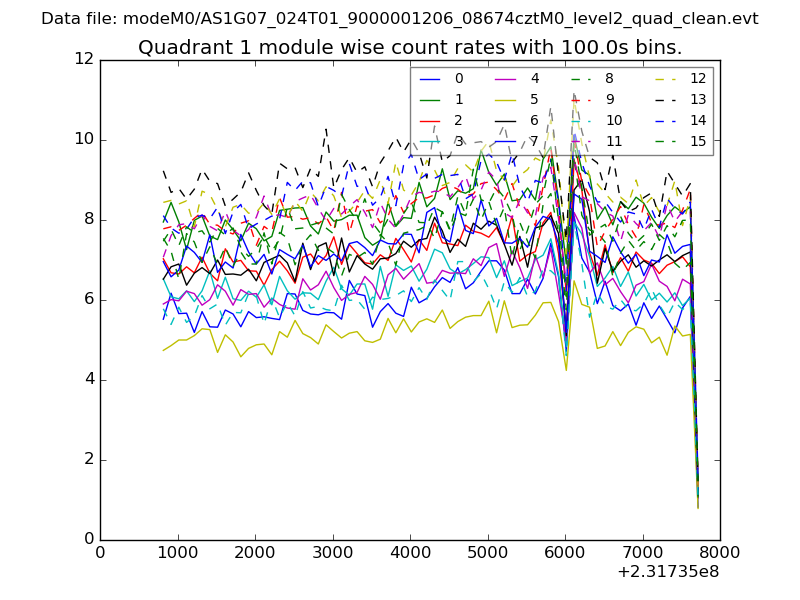
| Module-wise count rates for Quadrant A Data is divided into 100 sec bins |
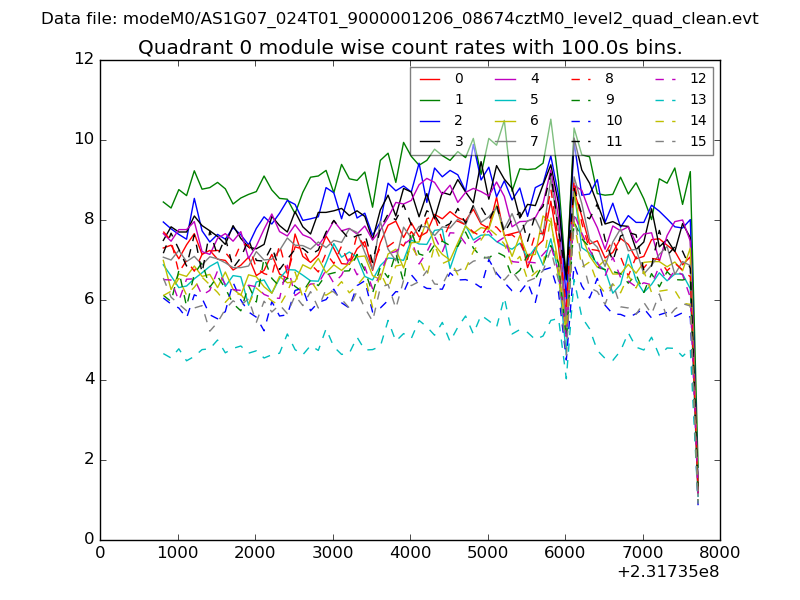 |
 |
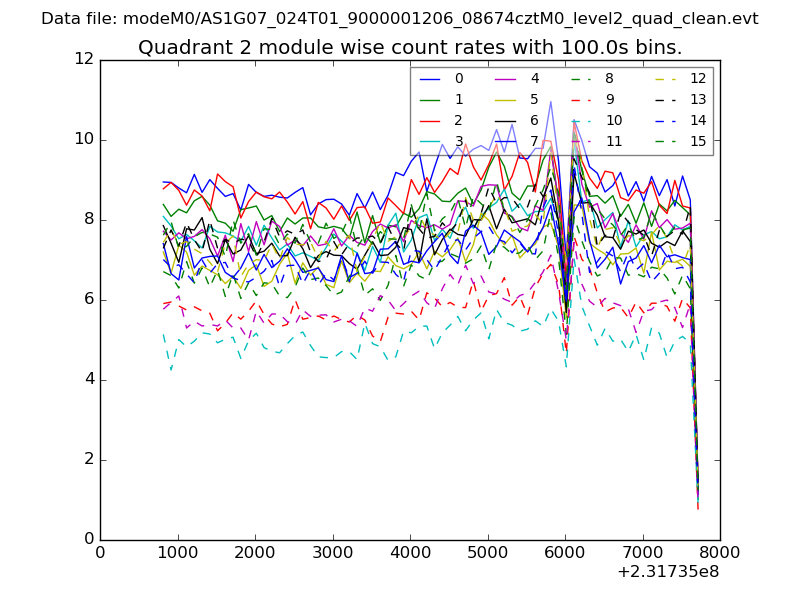
| Module-wise count rates for Quadrant B Data is divided into 100 sec bins |
 |
 |
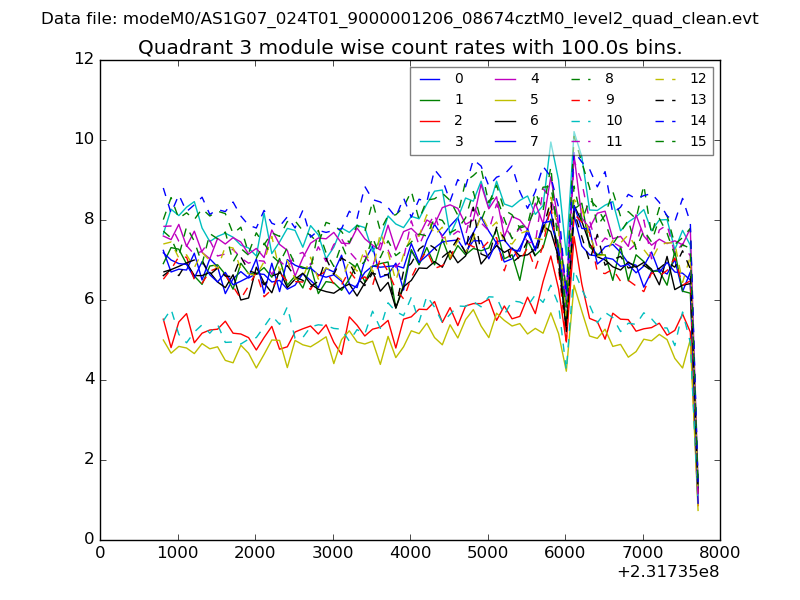
| Module-wise count rates for Quadrant C Data is divided into 100 sec bins |
 |
 |
| Module-wise count rates for Quadrant D Data is divided into 100 sec bins |
 |
 |
| Parameter | Plot |
|---|---|
| CZT HV Monitor | 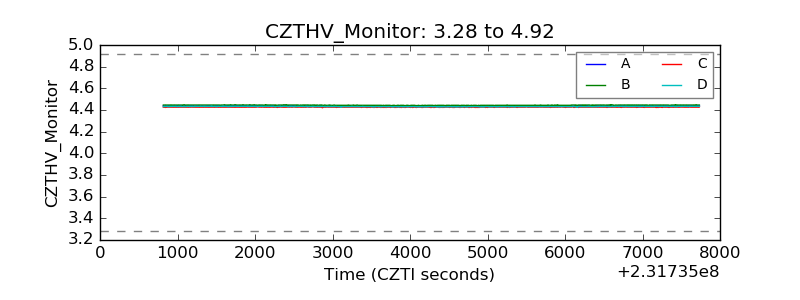 |
| D_VDD | 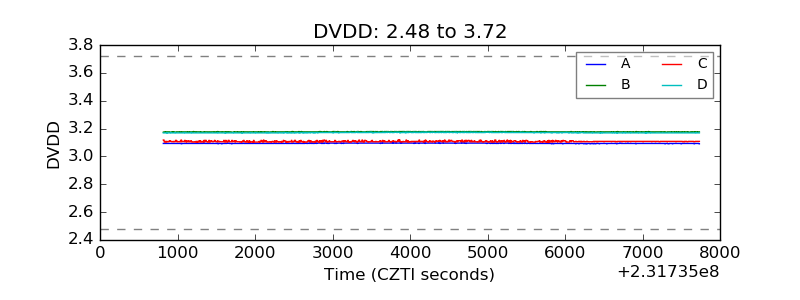 |
| Temperature 1 | 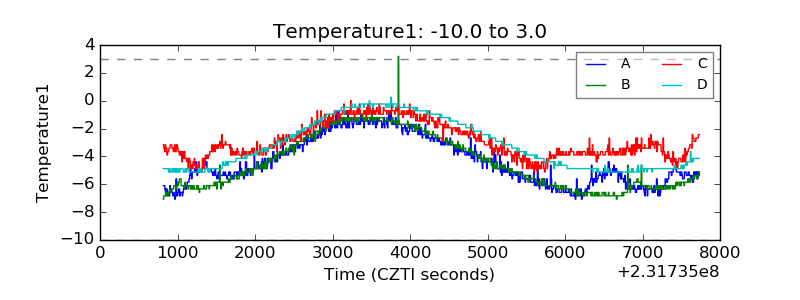 |
| Veto HV Monitor | 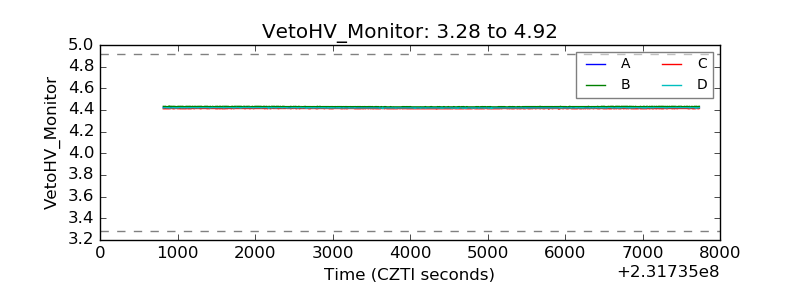 |
| Veto LLD | 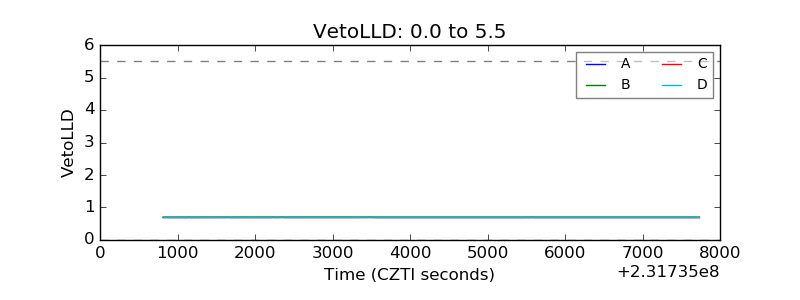 |
| Alpha Counter | 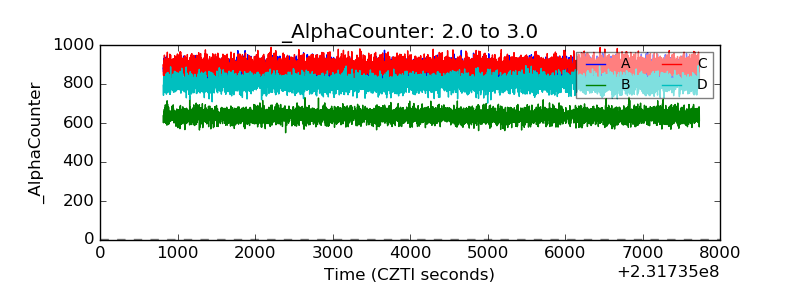 |
| _CPM_Rate | 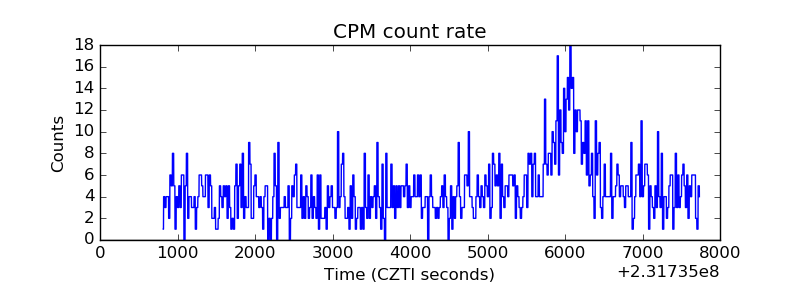 |
| CZT Counter | 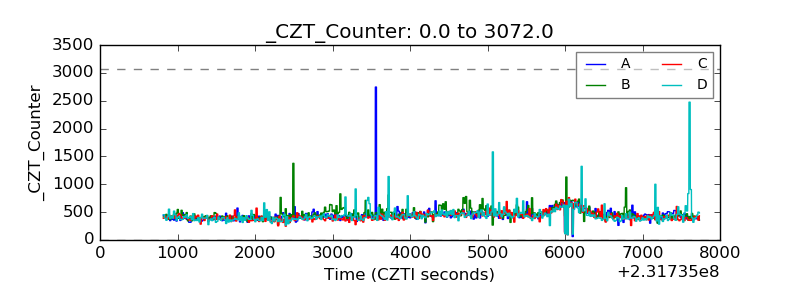 |
| +2.5 Volts monitor | 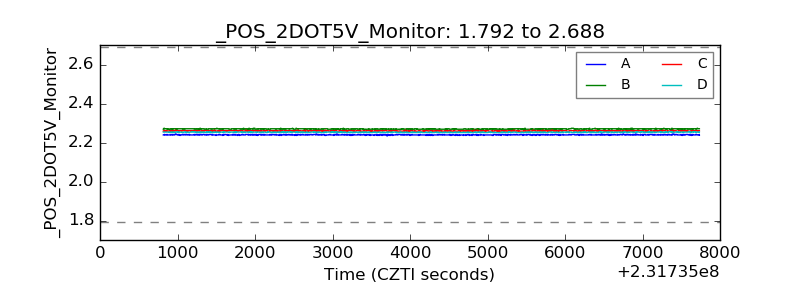 |
| +5 Volts monitor | 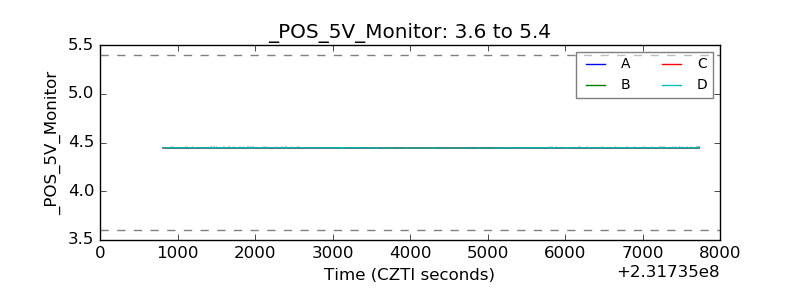 |
| _ROLL_ROT |  |
| _Roll_DEC | 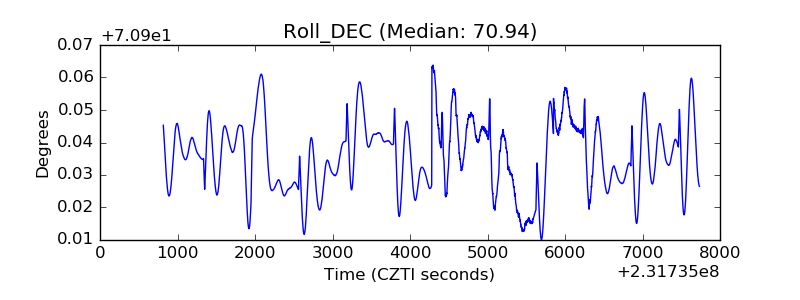 |
| _Roll_RA | 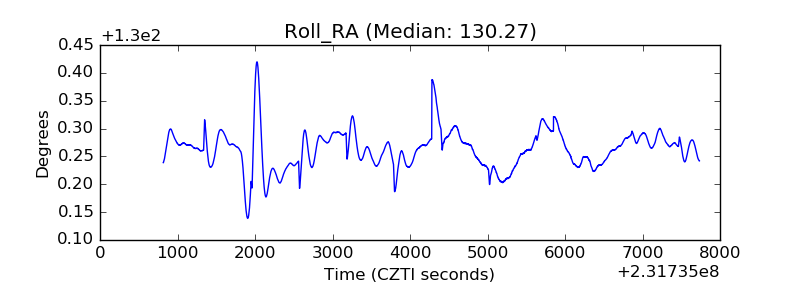 |
| Veto Counter | 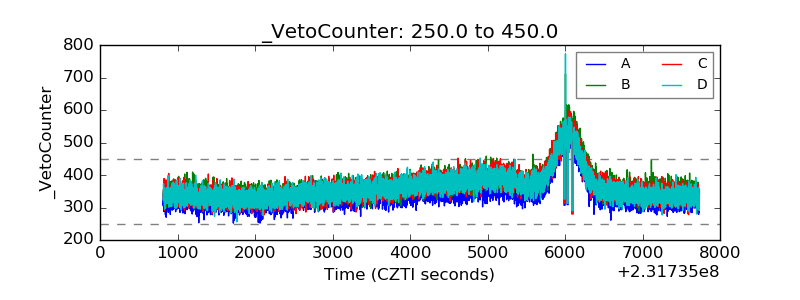 |