| Param | Original file | Final file |
|---|---|---|
| Filename | modeM0/AS1G07_024T01_9000001206_08675cztM0_level2.evt | modeM0/AS1G07_024T01_9000001206_08675cztM0_level2_quad_clean.evt |
| Size (bytes) | 455,094,720 | 125,688,960 |
| Size | 434.0 MB | 119.9 MB |
| Events in quadrant A | 3,210,011 | 822,424 |
| Events in quadrant B | 3,636,083 | 846,326 |
| Events in quadrant C | 3,099,420 | 838,765 |
| Events in quadrant D | 3,349,162 | 799,867 |
| Mode M0 | |||
|---|---|---|---|
| Quadrant | BADHDUFLAG | Total packets | Discarded packets |
| A | 0 | 14747 | 2 |
| B | 0 | 15775 | 1 |
| C | 0 | 14618 | 1 |
| D | 0 | 15378 | 1 |
| Mode M9 | |||
|---|---|---|---|
| Quadrant | BADHDUFLAG | Total packets | Discarded packets |
| A | 0 | 2 | 0 |
| B | 0 | 2 | 0 |
| C | 0 | 2 | 0 |
| D | 0 | 2 | 0 |
| Mode SS | |||
|---|---|---|---|
| Quadrant | BADHDUFLAG | Total packets | Discarded packets |
| A | 0 | 146 | 0 |
| B | 0 | 146 | 0 |
| C | 0 | 146 | 0 |
| D | 0 | 146 | 0 |
| Quadrant | Total seconds | Saturated seconds | Saturation percentage |
|---|---|---|---|
| A | 7169 | 123 | 1.715720% |
| B | 7169 | 210 | 2.929279% |
| C | 7169 | 41 | 0.571907% |
| D | 7169 | 87 | 1.213558% |
Noise dominated data is calculated using 1-second bins in cleaned event files. If a bin has >2000 counts, and if more than 50% of those come from <1% of pixels, then it is considered to be noise-dominated and hence unusable.
| Quadrant | # 1 sec bins | Bins with >0 counts | Bins with >2000 counts | High rate bins dominated by noise | Noise dominated (total time) | Noise dominated (detector-on time) | Marked lightcurve |
|---|---|---|---|---|---|---|---|
| A | 7339 | 7169 | 7 | 7 | 0.10% | 0.10% | 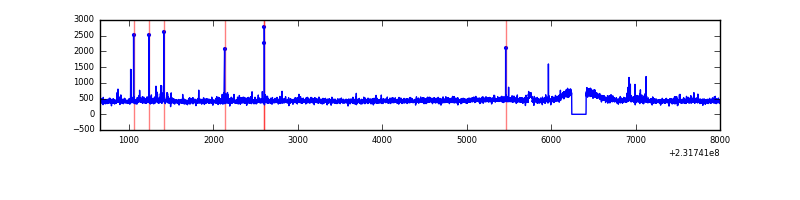 |
| B | 7339 | 7170 | 73 | 73 | 0.99% | 1.02% | 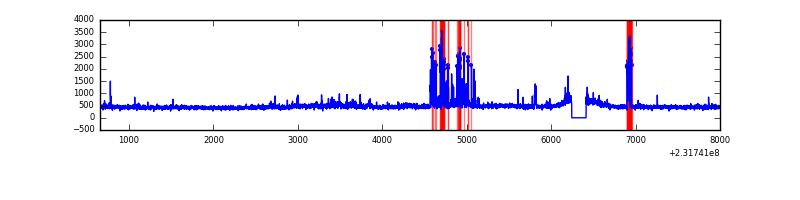 |
| C | 7339 | 7170 | 2 | 2 | 0.03% | 0.03% | 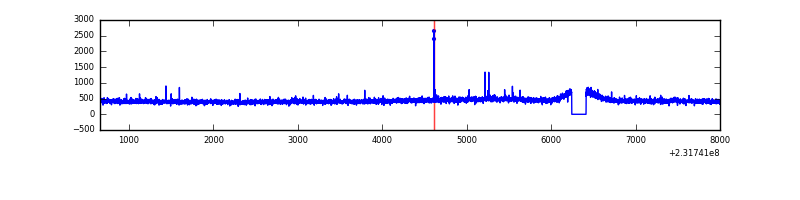 |
| D | 7339 | 7169 | 18 | 18 | 0.25% | 0.25% | 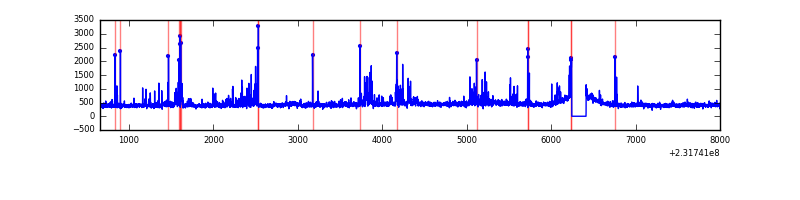 |
Top three noisy pixels from each quadrant. If the there are fewer than three noisy pixels in the level2.evt file, extra rows are filled as -1
| Pixel properties | Quadrant properties | ||||||
|---|---|---|---|---|---|---|---|
| Quadrant | DetID | PixID | Counts | Sigma | Mean | Median | Sigma |
| A | 13 | 251 | 68314 | 408.35 | 802 | 783 | 165.4 |
| A | 15 | 174 | 19293 | 111.93 | 802 | 783 | 165.4 |
| A | 13 | 248 | 16972 | 97.89 | 802 | 783 | 165.4 |
| B | 4 | 97 | 258170 | 1655.22 | 813 | 793 | 155.5 |
| B | 10 | 16 | 96812 | 617.51 | 813 | 793 | 155.5 |
| B | 0 | 219 | 45959 | 290.47 | 813 | 793 | 155.5 |
| C | 1 | 16 | 17688 | 92.58 | 785 | 786 | 182.6 |
| C | 13 | 61 | 6136 | 29.3 | 785 | 786 | 182.6 |
| C | 4 | 252 | 5359 | 25.05 | 785 | 786 | 182.6 |
| D | 2 | 152 | 179249 | 931.79 | 779 | 752 | 191.6 |
| D | 13 | 137 | 77460 | 400.43 | 779 | 752 | 191.6 |
| D | 9 | 64 | 36426 | 186.23 | 779 | 752 | 191.6 |
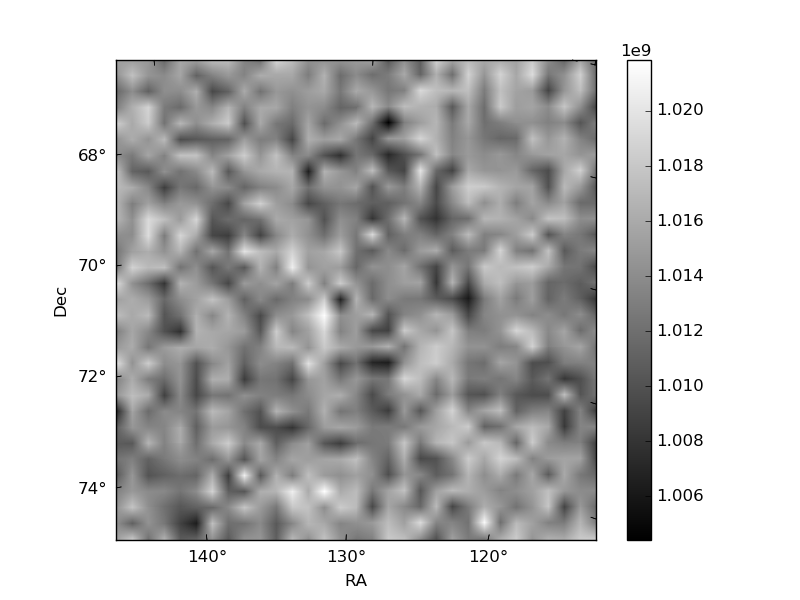
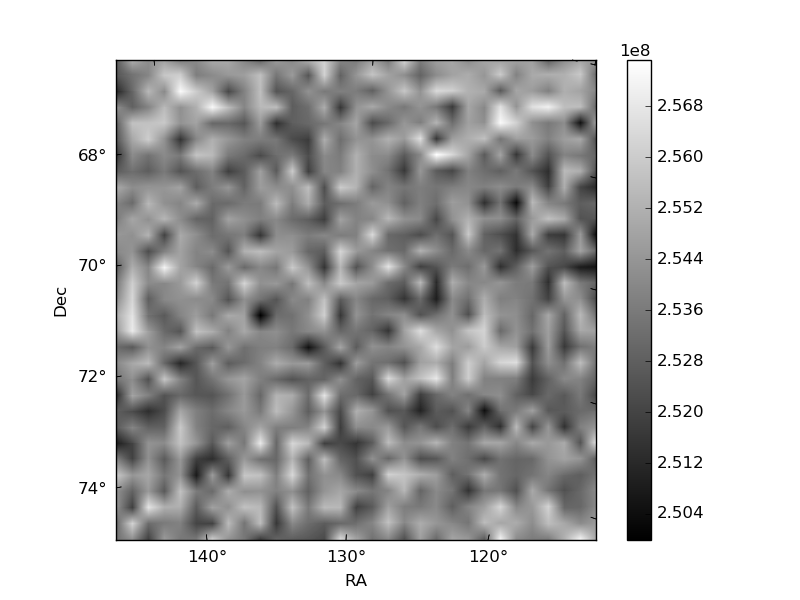
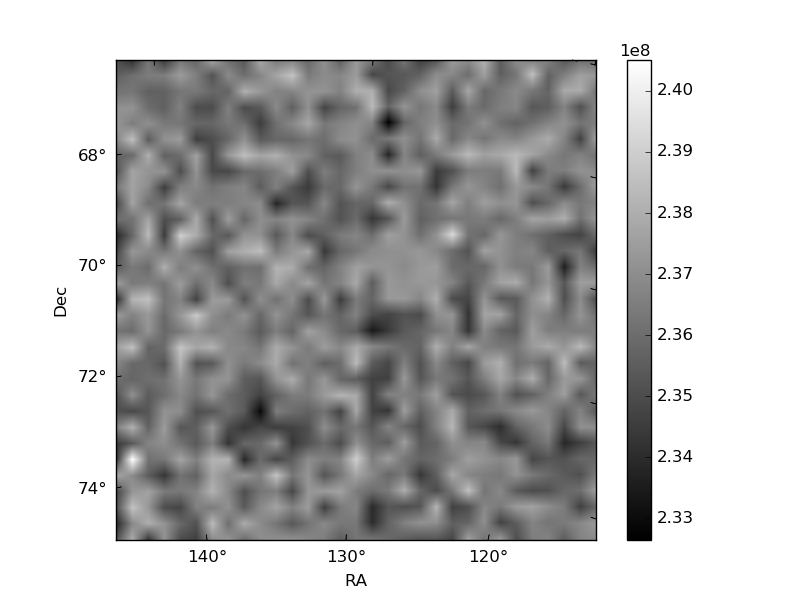
Histogram calculated using DETX and DETY for each event in the final _common_clean file
| Quadrant A | 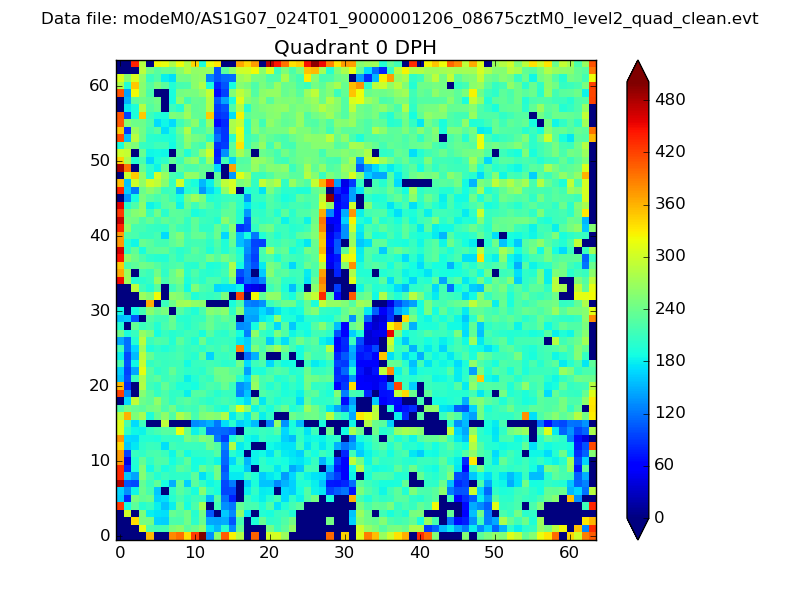 |
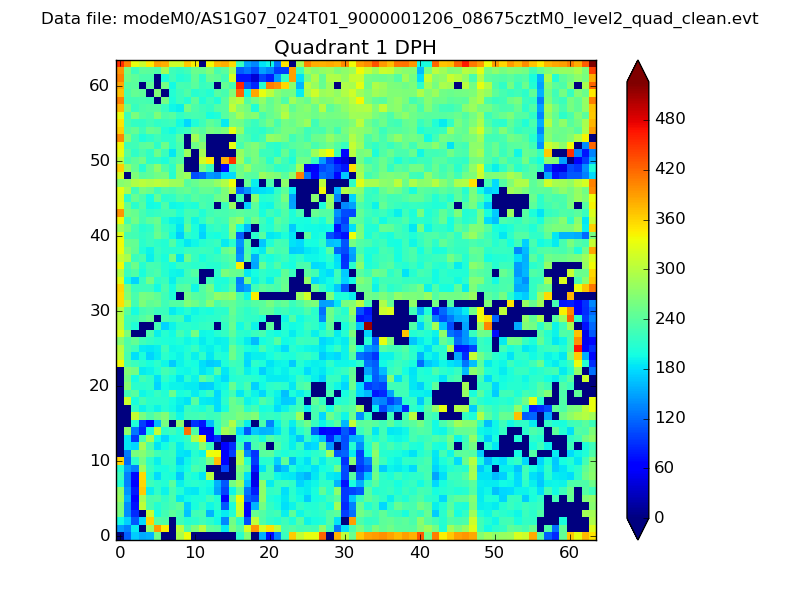 |
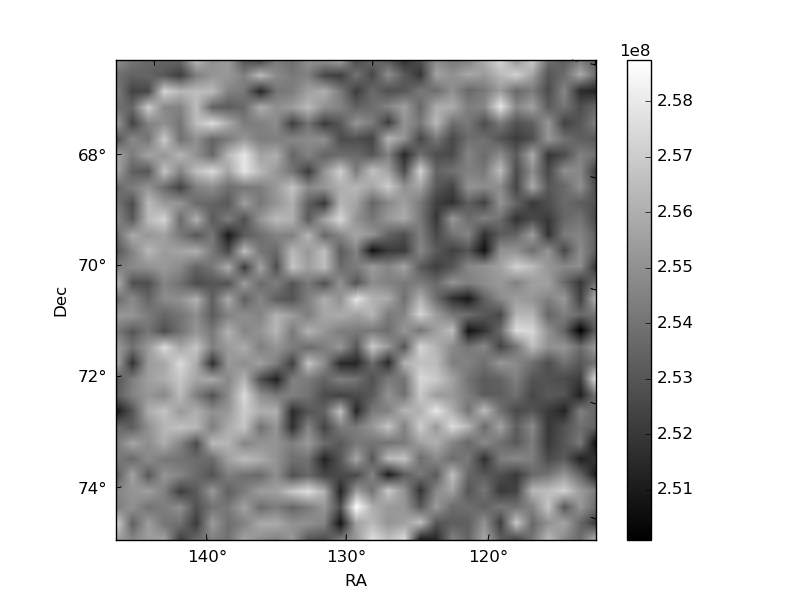
Quadrant B |
|---|---|---|---|
| Quadrant D | 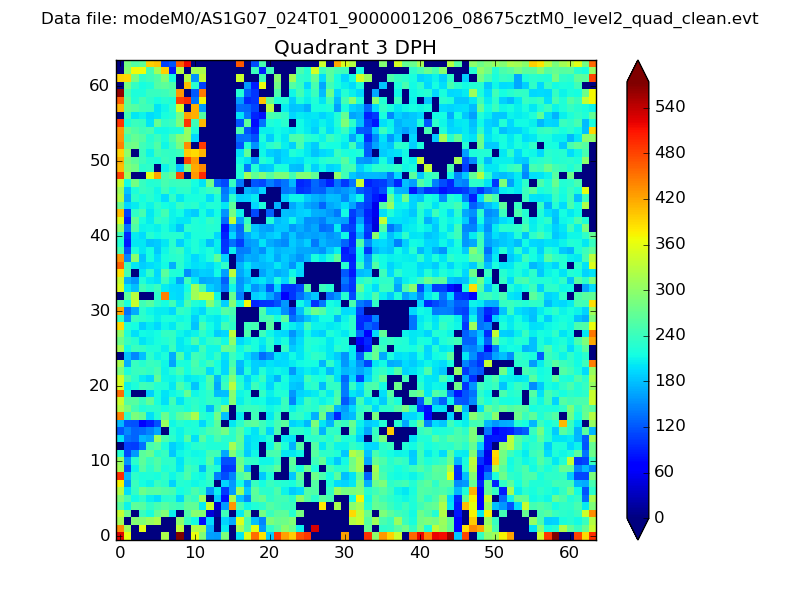 |
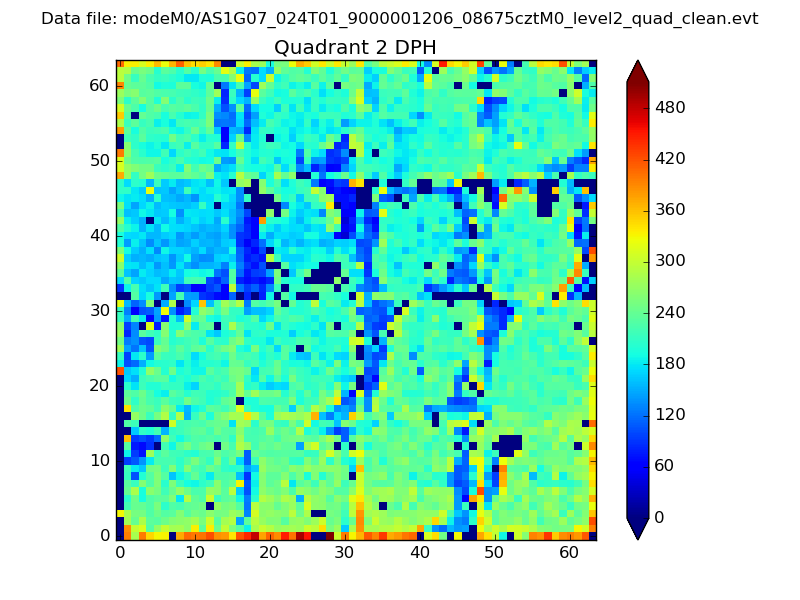 |
Quadrant C |
| Plot type | Count rate plots | Images |
|---|---|---|
| Comparison with Poisson distribution Blue bars denote a histogram of data divided into 1 sec bins. Red curve is a Poisson curve with rate = median count rate of data. |
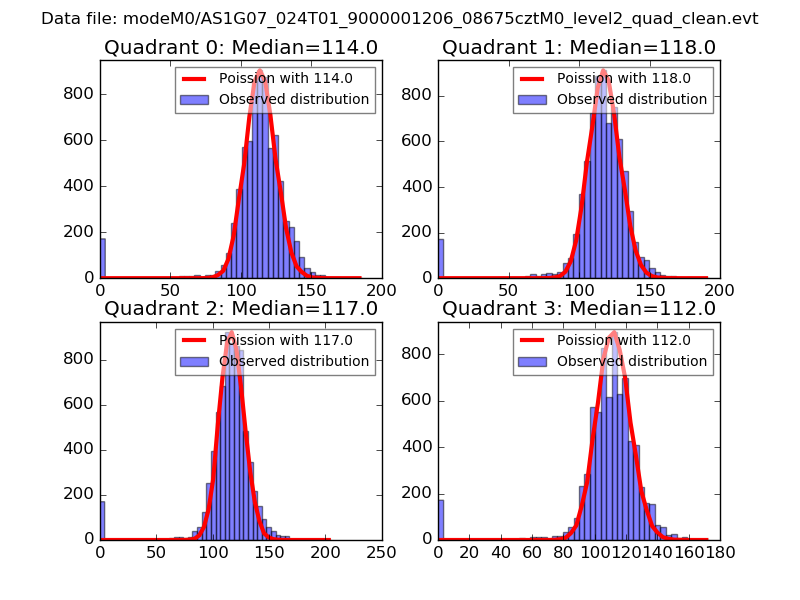 |
 |
| Quadrant-wise count rates Data is divided into 100 sec bins |
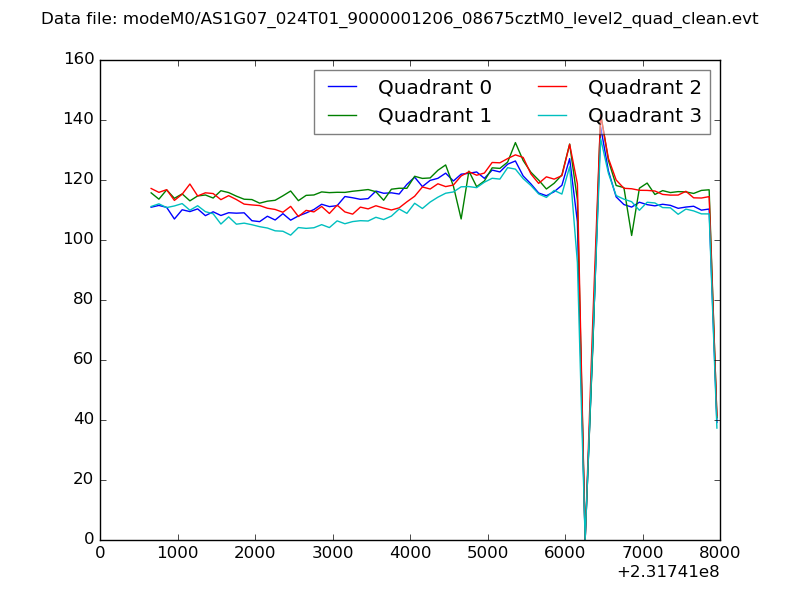 |
|
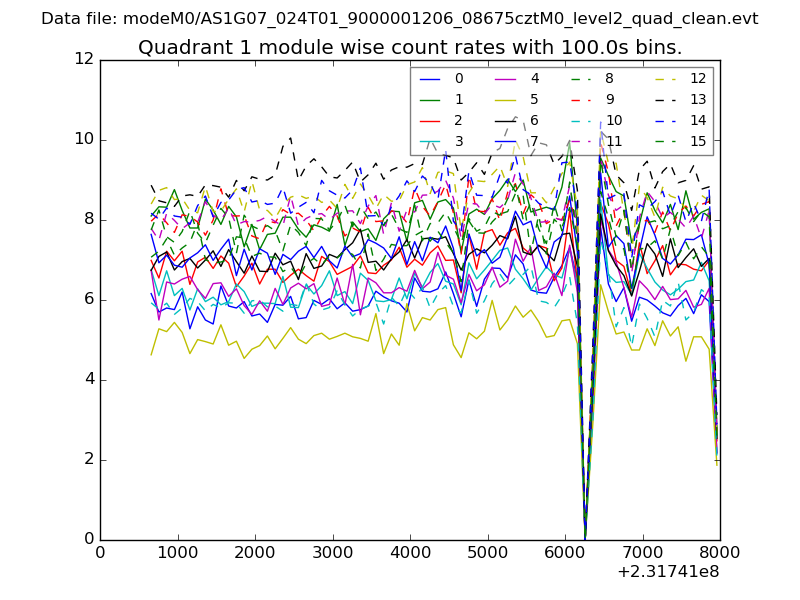
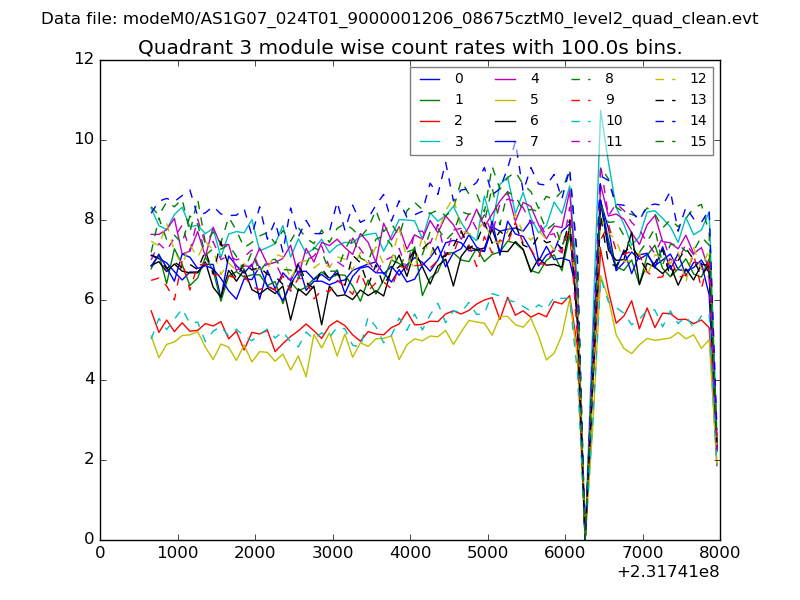
| Module-wise count rates for Quadrant A Data is divided into 100 sec bins |
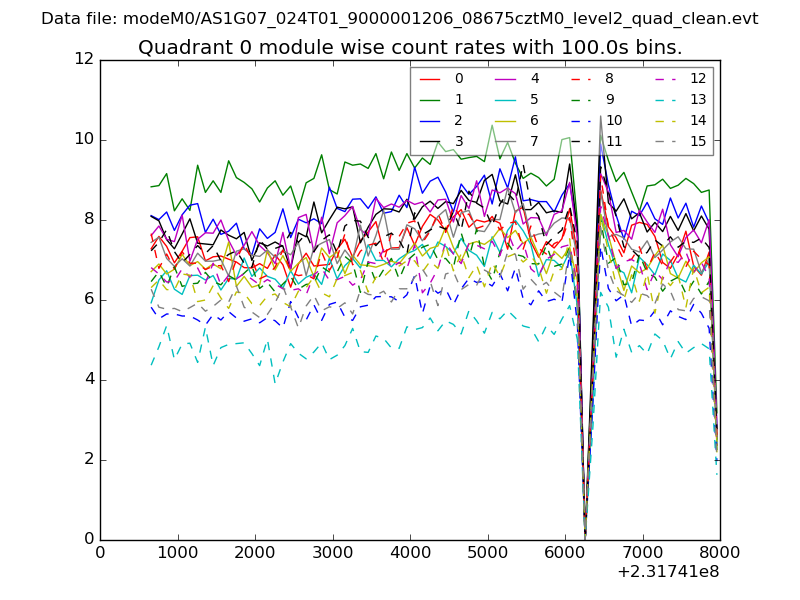 |
 |
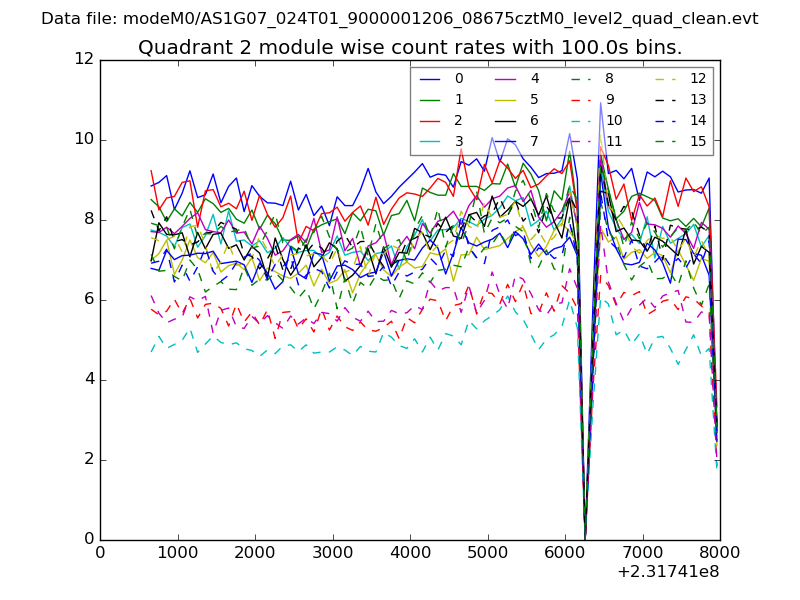
| Module-wise count rates for Quadrant B Data is divided into 100 sec bins |
 |
 |
| Module-wise count rates for Quadrant C Data is divided into 100 sec bins |
 |
 |
| Module-wise count rates for Quadrant D Data is divided into 100 sec bins |
 |
 |
| Parameter | Plot |
|---|---|
| CZT HV Monitor | 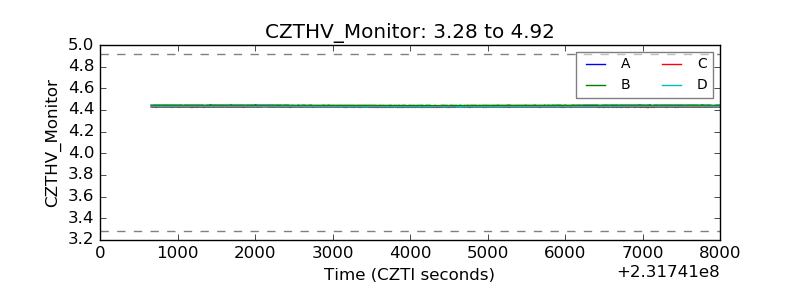 |
| D_VDD | 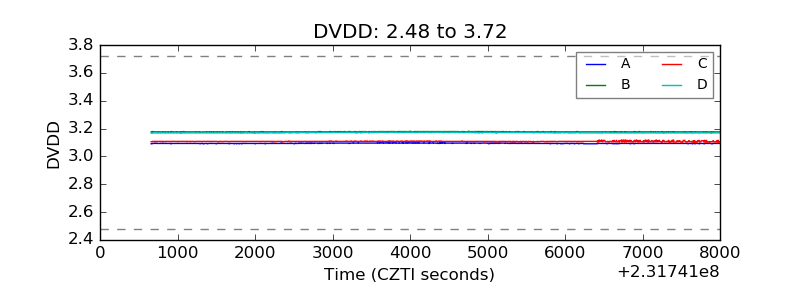 |
| Temperature 1 | 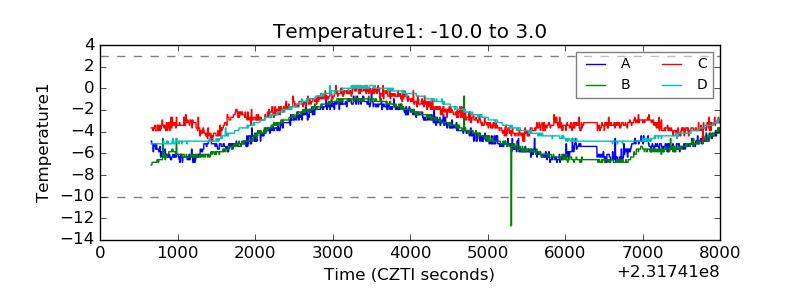 |
| Veto HV Monitor | 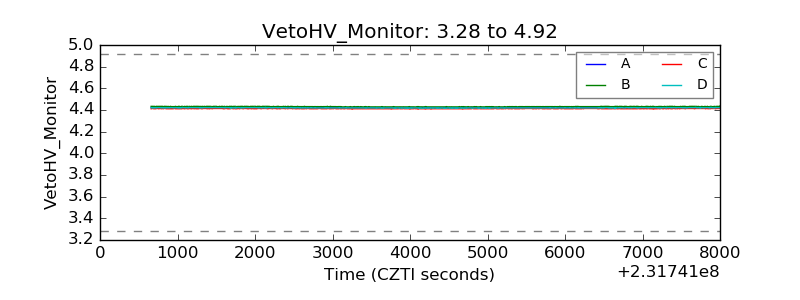 |
| Veto LLD | 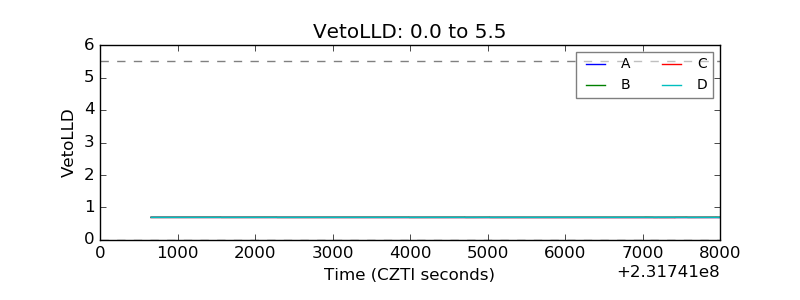 |
| Alpha Counter | 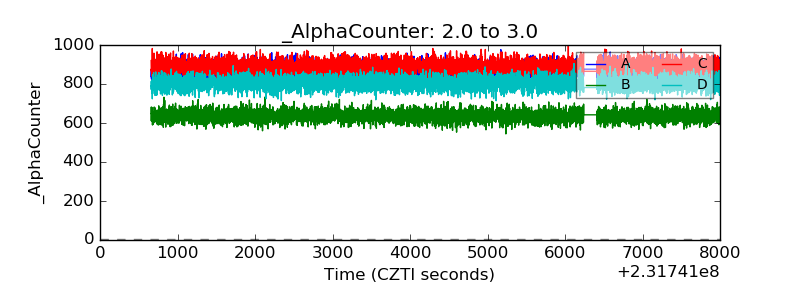 |
| _CPM_Rate | 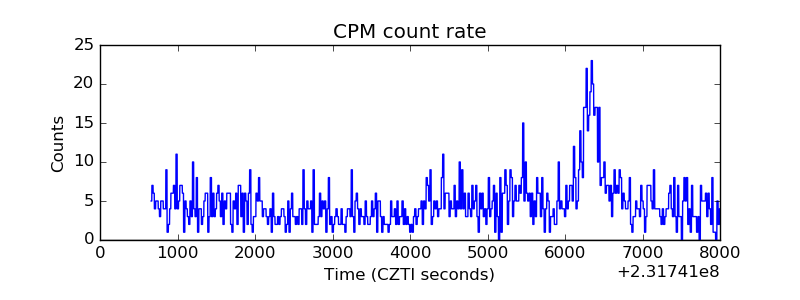 |
| CZT Counter | 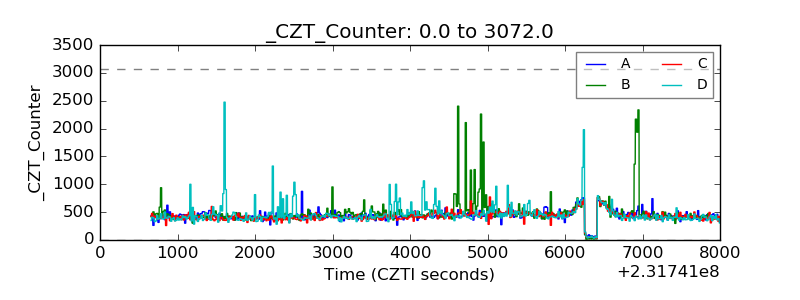 |
| +2.5 Volts monitor |  |
| +5 Volts monitor |  |
| _ROLL_ROT |  |
| _Roll_DEC | 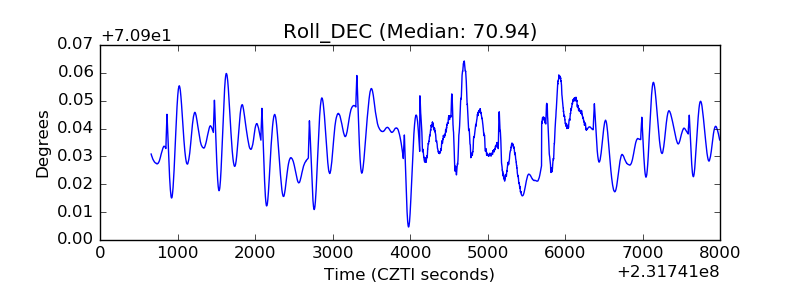 |
| _Roll_RA | 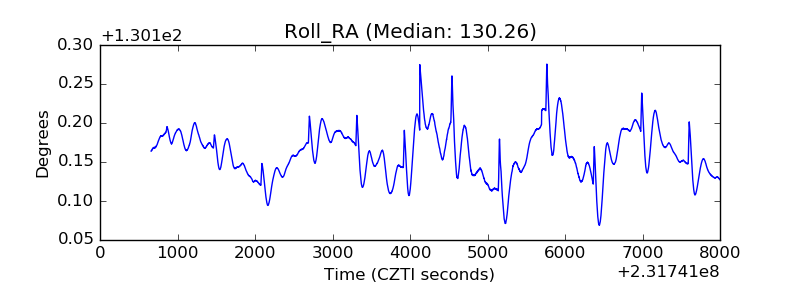 |
| Veto Counter | 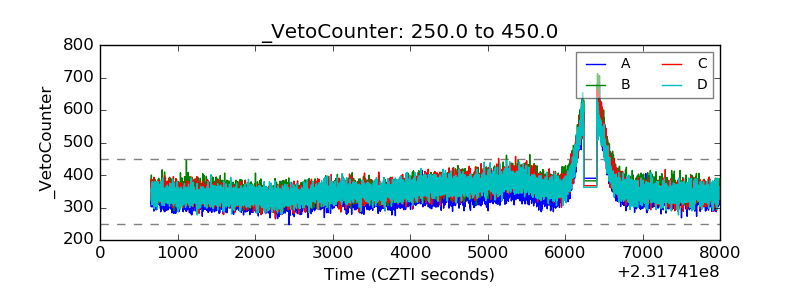 |