| Param | Original file | Final file |
|---|---|---|
| Filename | modeM0/AS1G07_024T01_9000001206_08678cztM0_level2.evt | modeM0/AS1G07_024T01_9000001206_08678cztM0_level2_quad_clean.evt |
| Size (bytes) | 1,193,497,920 | 325,560,960 |
| Size | 1.1 GB | 310.5 MB |
| Events in quadrant A | 8,794,560 | 2,143,861 |
| Events in quadrant B | 9,219,652 | 2,205,415 |
| Events in quadrant C | 8,059,914 | 2,163,397 |
| Events in quadrant D | 8,814,491 | 2,069,678 |
| Mode M0 | |||
|---|---|---|---|
| Quadrant | BADHDUFLAG | Total packets | Discarded packets |
| A | 0 | 39170 | 4 |
| B | 0 | 39961 | 3 |
| C | 0 | 37619 | 3 |
| D | 0 | 40009 | 3 |
| Mode M9 | |||
|---|---|---|---|
| Quadrant | BADHDUFLAG | Total packets | Discarded packets |
| A | 0 | 19 | 0 |
| B | 0 | 19 | 0 |
| C | 0 | 19 | 0 |
| D | 0 | 19 | 0 |
| Mode SS | |||
|---|---|---|---|
| Quadrant | BADHDUFLAG | Total packets | Discarded packets |
| A | 0 | 376 | 0 |
| B | 0 | 376 | 0 |
| C | 0 | 376 | 0 |
| D | 0 | 376 | 0 |
| Quadrant | Total seconds | Saturated seconds | Saturation percentage |
|---|---|---|---|
| A | 18568 | 240 | 1.292546% |
| B | 18568 | 228 | 1.227919% |
| C | 18568 | 63 | 0.339293% |
| D | 18568 | 229 | 1.233305% |
Noise dominated data is calculated using 1-second bins in cleaned event files. If a bin has >2000 counts, and if more than 50% of those come from <1% of pixels, then it is considered to be noise-dominated and hence unusable.
| Quadrant | # 1 sec bins | Bins with >0 counts | Bins with >2000 counts | High rate bins dominated by noise | Noise dominated (total time) | Noise dominated (detector-on time) | Marked lightcurve |
|---|---|---|---|---|---|---|---|
| A | 20458 | 18568 | 66 | 66 | 0.32% | 0.36% | 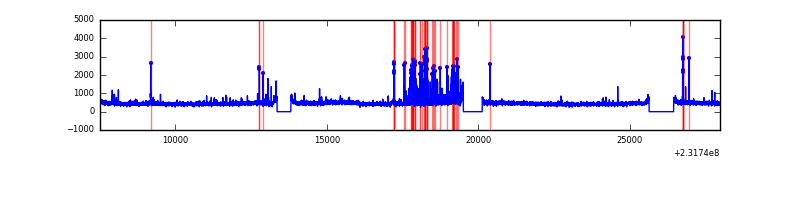 |
| B | 20458 | 18569 | 99 | 99 | 0.48% | 0.53% | 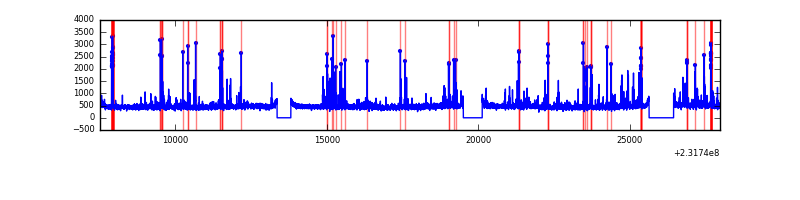 |
| C | 20458 | 18570 | 1 | 1 | 0.00% | 0.01% | 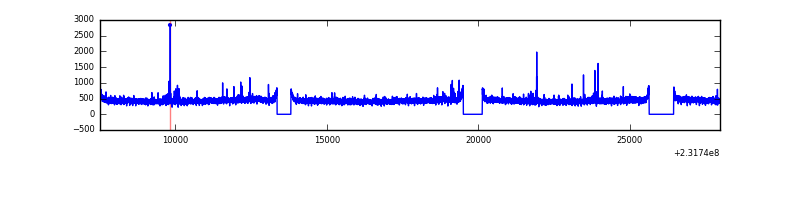 |
| D | 20458 | 18569 | 115 | 115 | 0.56% | 0.62% | 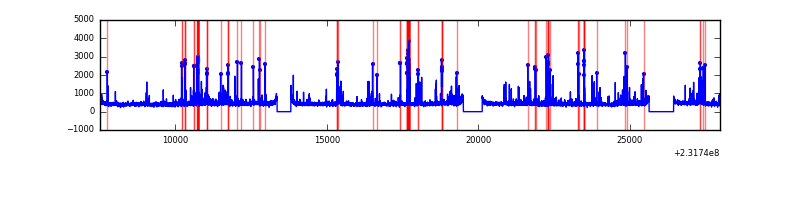 |
Top three noisy pixels from each quadrant. If the there are fewer than three noisy pixels in the level2.evt file, extra rows are filled as -1
| Pixel properties | Quadrant properties | ||||||
|---|---|---|---|---|---|---|---|
| Quadrant | DetID | PixID | Counts | Sigma | Mean | Median | Sigma |
| A | 15 | 223 | 259400 | 606.43 | 2089 | 2038 | 424.4 |
| A | 15 | 239 | 128482 | 297.94 | 2089 | 2038 | 424.4 |
| A | 15 | 174 | 104974 | 242.55 | 2089 | 2038 | 424.4 |
| B | 10 | 16 | 548943 | 1368.51 | 2113 | 2060 | 399.6 |
| B | 4 | 80 | 85531 | 208.88 | 2113 | 2060 | 399.6 |
| B | 4 | 173 | 70026 | 170.08 | 2113 | 2060 | 399.6 |
| C | 4 | 254 | 50016 | 102.7 | 2037 | 2041 | 467.1 |
| C | 1 | 16 | 32337 | 64.85 | 2037 | 2041 | 467.1 |
| C | 13 | 61 | 15791 | 29.43 | 2037 | 2041 | 467.1 |
| D | 10 | 253 | 211285 | 422.4 | 2037 | 1973 | 495.5 |
| D | 2 | 152 | 205739 | 411.21 | 2037 | 1973 | 495.5 |
| D | 12 | 233 | 202195 | 404.06 | 2037 | 1973 | 495.5 |
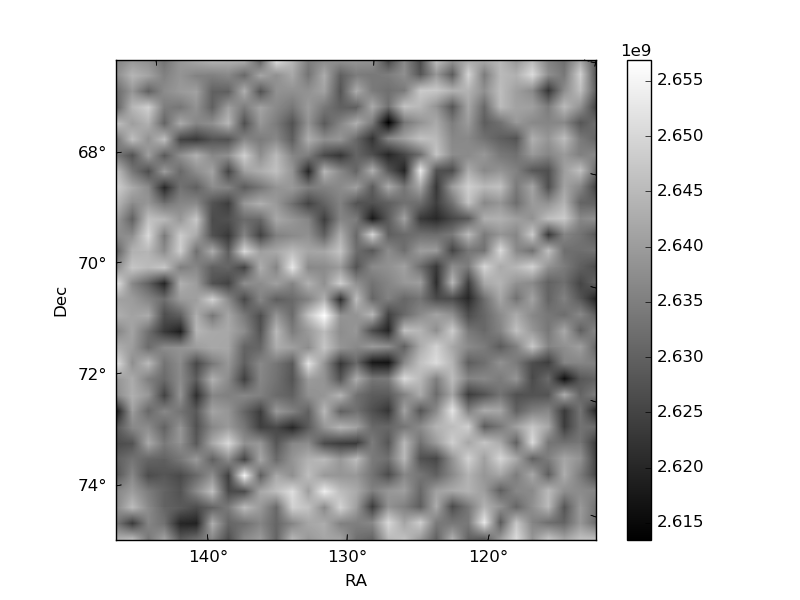
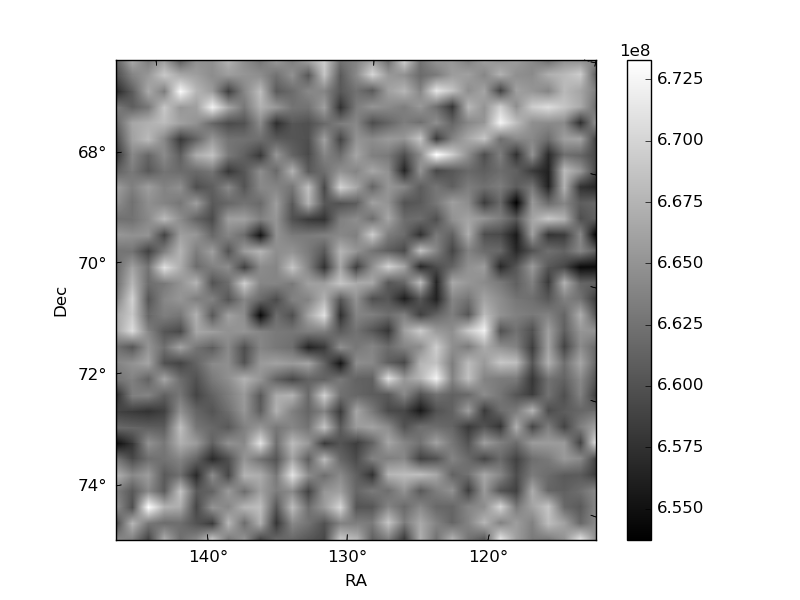
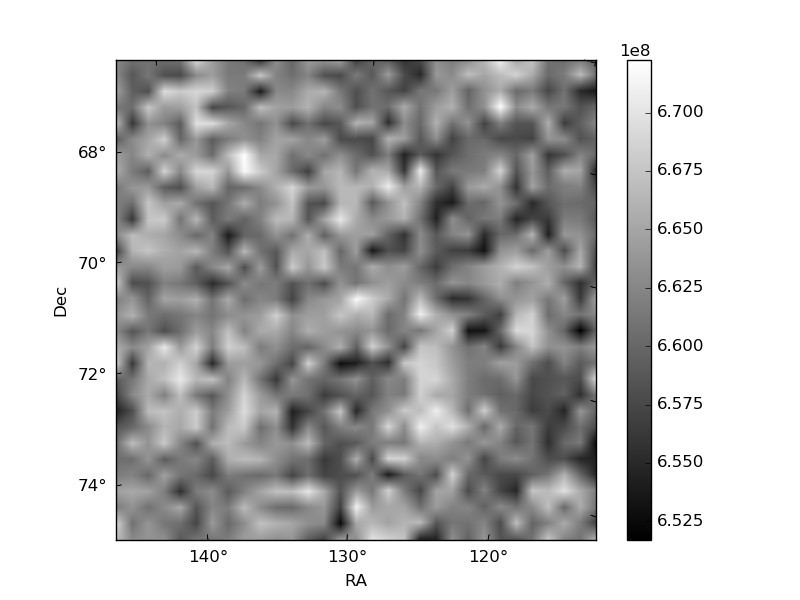
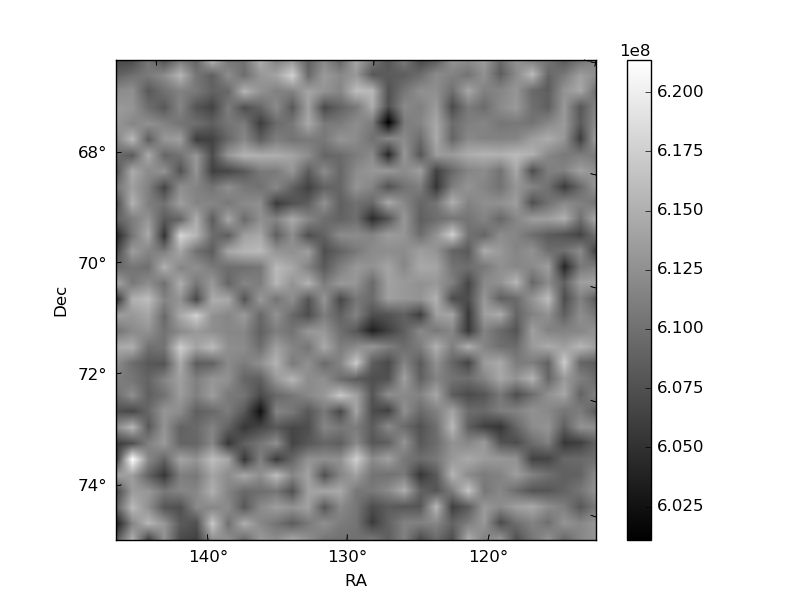
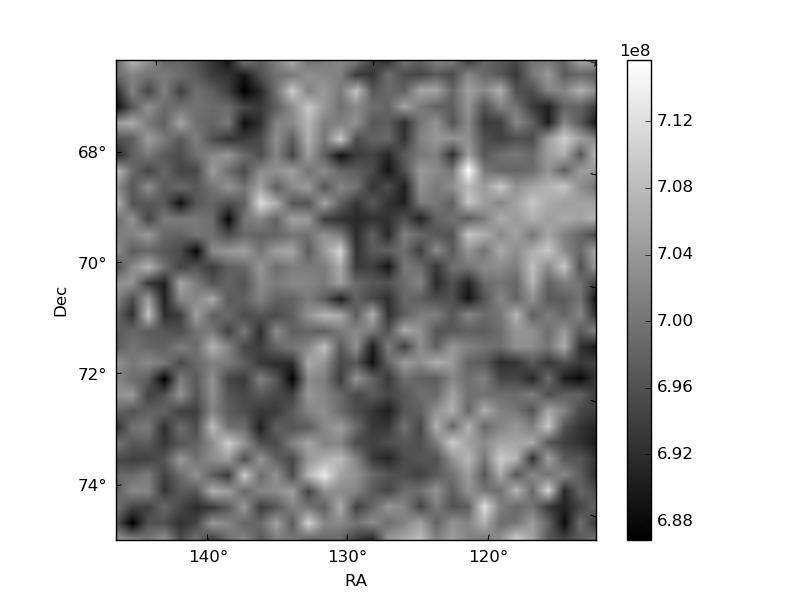
Histogram calculated using DETX and DETY for each event in the final _common_clean file
| Quadrant A | 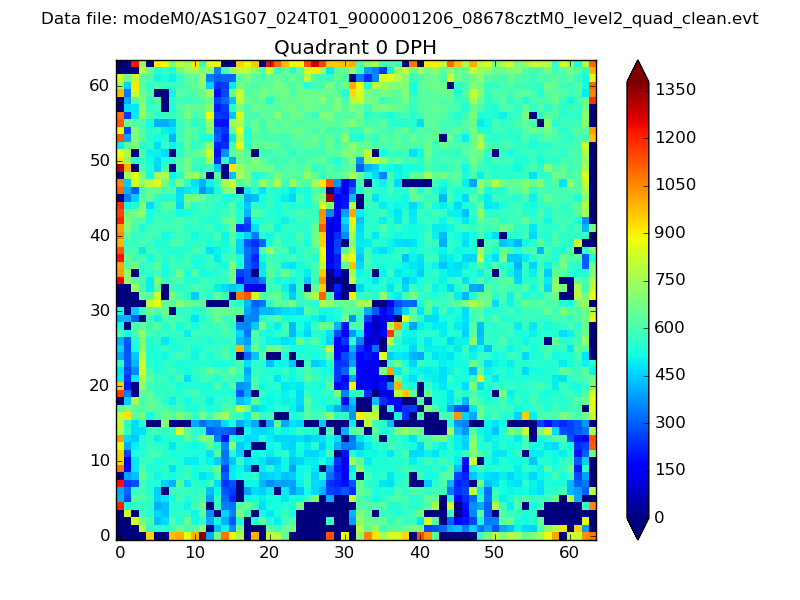 |
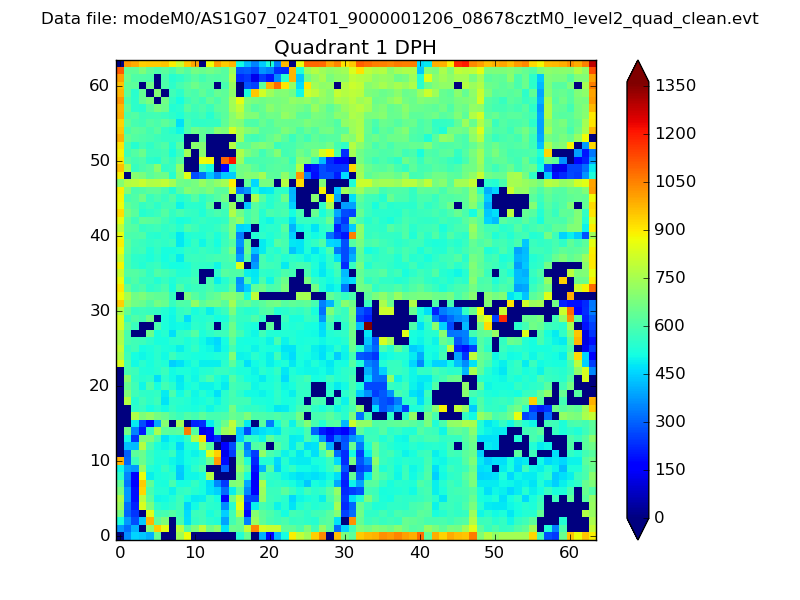 |
Quadrant B |
|---|---|---|---|
| Quadrant D | 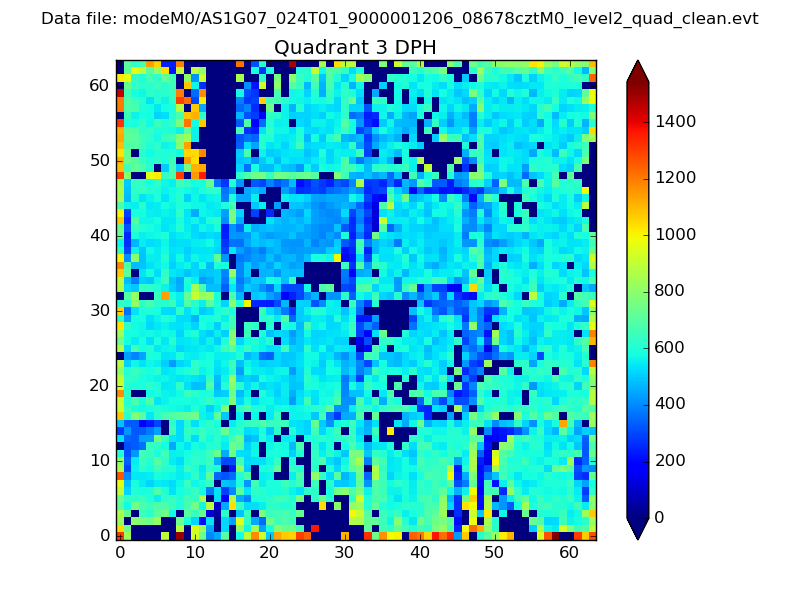 |
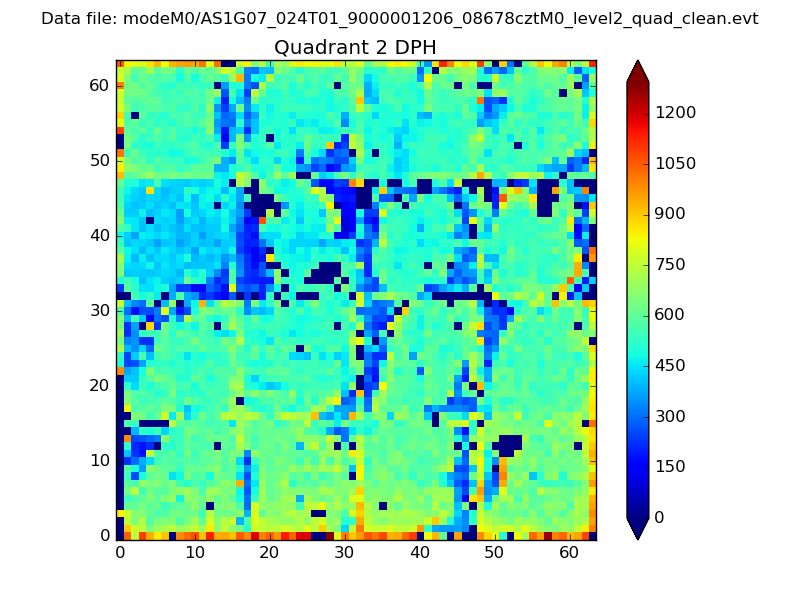 |
Quadrant C |
| Plot type | Count rate plots | Images |
|---|---|---|
| Comparison with Poisson distribution Blue bars denote a histogram of data divided into 1 sec bins. Red curve is a Poisson curve with rate = median count rate of data. |
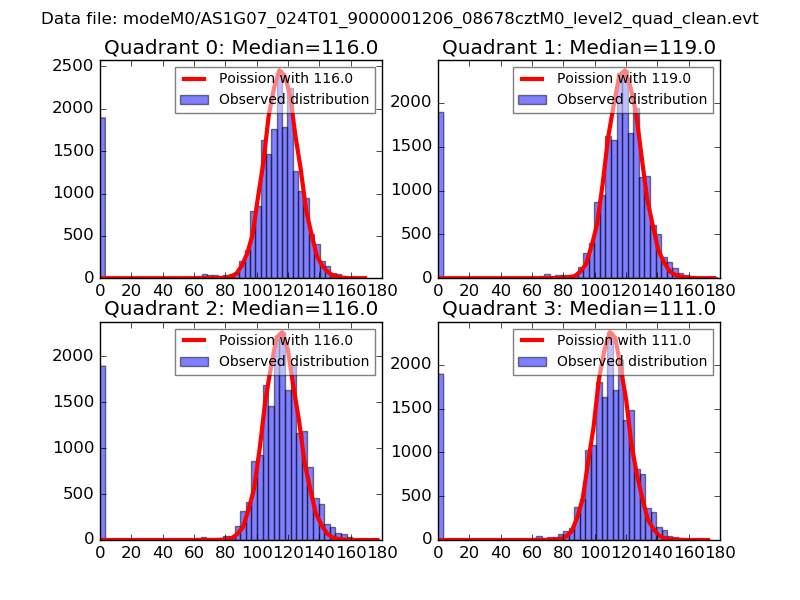 |
 |
| Quadrant-wise count rates Data is divided into 100 sec bins |
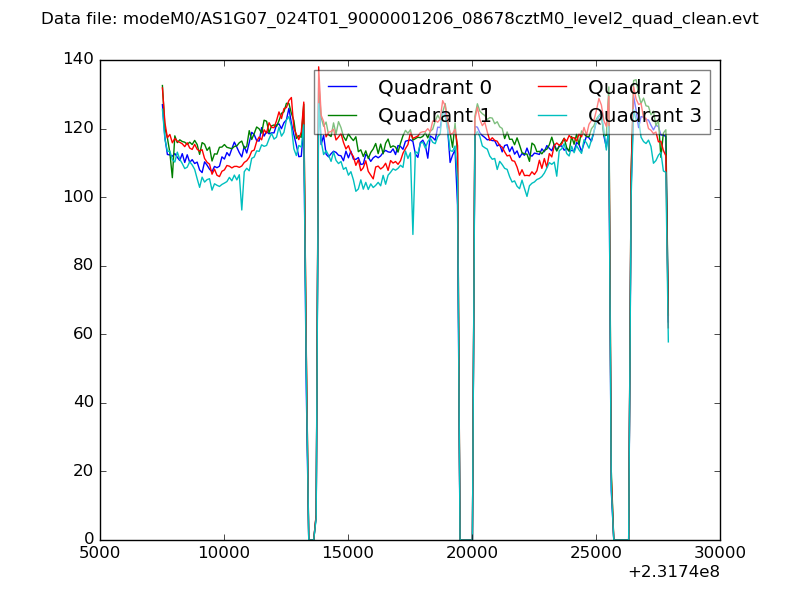 |
|
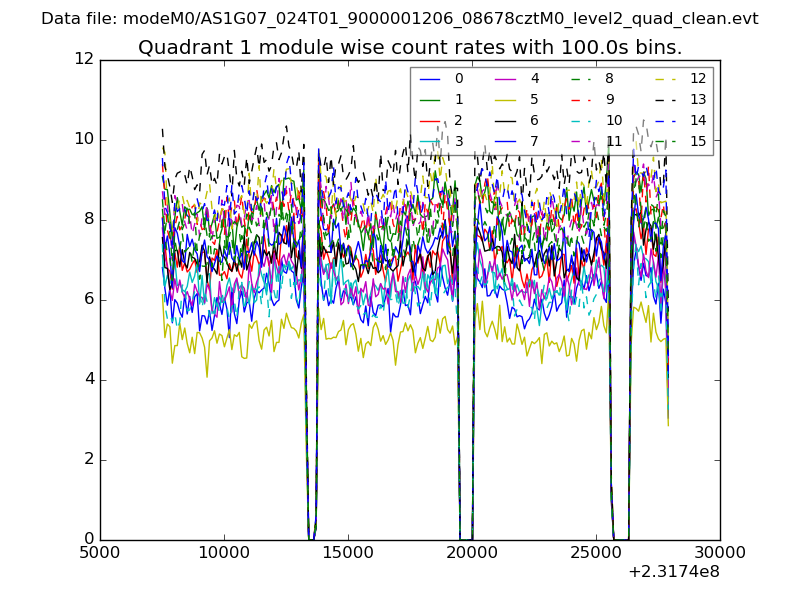
| Module-wise count rates for Quadrant A Data is divided into 100 sec bins |
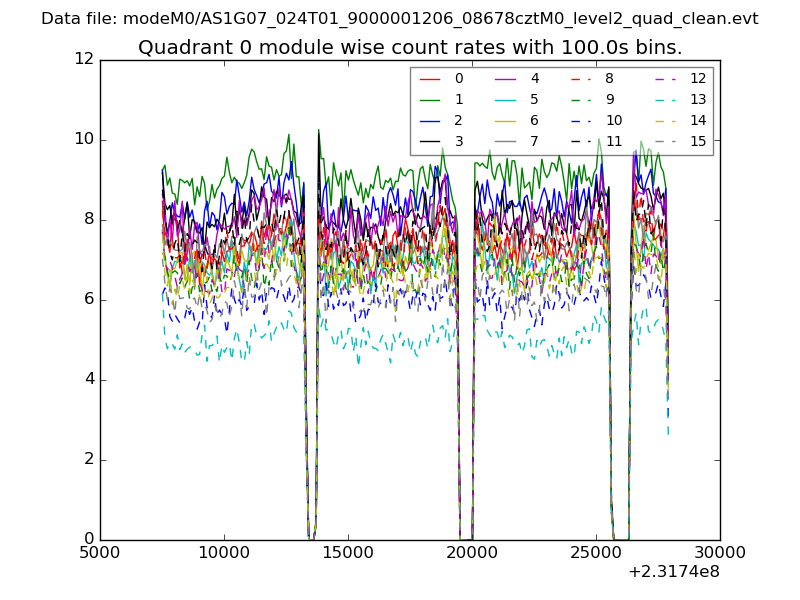 |
 |
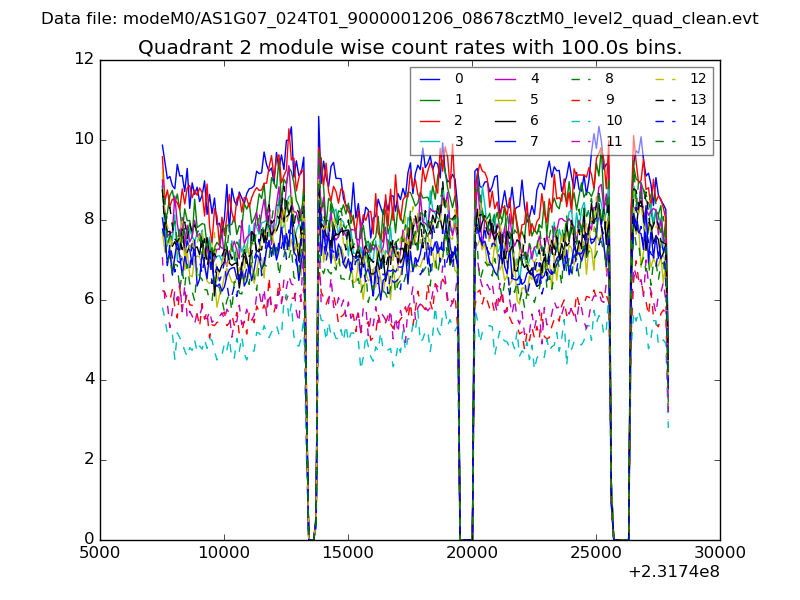
| Module-wise count rates for Quadrant B Data is divided into 100 sec bins |
 |
 |
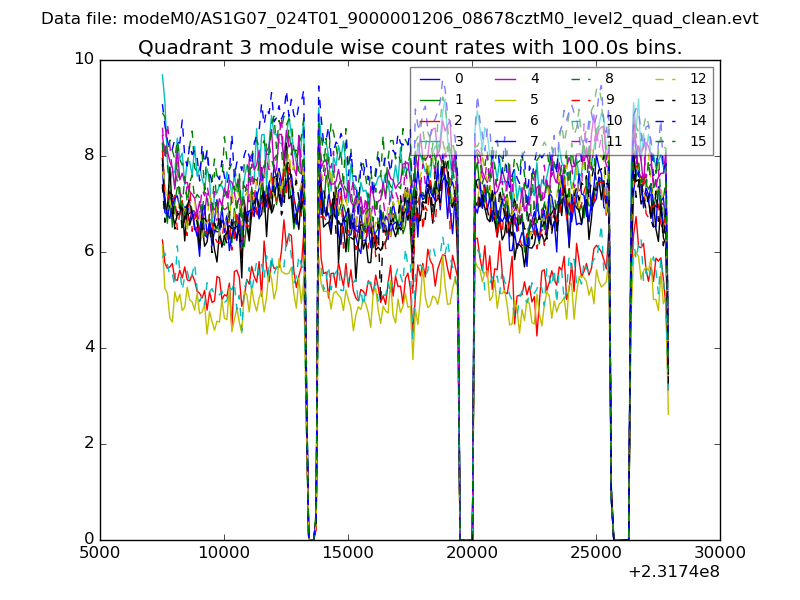
| Module-wise count rates for Quadrant C Data is divided into 100 sec bins |
 |
 |
| Module-wise count rates for Quadrant D Data is divided into 100 sec bins |
 |
 |
| Parameter | Plot |
|---|---|
| CZT HV Monitor | 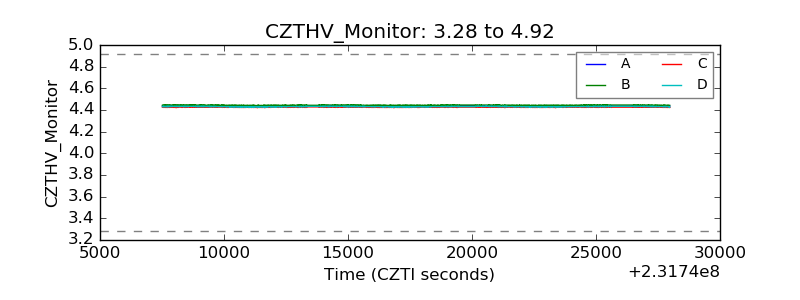 |
| D_VDD | 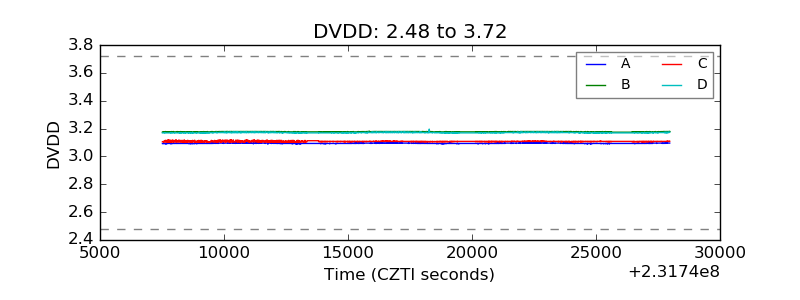 |
| Temperature 1 | 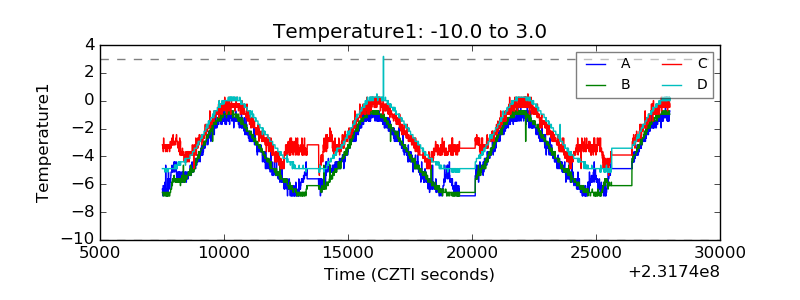 |
| Veto HV Monitor | 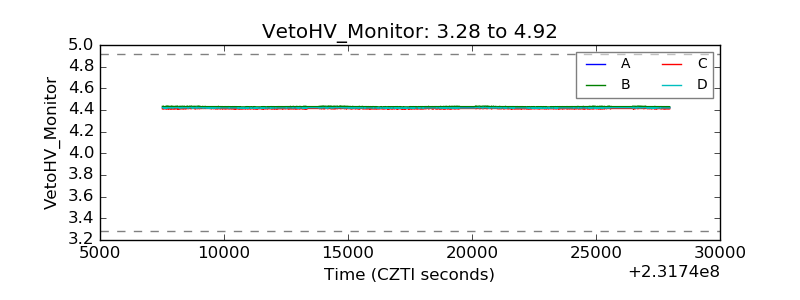 |
| Veto LLD | 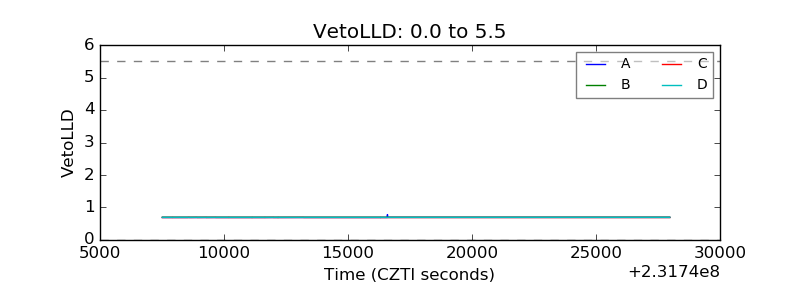 |
| Alpha Counter | 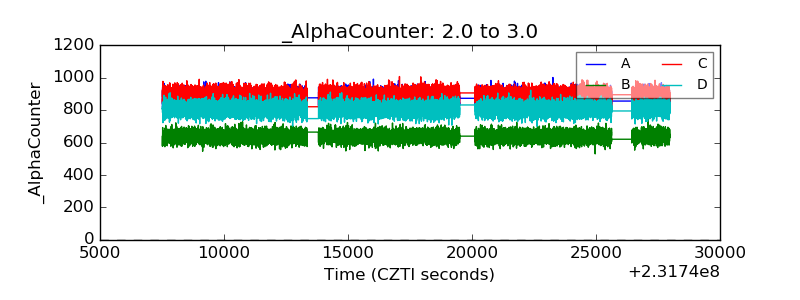 |
| _CPM_Rate | 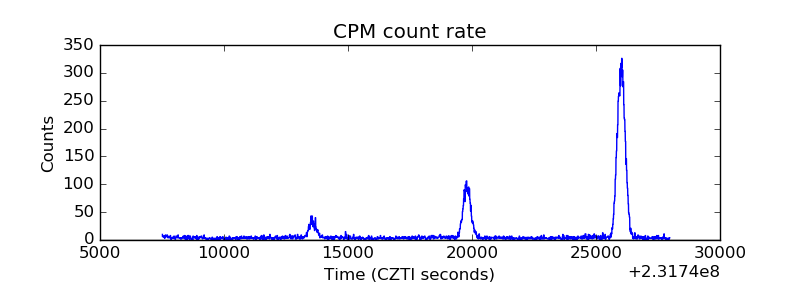 |
| CZT Counter | 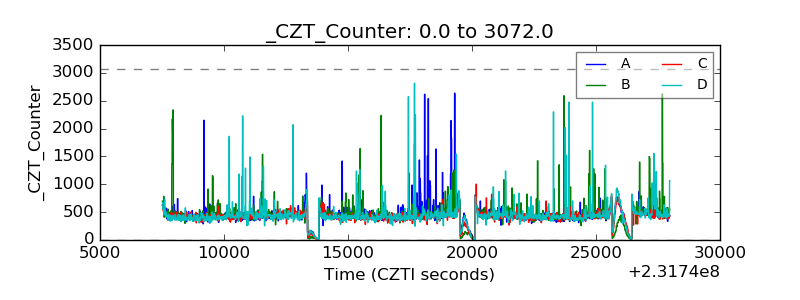 |
| +2.5 Volts monitor | 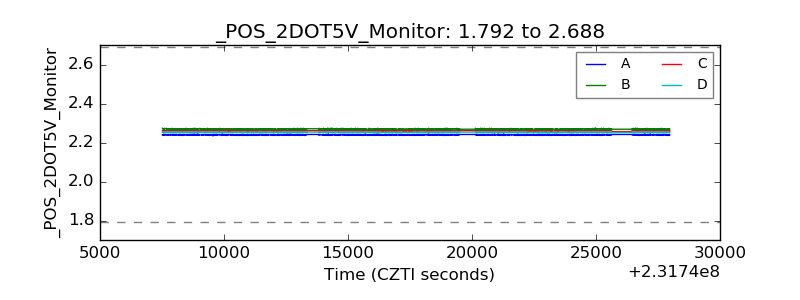 |
| +5 Volts monitor | 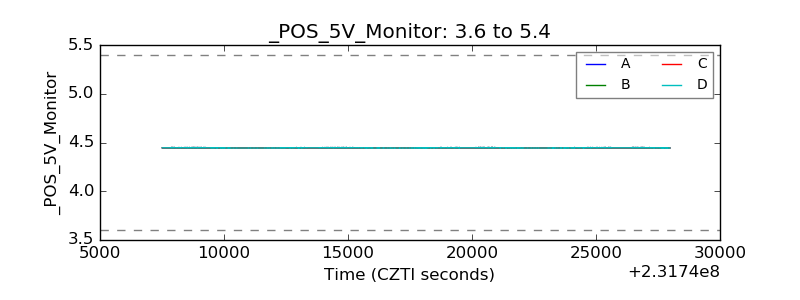 |
| _ROLL_ROT | 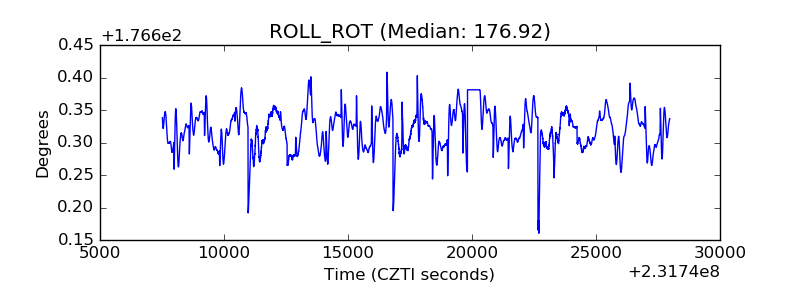 |
| _Roll_DEC | 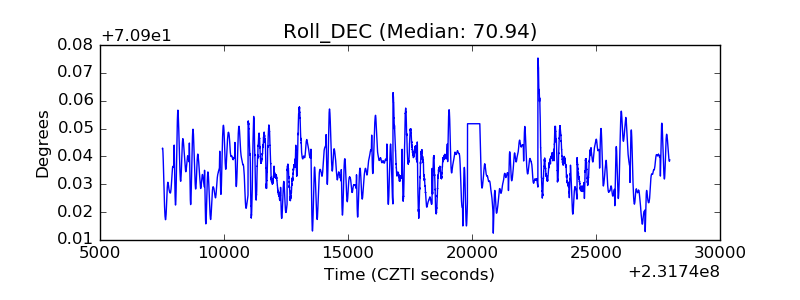 |
| _Roll_RA | 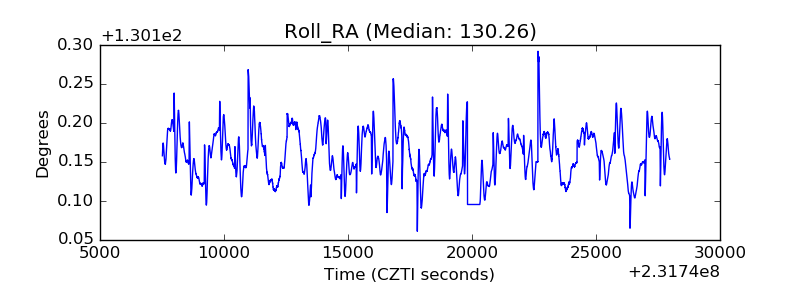 |
| Veto Counter | 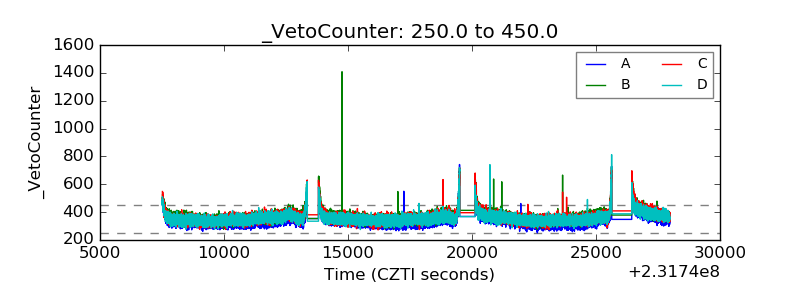 |