| Param | Original file | Final file |
|---|---|---|
| Filename | modeM0/AS1G07_024T01_9000001206_08679cztM0_level2.evt | modeM0/AS1G07_024T01_9000001206_08679cztM0_level2_quad_clean.evt |
| Size (bytes) | 412,300,800 | 110,880,000 |
| Size | 393.2 MB | 105.7 MB |
| Events in quadrant A | 2,777,053 | 739,312 |
| Events in quadrant B | 3,310,862 | 748,989 |
| Events in quadrant C | 2,741,330 | 735,493 |
| Events in quadrant D | 3,238,120 | 704,232 |
| Mode M0 | |||
|---|---|---|---|
| Quadrant | BADHDUFLAG | Total packets | Discarded packets |
| A | 0 | 12711 | 2 |
| B | 0 | 13893 | 1 |
| C | 0 | 12602 | 3 |
| D | 0 | 14096 | 3 |
| Mode M9 | |||
|---|---|---|---|
| Quadrant | BADHDUFLAG | Total packets | Discarded packets |
| A | 0 | 10 | 0 |
| B | 0 | 10 | 0 |
| C | 0 | 10 | 0 |
| D | 0 | 10 | 0 |
| Mode SS | |||
|---|---|---|---|
| Quadrant | BADHDUFLAG | Total packets | Discarded packets |
| A | 0 | 124 | 0 |
| B | 0 | 124 | 0 |
| C | 0 | 124 | 0 |
| D | 0 | 124 | 0 |
| Quadrant | Total seconds | Saturated seconds | Saturation percentage |
|---|---|---|---|
| A | 6165 | 49 | 0.794809% |
| B | 6165 | 89 | 1.443633% |
| C | 6164 | 38 | 0.616483% |
| D | 6164 | 152 | 2.465931% |
Noise dominated data is calculated using 1-second bins in cleaned event files. If a bin has >2000 counts, and if more than 50% of those come from <1% of pixels, then it is considered to be noise-dominated and hence unusable.
| Quadrant | # 1 sec bins | Bins with >0 counts | Bins with >2000 counts | High rate bins dominated by noise | Noise dominated (total time) | Noise dominated (detector-on time) | Marked lightcurve |
|---|---|---|---|---|---|---|---|
| A | 7125 | 6165 | 3 | 3 | 0.04% | 0.05% | 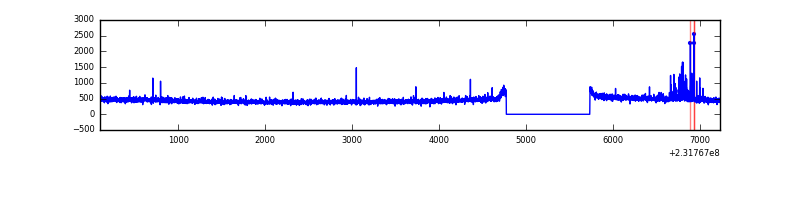 |
| B | 7125 | 6165 | 46 | 46 | 0.65% | 0.75% | 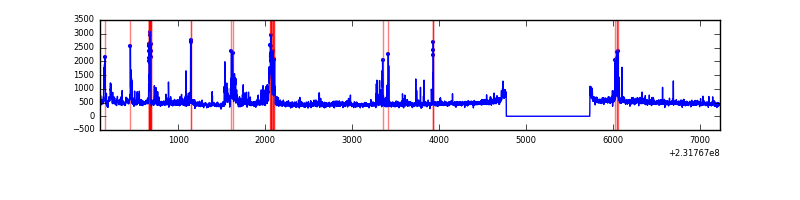 |
| C | 7125 | 6165 | 9 | 9 | 0.13% | 0.15% | 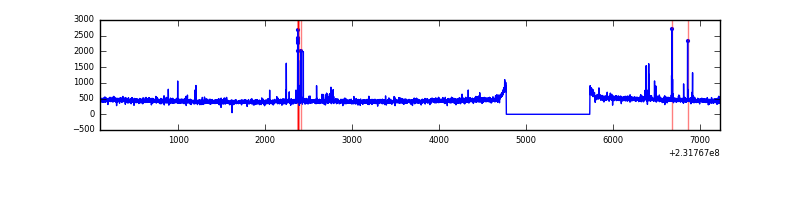 |
| D | 7125 | 6165 | 94 | 94 | 1.32% | 1.52% | 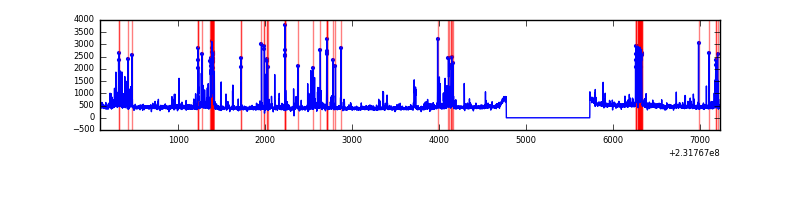 |
Top three noisy pixels from each quadrant. If the there are fewer than three noisy pixels in the level2.evt file, extra rows are filled as -1
| Pixel properties | Quadrant properties | ||||||
|---|---|---|---|---|---|---|---|
| Quadrant | DetID | PixID | Counts | Sigma | Mean | Median | Sigma |
| A | 8 | 5 | 53456 | 364.47 | 704 | 687 | 144.8 |
| A | 0 | 226 | 6627 | 41.03 | 704 | 687 | 144.8 |
| A | 12 | 194 | 6234 | 38.31 | 704 | 687 | 144.8 |
| B | 10 | 16 | 291420 | 2154.17 | 707 | 689 | 135.0 |
| B | 0 | 219 | 85902 | 631.39 | 707 | 689 | 135.0 |
| B | 10 | 246 | 84208 | 618.83 | 707 | 689 | 135.0 |
| C | 1 | 16 | 62274 | 390.67 | 684 | 684 | 157.7 |
| C | 13 | 61 | 5274 | 29.11 | 684 | 684 | 157.7 |
| C | 8 | 222 | 5174 | 28.48 | 684 | 684 | 157.7 |
| D | 12 | 233 | 350699 | 2096.5 | 682 | 660 | 167.0 |
| D | 2 | 152 | 136676 | 814.64 | 682 | 660 | 167.0 |
| D | 10 | 253 | 81881 | 486.46 | 682 | 660 | 167.0 |
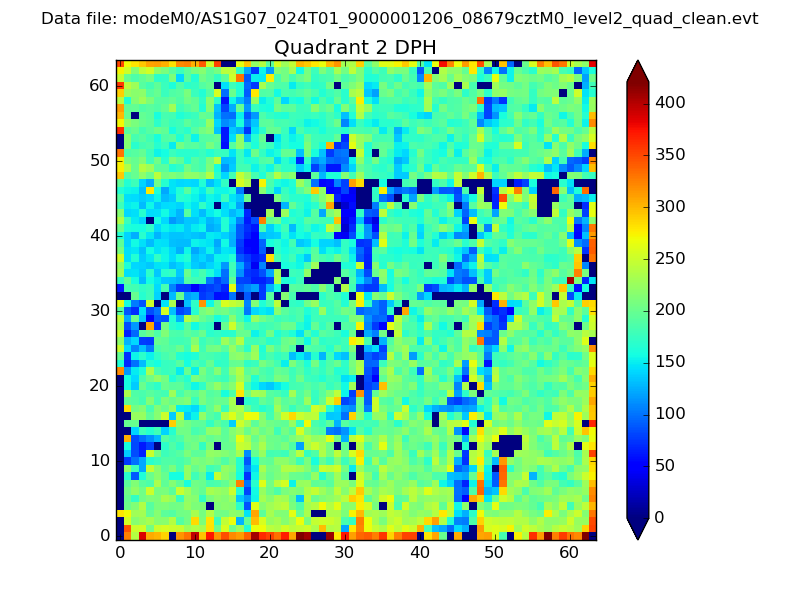
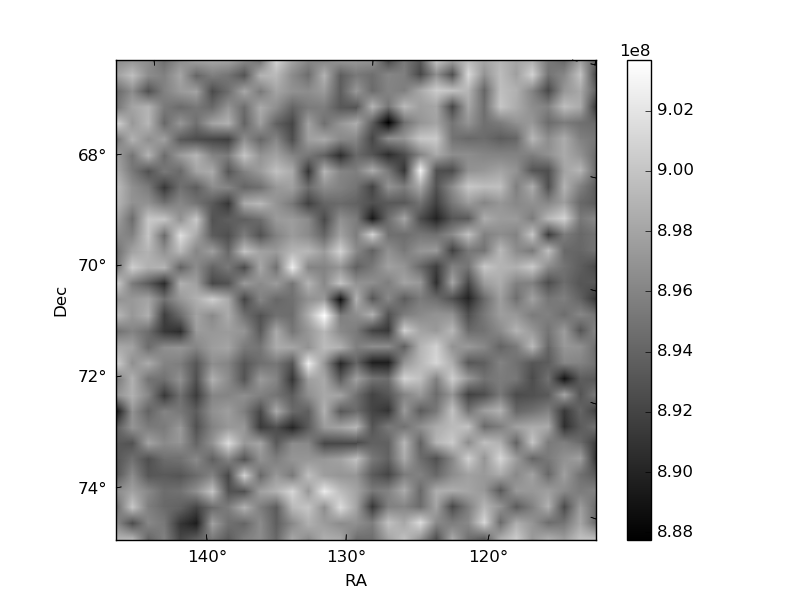
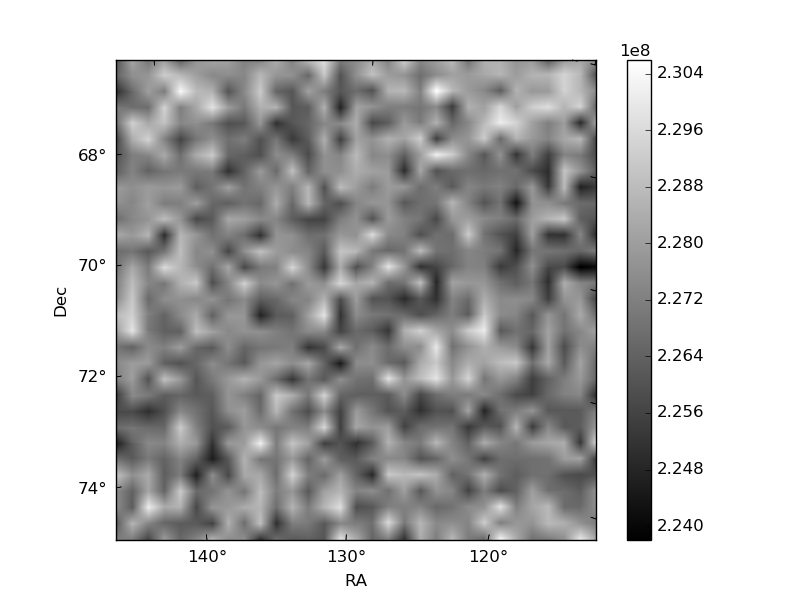
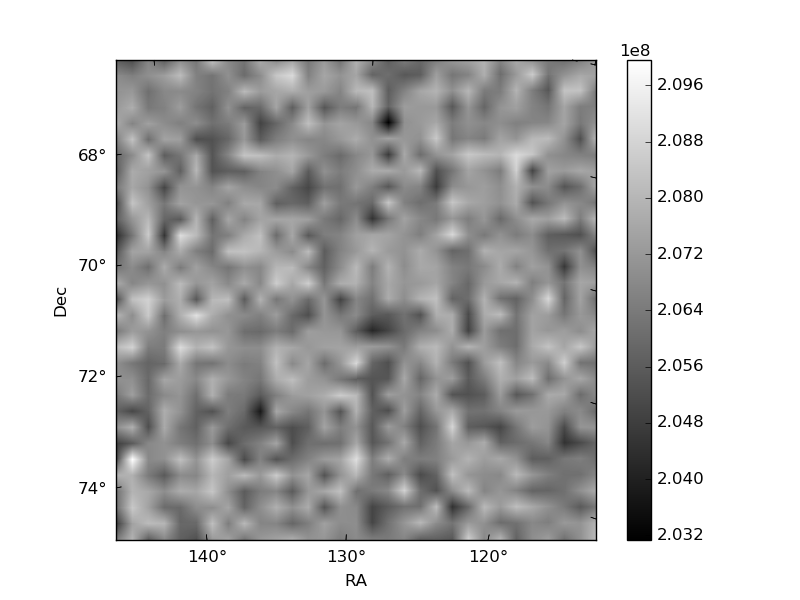
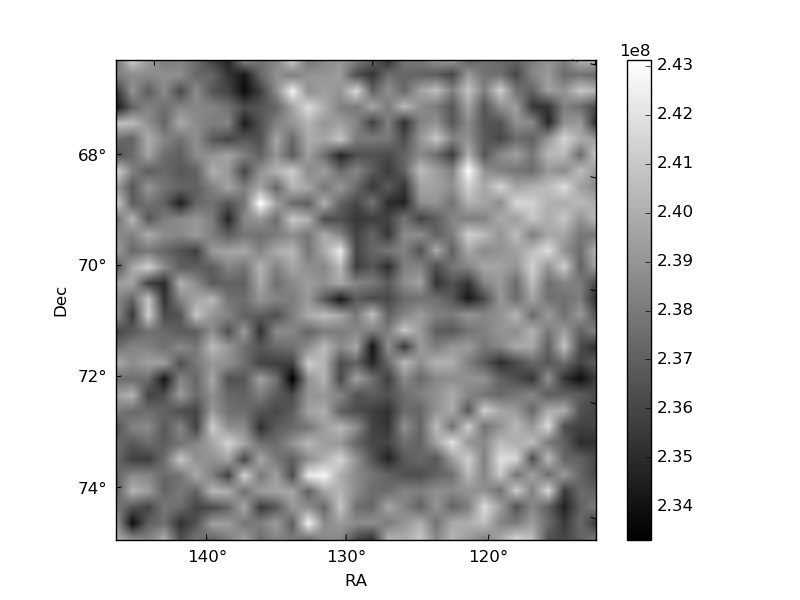
Histogram calculated using DETX and DETY for each event in the final _common_clean file
| Quadrant A | 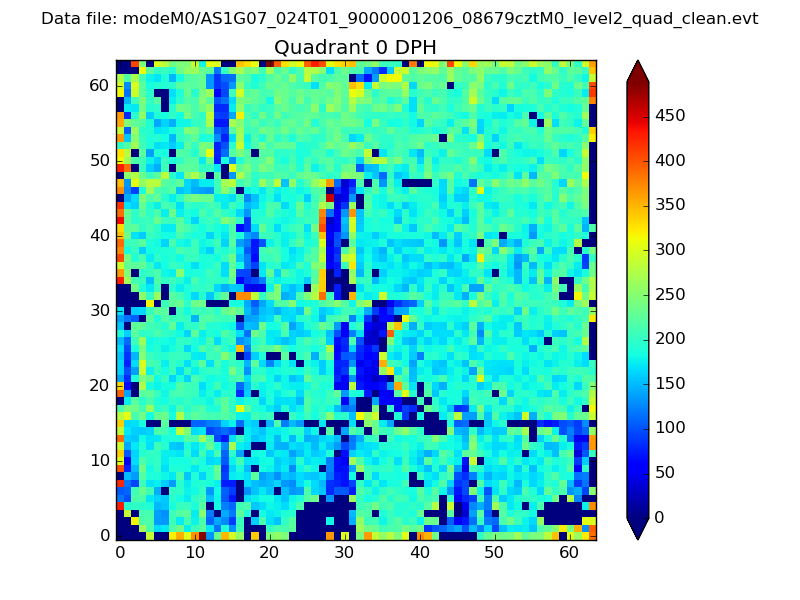 |
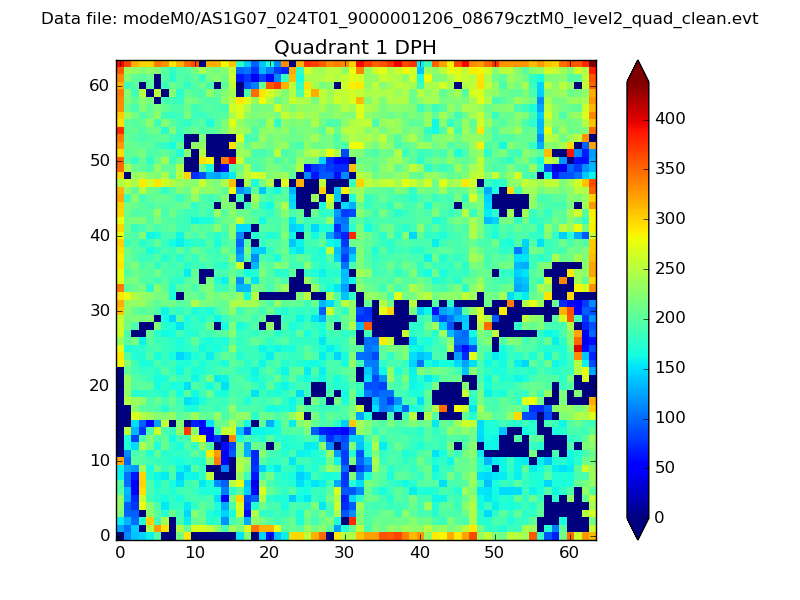 |
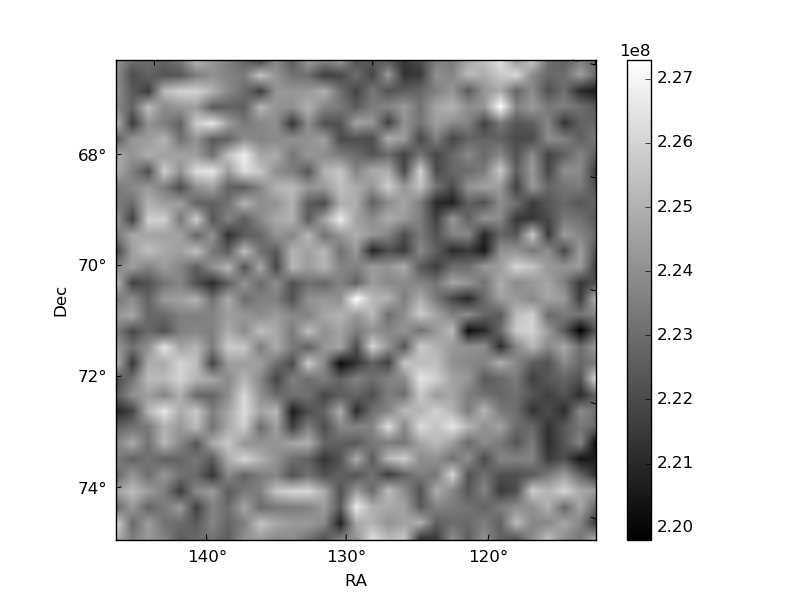
Quadrant B |
|---|---|---|---|
| Quadrant D | 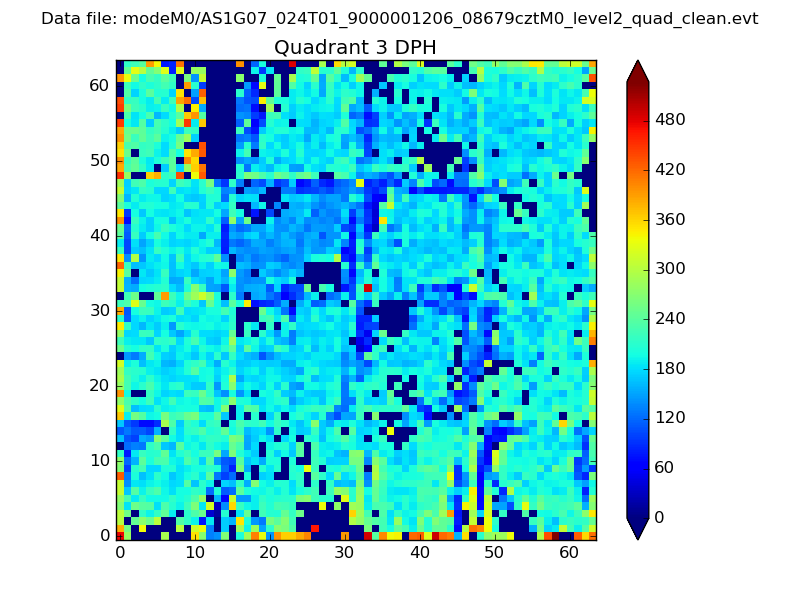 |
 |
Quadrant C |
| Plot type | Count rate plots | Images |
|---|---|---|
| Comparison with Poisson distribution Blue bars denote a histogram of data divided into 1 sec bins. Red curve is a Poisson curve with rate = median count rate of data. |
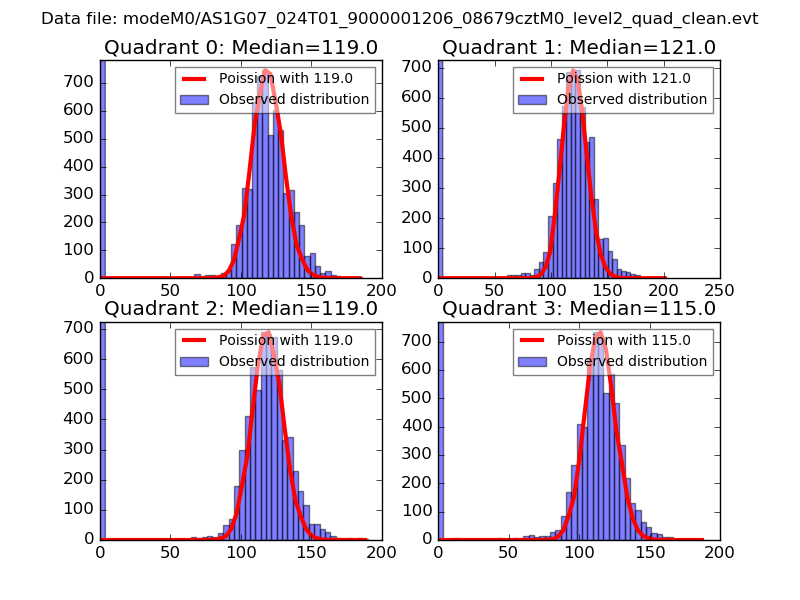 |
 |
| Quadrant-wise count rates Data is divided into 100 sec bins |
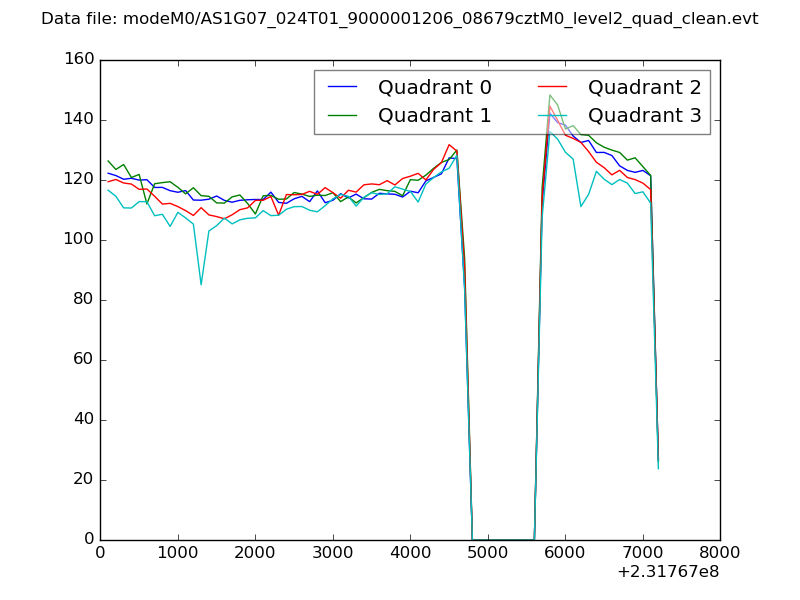 |
|
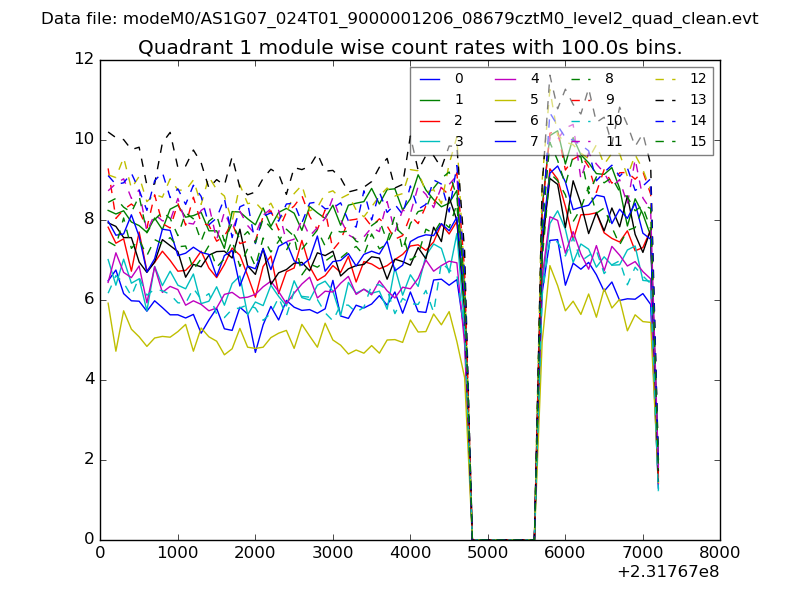
| Module-wise count rates for Quadrant A Data is divided into 100 sec bins |
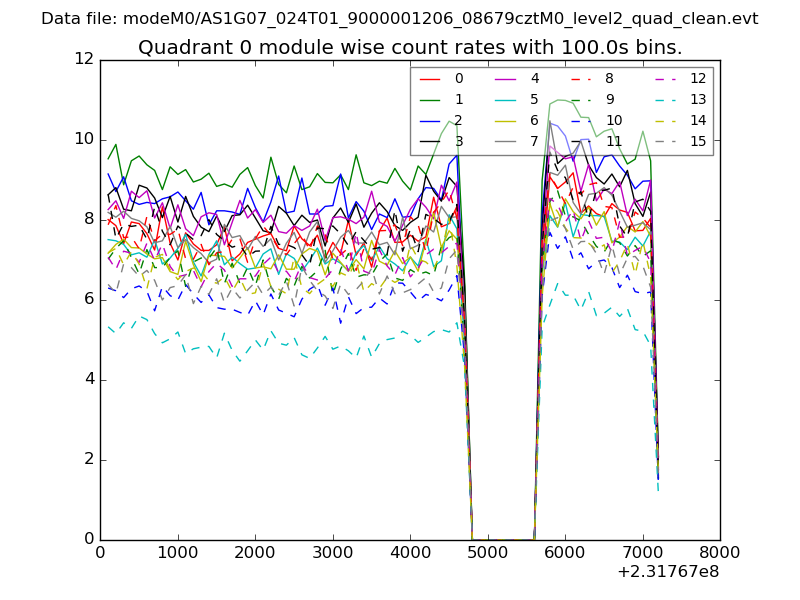 |
 |
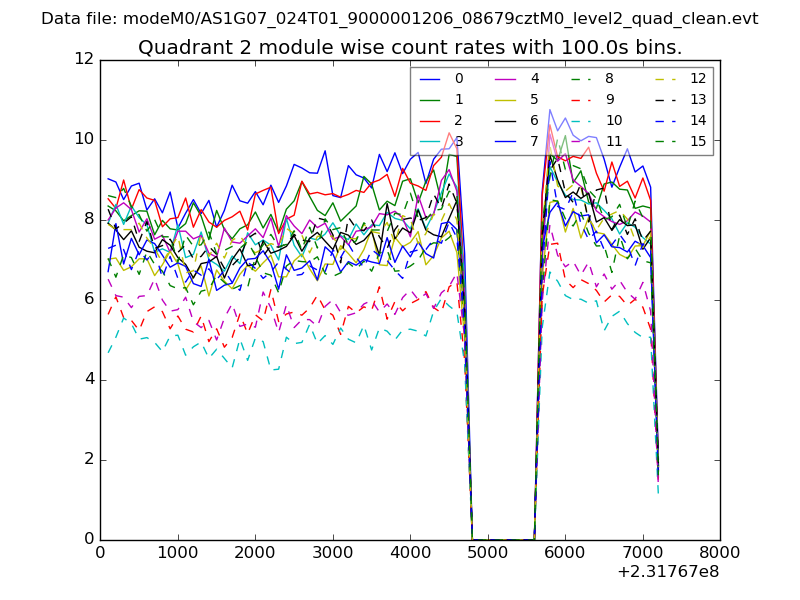
| Module-wise count rates for Quadrant B Data is divided into 100 sec bins |
 |
 |
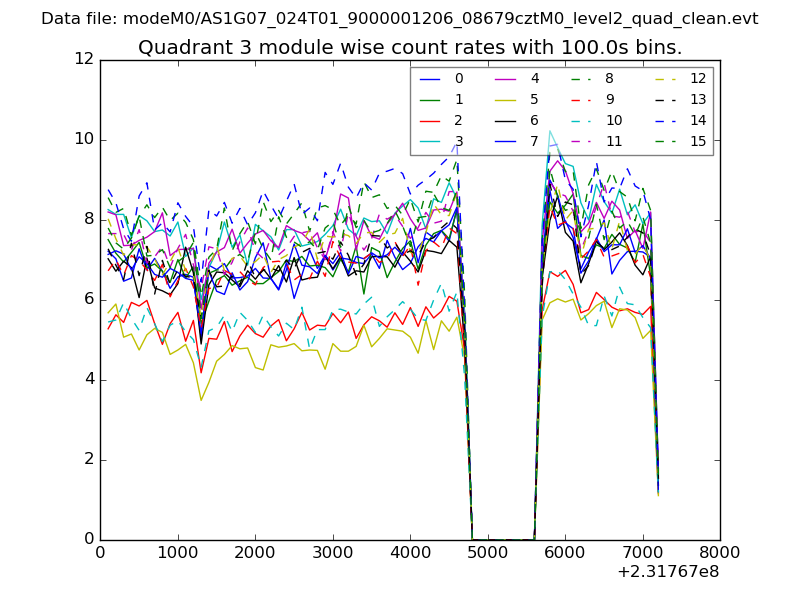
| Module-wise count rates for Quadrant C Data is divided into 100 sec bins |
 |
 |
| Module-wise count rates for Quadrant D Data is divided into 100 sec bins |
 |
 |
| Parameter | Plot |
|---|---|
| CZT HV Monitor | 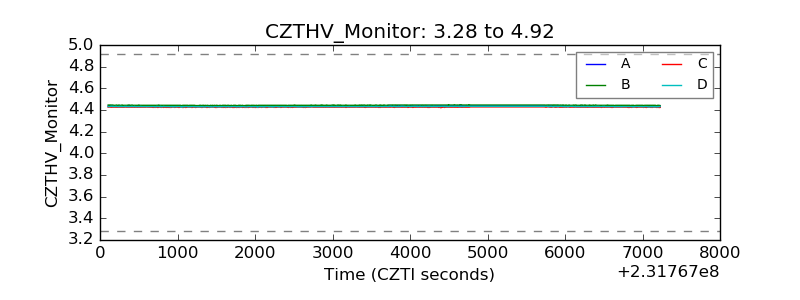 |
| D_VDD | 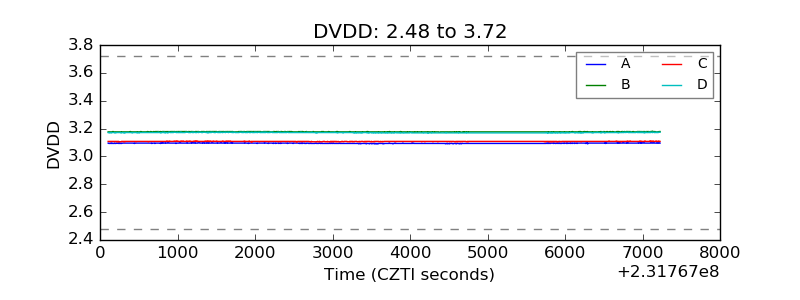 |
| Temperature 1 | 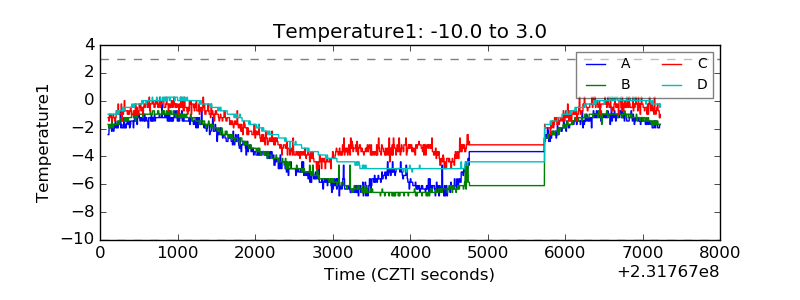 |
| Veto HV Monitor |  |
| Veto LLD | 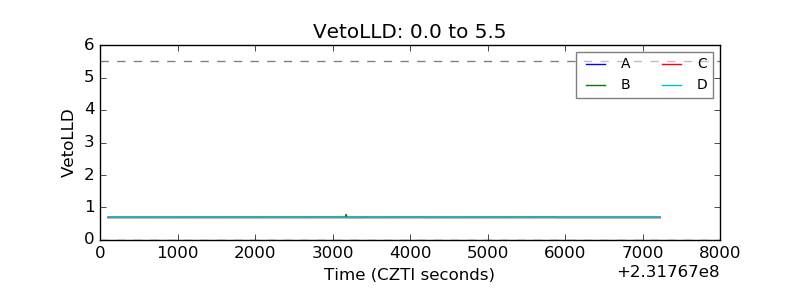 |
| Alpha Counter | 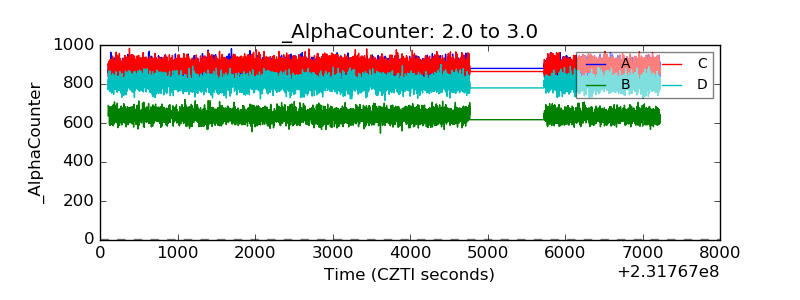 |
| _CPM_Rate | 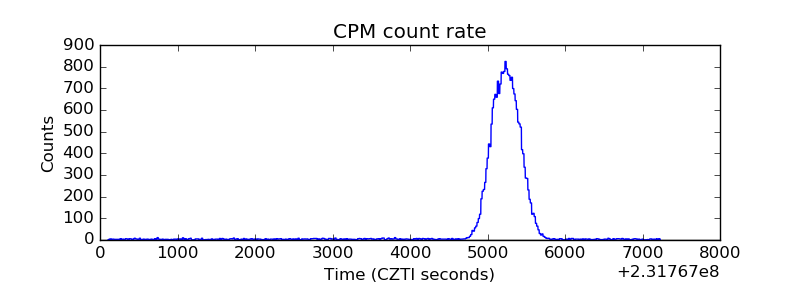 |
| CZT Counter | 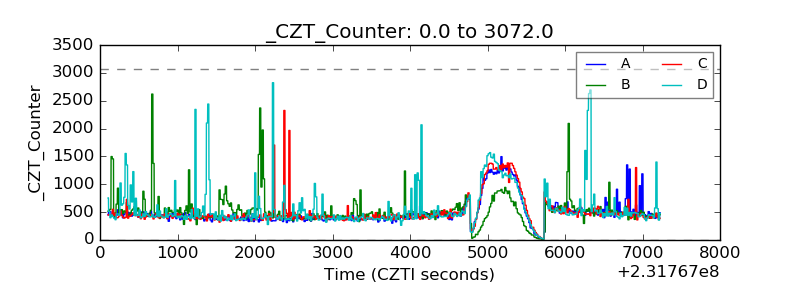 |
| +2.5 Volts monitor |  |
| +5 Volts monitor |  |
| _ROLL_ROT | 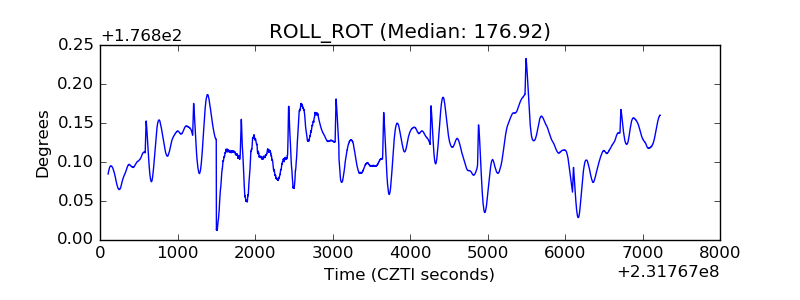 |
| _Roll_DEC | 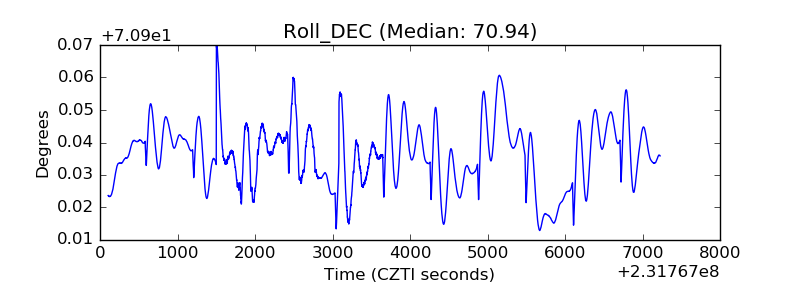 |
| _Roll_RA | 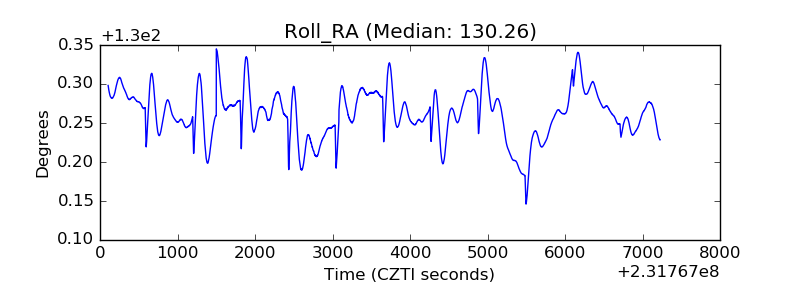 |
| Veto Counter | 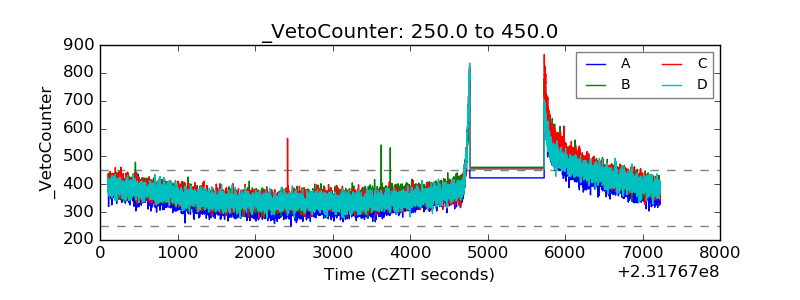 |