| Param | Original file | Final file |
|---|---|---|
| Filename | modeM0/AS1G07_024T01_9000001206_08681cztM0_level2.evt | modeM0/AS1G07_024T01_9000001206_08681cztM0_level2_quad_clean.evt |
| Size (bytes) | 399,646,080 | 113,149,440 |
| Size | 381.1 MB | 107.9 MB |
| Events in quadrant A | 2,851,611 | 752,075 |
| Events in quadrant B | 2,896,114 | 768,023 |
| Events in quadrant C | 3,001,317 | 754,621 |
| Events in quadrant D | 2,940,742 | 728,087 |
| Mode M0 | |||
|---|---|---|---|
| Quadrant | BADHDUFLAG | Total packets | Discarded packets |
| A | 0 | 12815 | 4 |
| B | 0 | 12778 | 1 |
| C | 0 | 13245 | 1 |
| D | 0 | 13165 | 1 |
| Mode M9 | |||
|---|---|---|---|
| Quadrant | BADHDUFLAG | Total packets | Discarded packets |
| A | 0 | 11 | 0 |
| B | 0 | 11 | 0 |
| C | 0 | 11 | 0 |
| D | 0 | 11 | 0 |
| Mode SS | |||
|---|---|---|---|
| Quadrant | BADHDUFLAG | Total packets | Discarded packets |
| A | 0 | 124 | 0 |
| B | 0 | 124 | 0 |
| C | 0 | 124 | 0 |
| D | 0 | 124 | 0 |
| Quadrant | Total seconds | Saturated seconds | Saturation percentage |
|---|---|---|---|
| A | 6073 | 41 | 0.675119% |
| B | 6074 | 40 | 0.658545% |
| C | 6074 | 99 | 1.629898% |
| D | 6074 | 79 | 1.300626% |
Noise dominated data is calculated using 1-second bins in cleaned event files. If a bin has >2000 counts, and if more than 50% of those come from <1% of pixels, then it is considered to be noise-dominated and hence unusable.
| Quadrant | # 1 sec bins | Bins with >0 counts | Bins with >2000 counts | High rate bins dominated by noise | Noise dominated (total time) | Noise dominated (detector-on time) | Marked lightcurve |
|---|---|---|---|---|---|---|---|
| A | 7179 | 6074 | 11 | 11 | 0.15% | 0.18% | 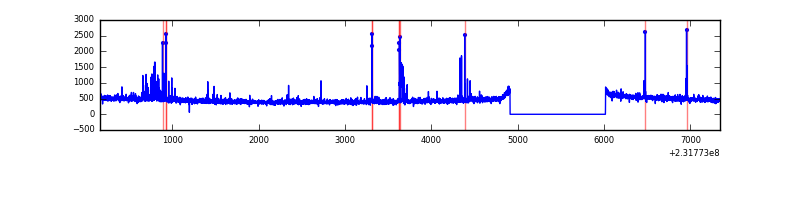 |
| B | 7179 | 6075 | 3 | 3 | 0.04% | 0.05% | 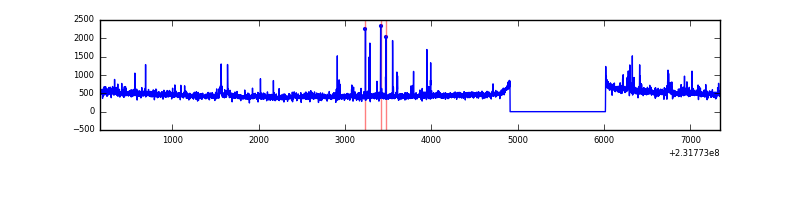 |
| C | 7179 | 6075 | 50 | 50 | 0.70% | 0.82% | 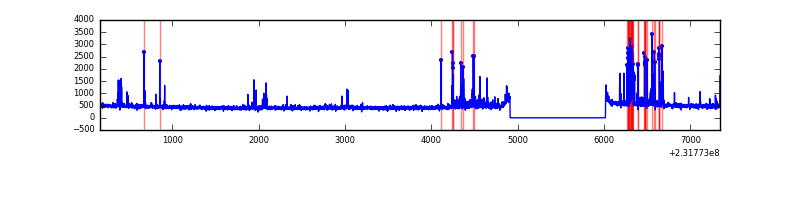 |
| D | 7179 | 6074 | 45 | 45 | 0.63% | 0.74% | 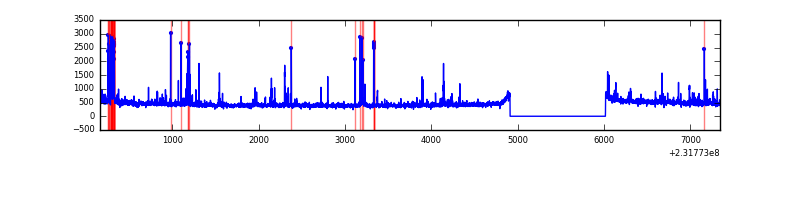 |
Top three noisy pixels from each quadrant. If the there are fewer than three noisy pixels in the level2.evt file, extra rows are filled as -1
| Pixel properties | Quadrant properties | ||||||
|---|---|---|---|---|---|---|---|
| Quadrant | DetID | PixID | Counts | Sigma | Mean | Median | Sigma |
| A | 8 | 5 | 53458 | 371.39 | 701 | 686 | 142.1 |
| A | 15 | 174 | 45406 | 314.72 | 701 | 686 | 142.1 |
| A | 5 | 16 | 24838 | 169.97 | 701 | 686 | 142.1 |
| B | 10 | 16 | 50038 | 371.28 | 707 | 691 | 132.9 |
| B | 0 | 219 | 25982 | 190.28 | 707 | 691 | 132.9 |
| B | 15 | 204 | 17747 | 128.33 | 707 | 691 | 132.9 |
| C | 1 | 16 | 193066 | 1217.83 | 685 | 688 | 158.0 |
| C | 14 | 234 | 74959 | 470.17 | 685 | 688 | 158.0 |
| C | 4 | 254 | 55802 | 348.89 | 685 | 688 | 158.0 |
| D | 12 | 233 | 156258 | 926.33 | 688 | 665 | 168.0 |
| D | 2 | 152 | 89184 | 527.0 | 688 | 665 | 168.0 |
| D | 7 | 71 | 53345 | 313.63 | 688 | 665 | 168.0 |
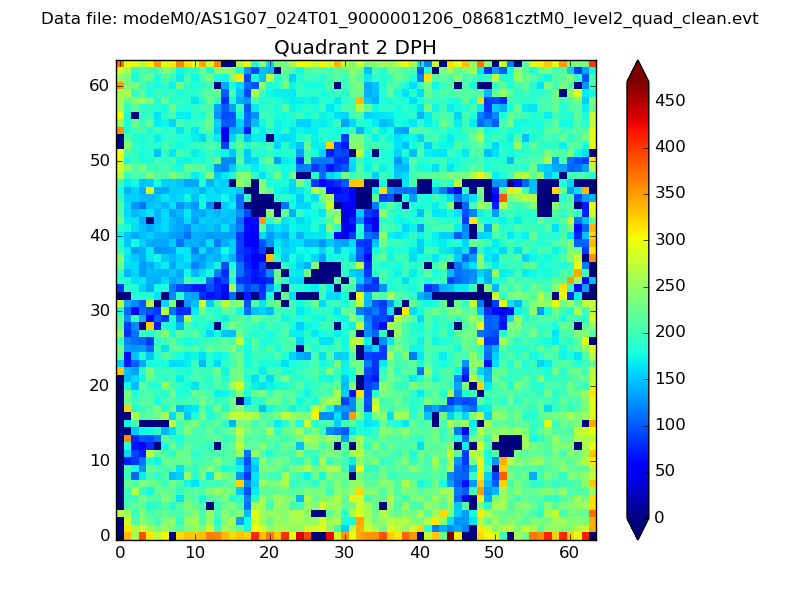
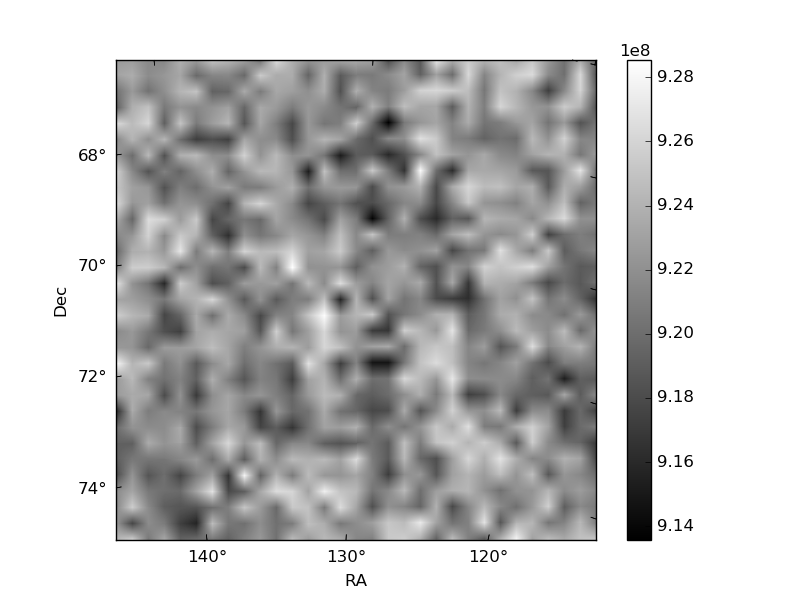
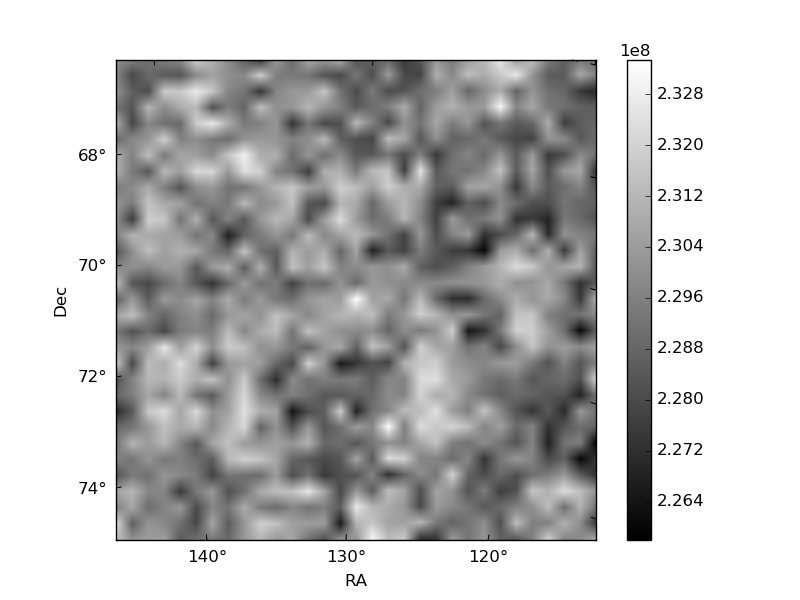
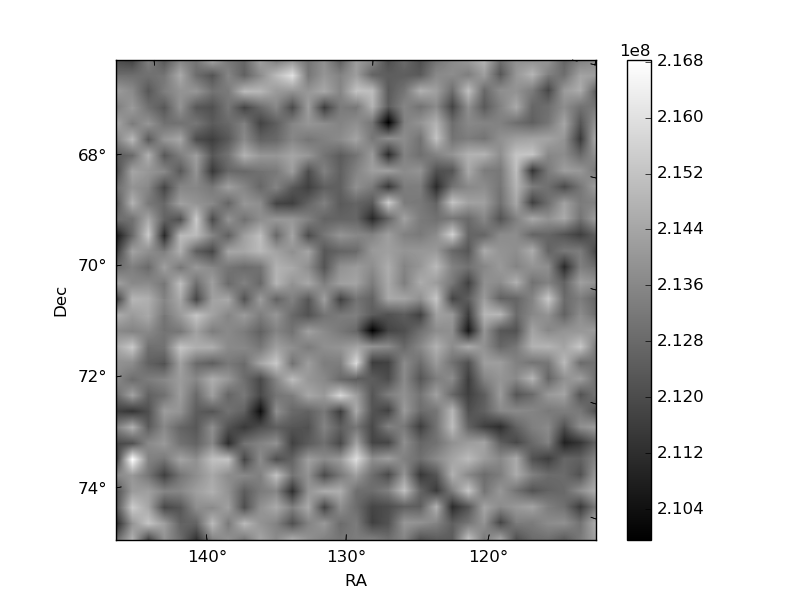
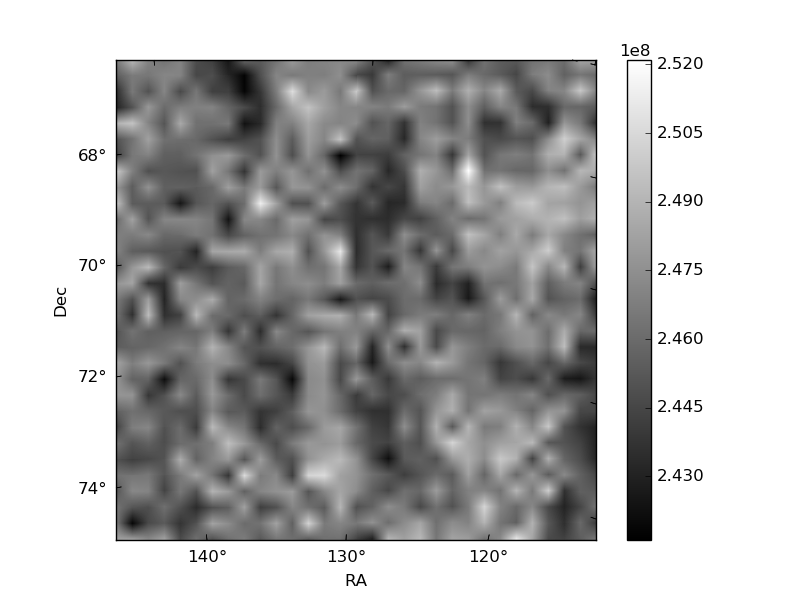
Histogram calculated using DETX and DETY for each event in the final _common_clean file
| Quadrant A | 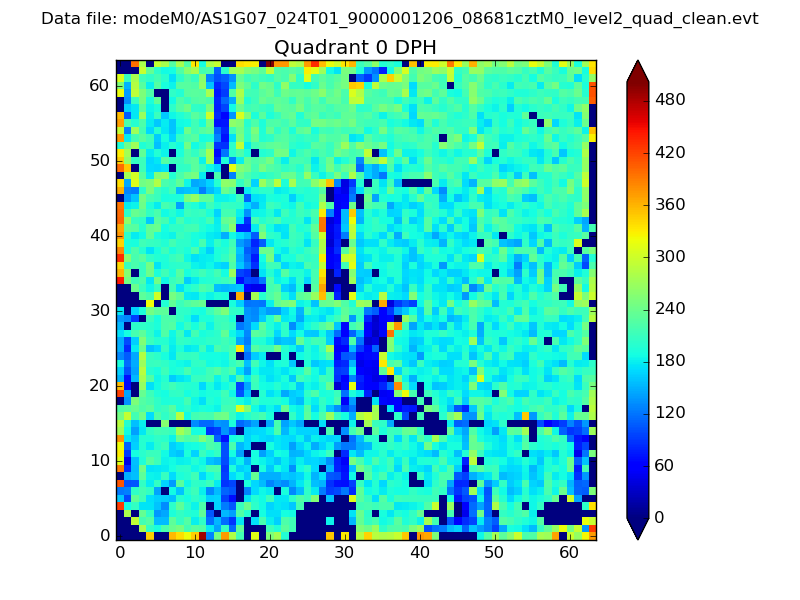 |
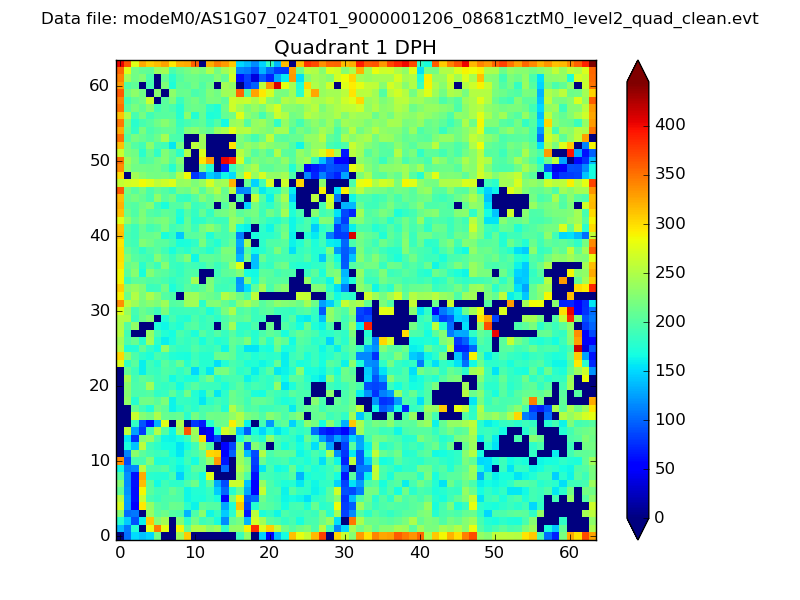 |
Quadrant B |
|---|---|---|---|
| Quadrant D | 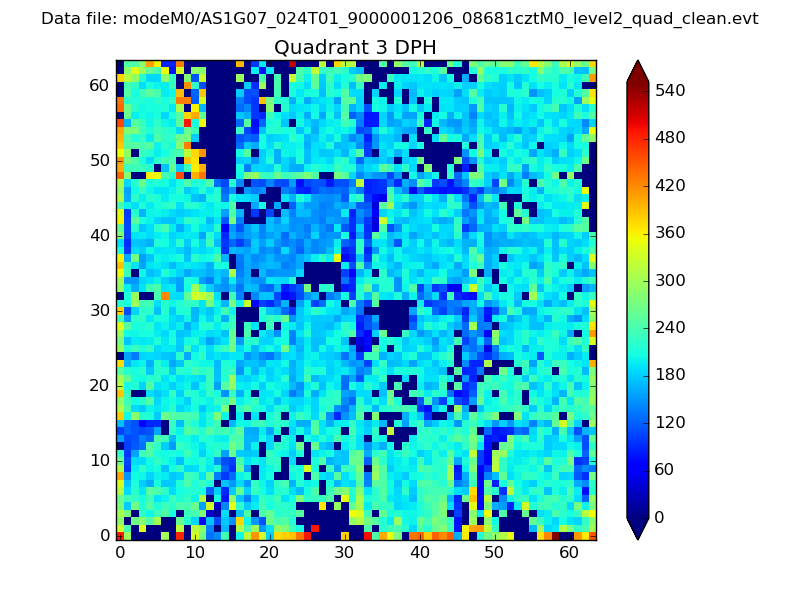 |
 |
Quadrant C |
| Plot type | Count rate plots | Images |
|---|---|---|
| Comparison with Poisson distribution Blue bars denote a histogram of data divided into 1 sec bins. Red curve is a Poisson curve with rate = median count rate of data. |
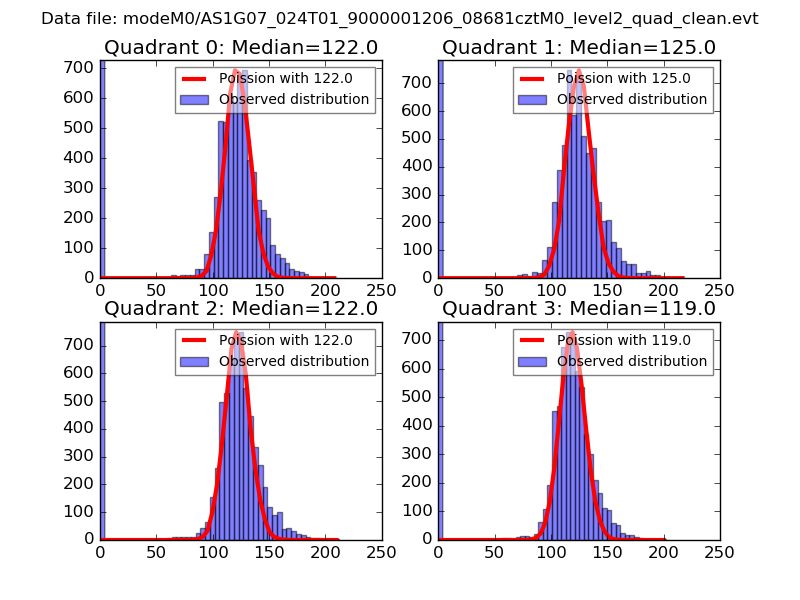 |
 |
| Quadrant-wise count rates Data is divided into 100 sec bins |
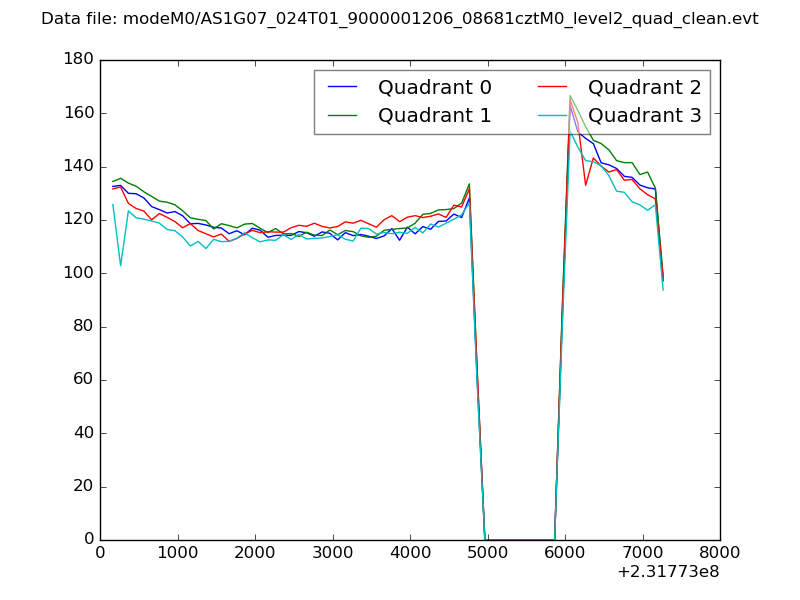 |
|
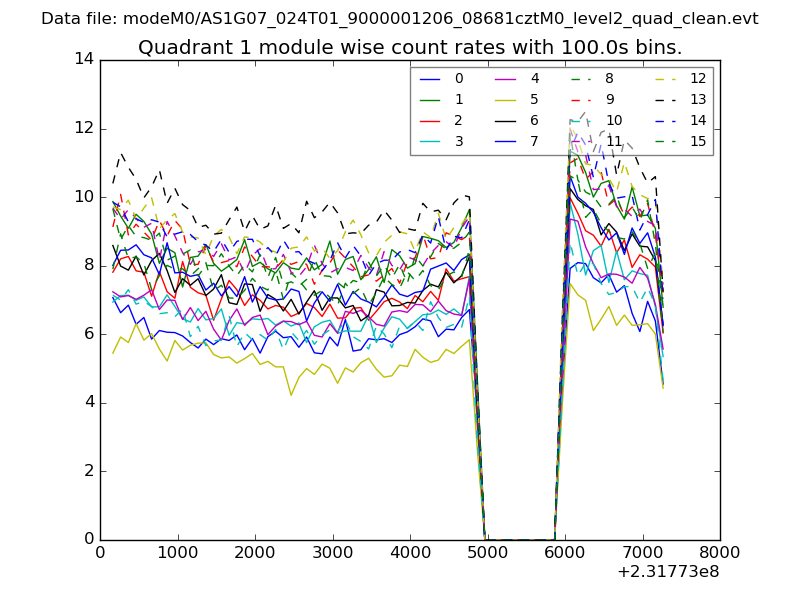
| Module-wise count rates for Quadrant A Data is divided into 100 sec bins |
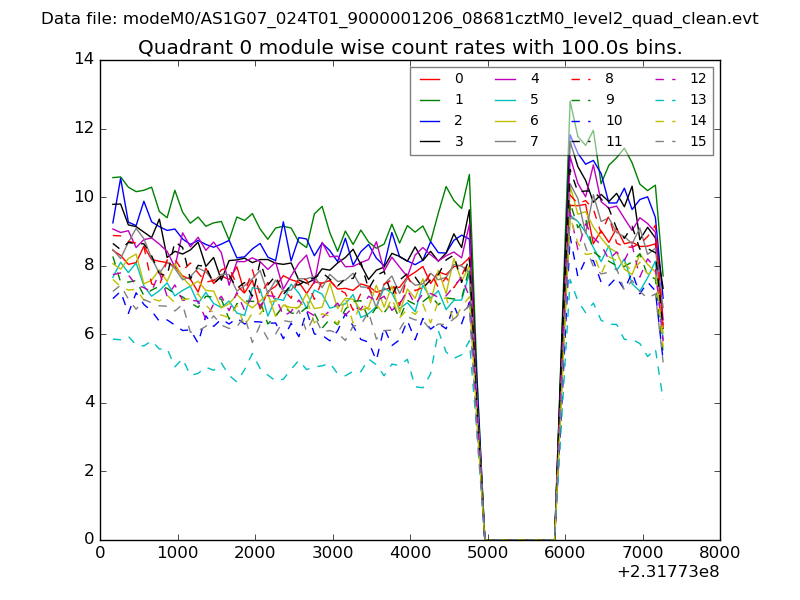 |
 |
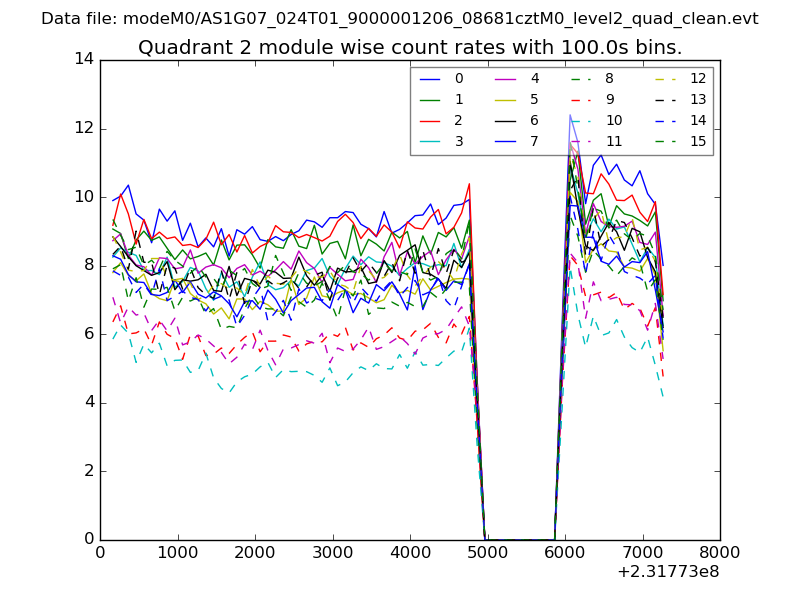
| Module-wise count rates for Quadrant B Data is divided into 100 sec bins |
 |
 |
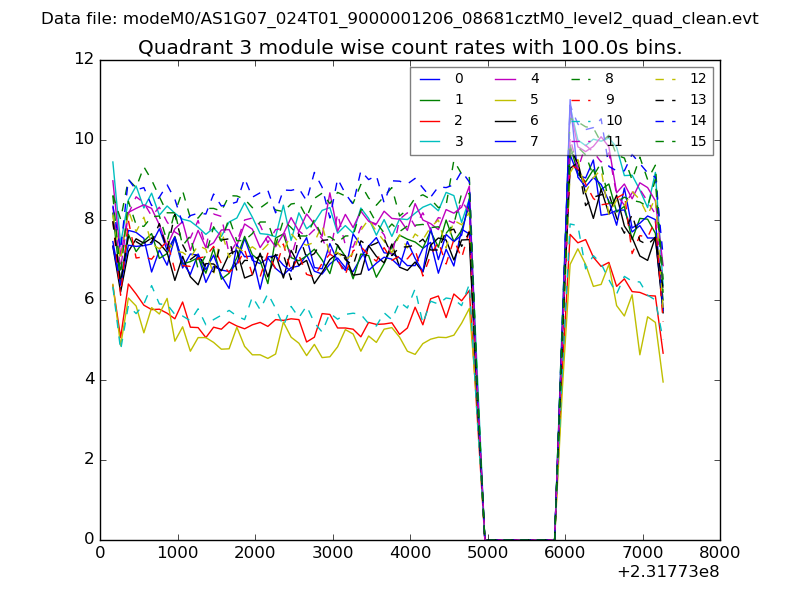
| Module-wise count rates for Quadrant C Data is divided into 100 sec bins |
 |
 |
| Module-wise count rates for Quadrant D Data is divided into 100 sec bins |
 |
 |
| Parameter | Plot |
|---|---|
| CZT HV Monitor | 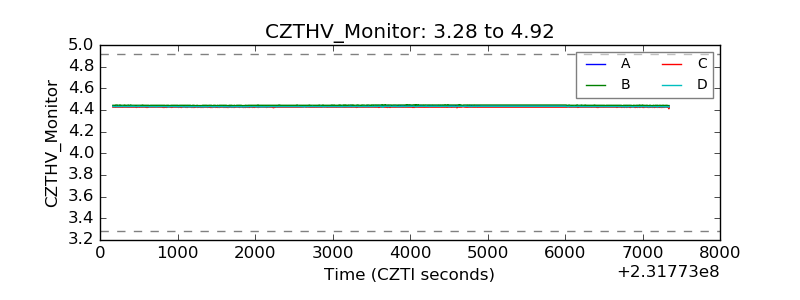 |
| D_VDD | 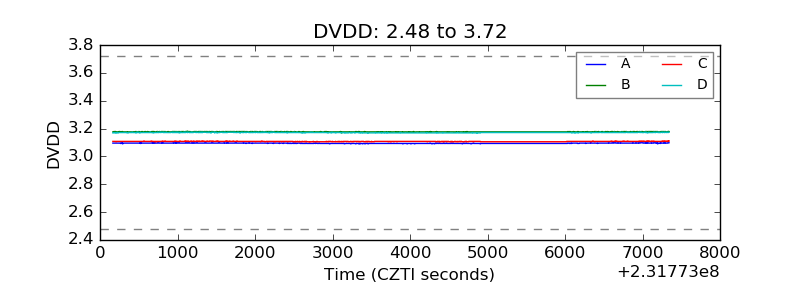 |
| Temperature 1 | 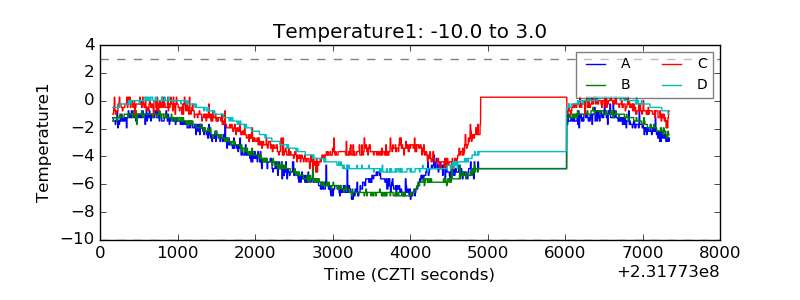 |
| Veto HV Monitor | 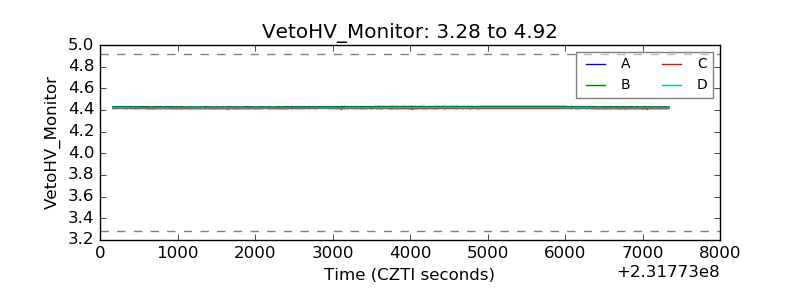 |
| Veto LLD | 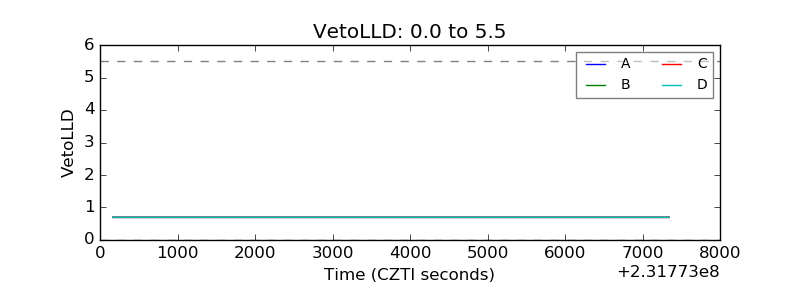 |
| Alpha Counter | 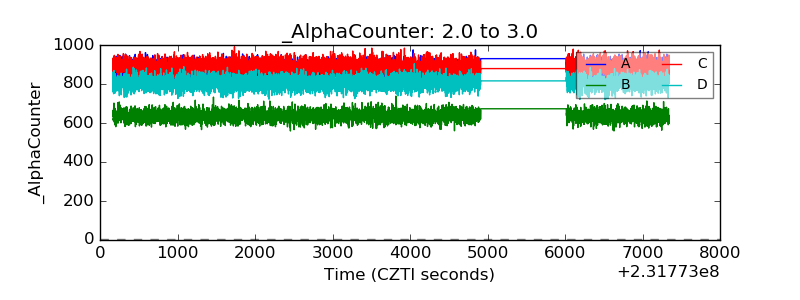 |
| _CPM_Rate | 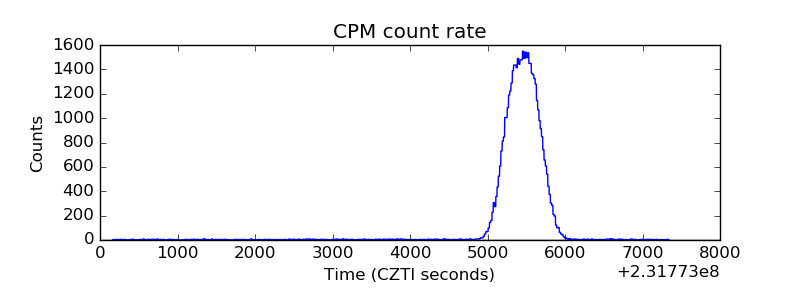 |
| CZT Counter | 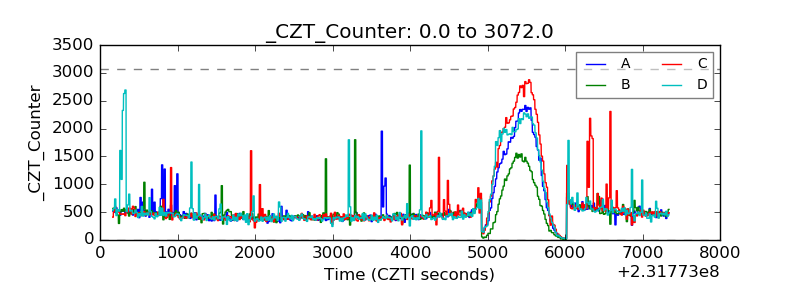 |
| +2.5 Volts monitor |  |
| +5 Volts monitor |  |
| _ROLL_ROT | 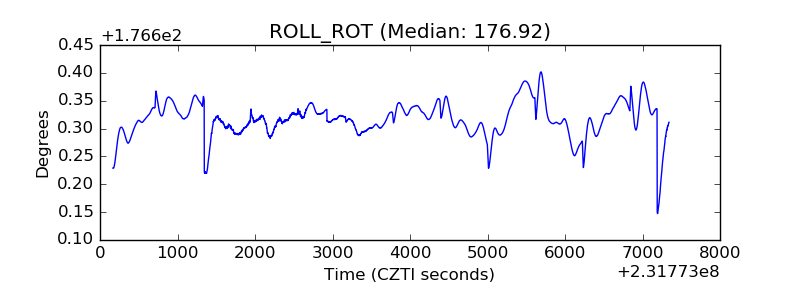 |
| _Roll_DEC | 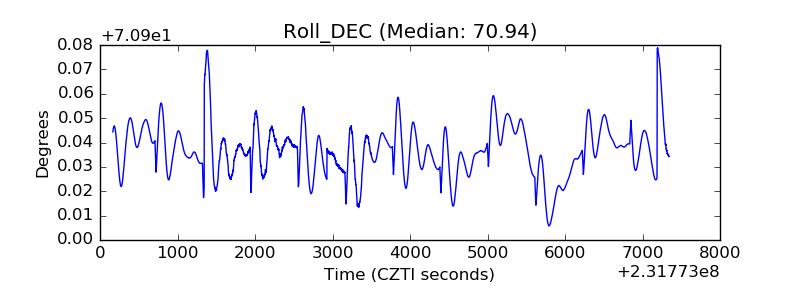 |
| _Roll_RA | 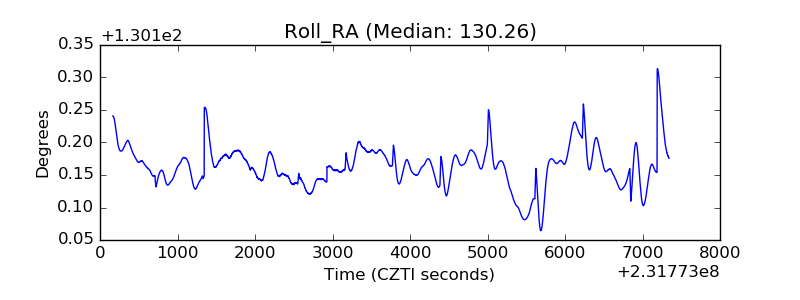 |
| Veto Counter | 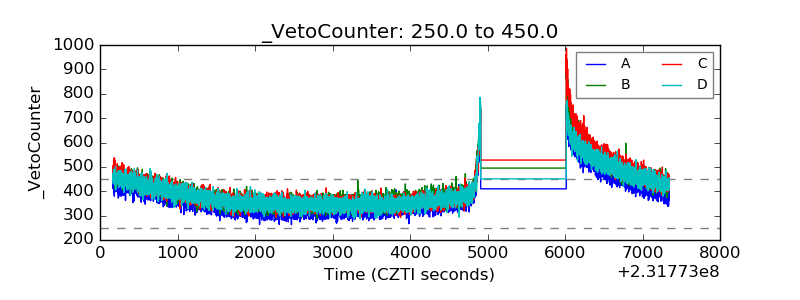 |