| Param | Original file | Final file |
|---|---|---|
| Filename | modeM0/AS1G07_024T01_9000001206_08682cztM0_level2.evt | modeM0/AS1G07_024T01_9000001206_08682cztM0_level2_quad_clean.evt |
| Size (bytes) | 411,183,360 | 117,250,560 |
| Size | 392.1 MB | 111.8 MB |
| Events in quadrant A | 2,798,461 | 781,541 |
| Events in quadrant B | 3,018,656 | 802,516 |
| Events in quadrant C | 3,291,848 | 786,534 |
| Events in quadrant D | 2,933,973 | 759,913 |
| Mode M0 | |||
|---|---|---|---|
| Quadrant | BADHDUFLAG | Total packets | Discarded packets |
| A | 0 | 12521 | 2 |
| B | 0 | 13028 | 1 |
| C | 0 | 13915 | 1 |
| D | 0 | 13042 | 1 |
| Mode M9 | |||
|---|---|---|---|
| Quadrant | BADHDUFLAG | Total packets | Discarded packets |
| A | 0 | 12 | 0 |
| B | 0 | 12 | 0 |
| C | 0 | 12 | 0 |
| D | 0 | 12 | 0 |
| Mode SS | |||
|---|---|---|---|
| Quadrant | BADHDUFLAG | Total packets | Discarded packets |
| A | 0 | 124 | 0 |
| B | 0 | 124 | 0 |
| C | 0 | 124 | 0 |
| D | 0 | 124 | 0 |
| Quadrant | Total seconds | Saturated seconds | Saturation percentage |
|---|---|---|---|
| A | 6018 | 40 | 0.664673% |
| B | 6018 | 49 | 0.814224% |
| C | 6018 | 171 | 2.841476% |
| D | 6018 | 63 | 1.046859% |
Noise dominated data is calculated using 1-second bins in cleaned event files. If a bin has >2000 counts, and if more than 50% of those come from <1% of pixels, then it is considered to be noise-dominated and hence unusable.
| Quadrant | # 1 sec bins | Bins with >0 counts | Bins with >2000 counts | High rate bins dominated by noise | Noise dominated (total time) | Noise dominated (detector-on time) | Marked lightcurve |
|---|---|---|---|---|---|---|---|
| A | 7234 | 6018 | 12 | 12 | 0.17% | 0.20% | 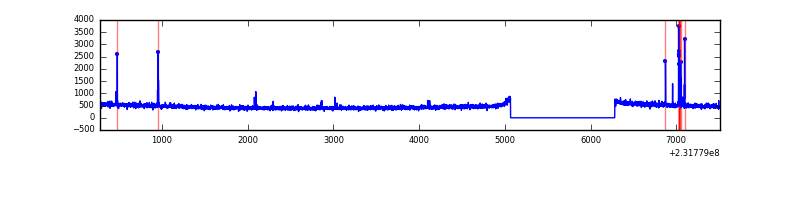 |
| B | 7234 | 6018 | 8 | 8 | 0.11% | 0.13% | 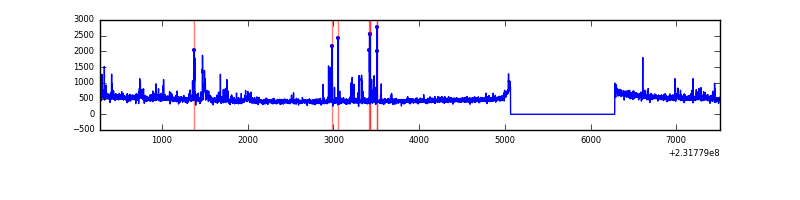 |
| C | 7234 | 6018 | 112 | 112 | 1.55% | 1.86% |  |
| D | 7234 | 6018 | 31 | 31 | 0.43% | 0.52% | 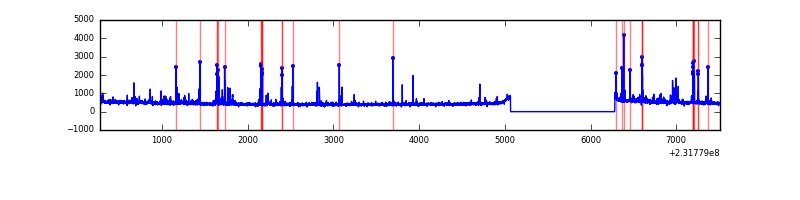 |
Top three noisy pixels from each quadrant. If the there are fewer than three noisy pixels in the level2.evt file, extra rows are filled as -1
| Pixel properties | Quadrant properties | ||||||
|---|---|---|---|---|---|---|---|
| Quadrant | DetID | PixID | Counts | Sigma | Mean | Median | Sigma |
| A | 15 | 174 | 35388 | 241.73 | 706 | 689 | 143.5 |
| A | 5 | 16 | 15301 | 101.79 | 706 | 689 | 143.5 |
| A | 0 | 254 | 13061 | 86.19 | 706 | 689 | 143.5 |
| B | 10 | 16 | 68952 | 515.0 | 717 | 701 | 132.5 |
| B | 10 | 245 | 52271 | 389.13 | 717 | 701 | 132.5 |
| B | 0 | 219 | 36176 | 267.68 | 717 | 701 | 132.5 |
| C | 1 | 16 | 484263 | 3047.6 | 696 | 699 | 158.7 |
| C | 14 | 234 | 74530 | 465.31 | 696 | 699 | 158.7 |
| C | 4 | 254 | 15772 | 95.0 | 696 | 699 | 158.7 |
| D | 2 | 152 | 175978 | 1025.52 | 700 | 676 | 170.9 |
| D | 7 | 71 | 29676 | 169.65 | 700 | 676 | 170.9 |
| D | 2 | 234 | 26722 | 152.37 | 700 | 676 | 170.9 |
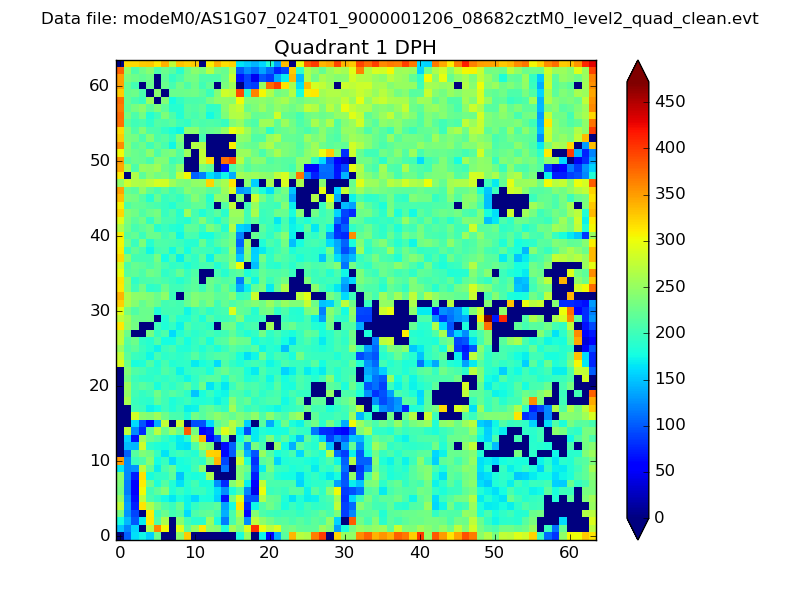
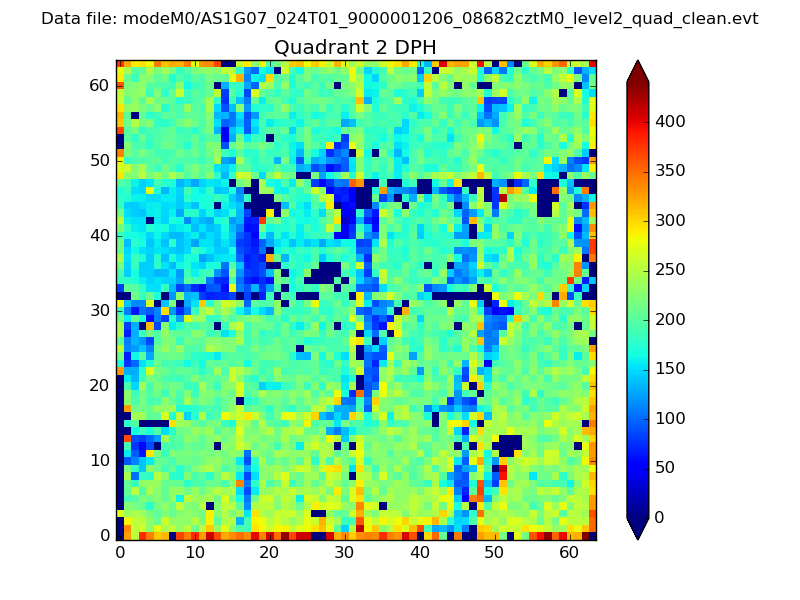
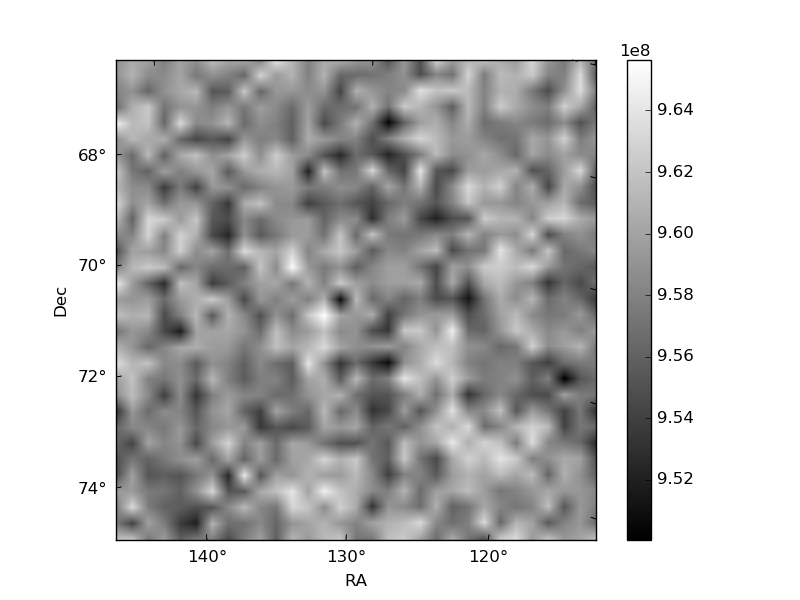
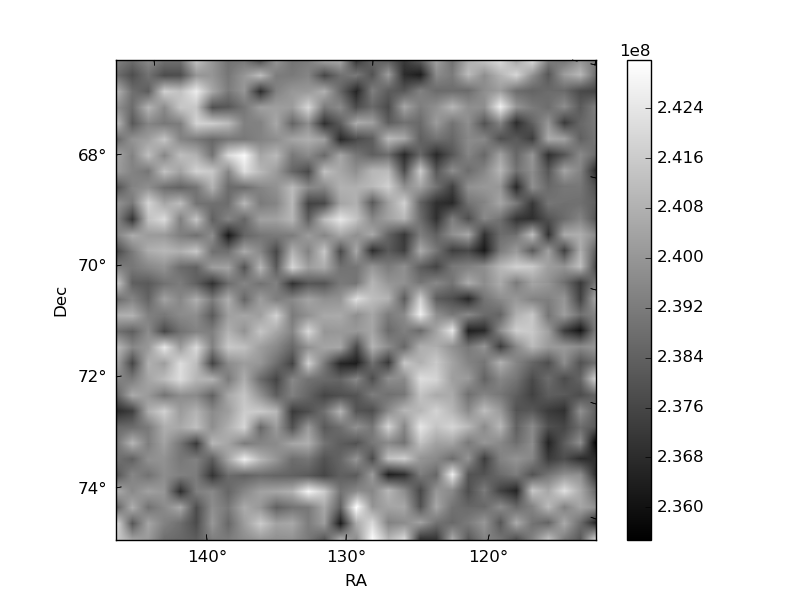
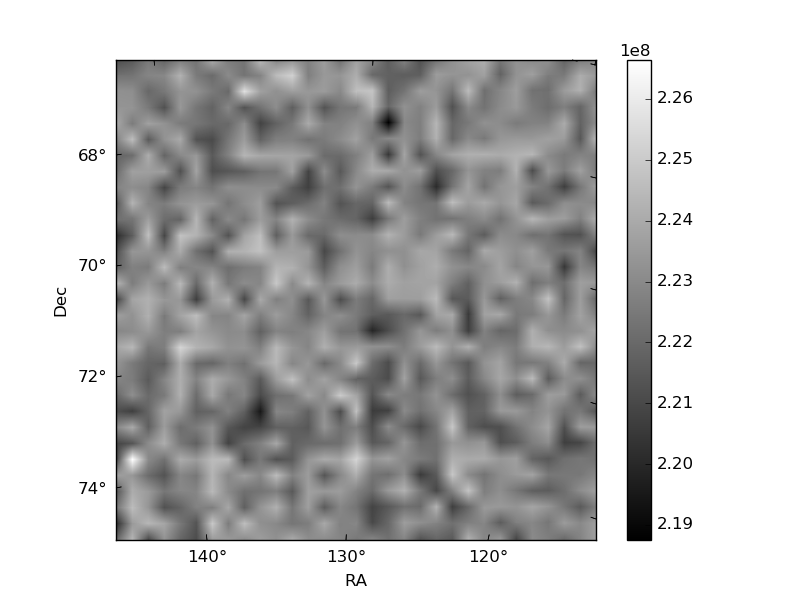
Histogram calculated using DETX and DETY for each event in the final _common_clean file
| Quadrant A | 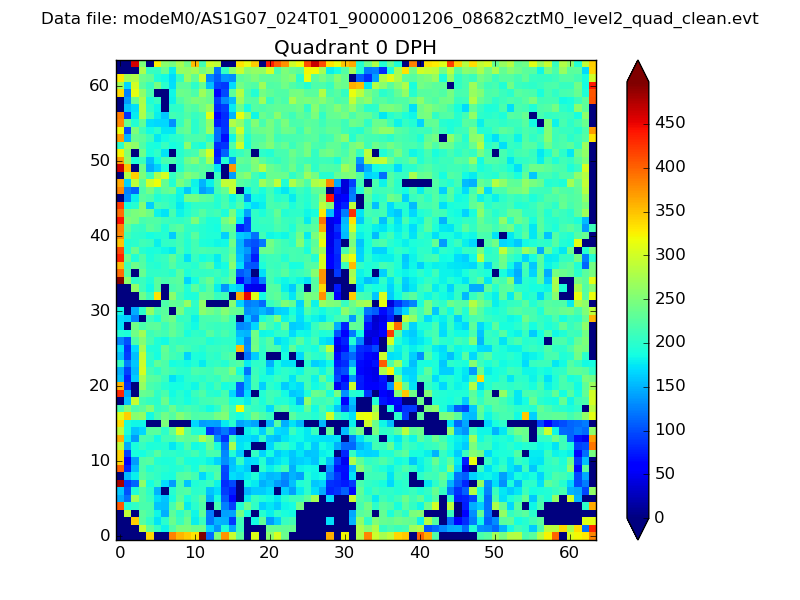 |
 |
Quadrant B |
|---|---|---|---|
| Quadrant D | 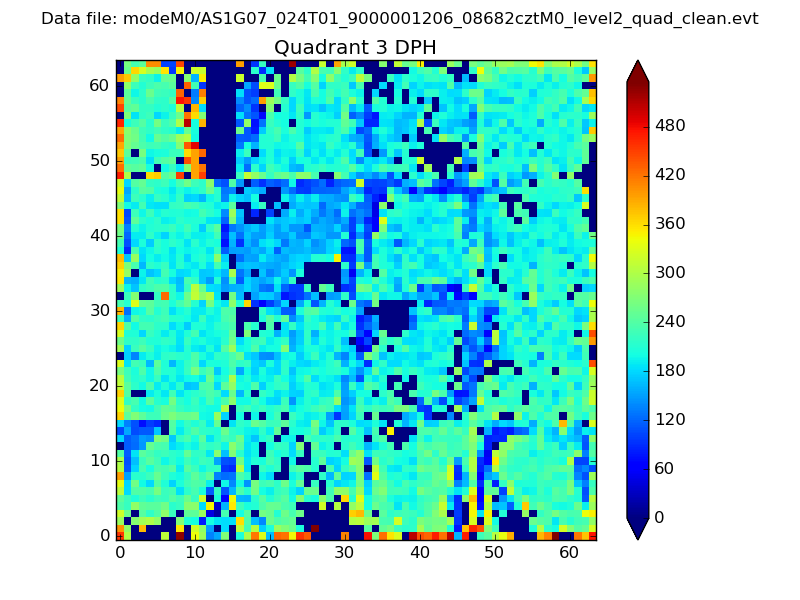 |
 |
Quadrant C |
| Plot type | Count rate plots | Images |
|---|---|---|
| Comparison with Poisson distribution Blue bars denote a histogram of data divided into 1 sec bins. Red curve is a Poisson curve with rate = median count rate of data. |
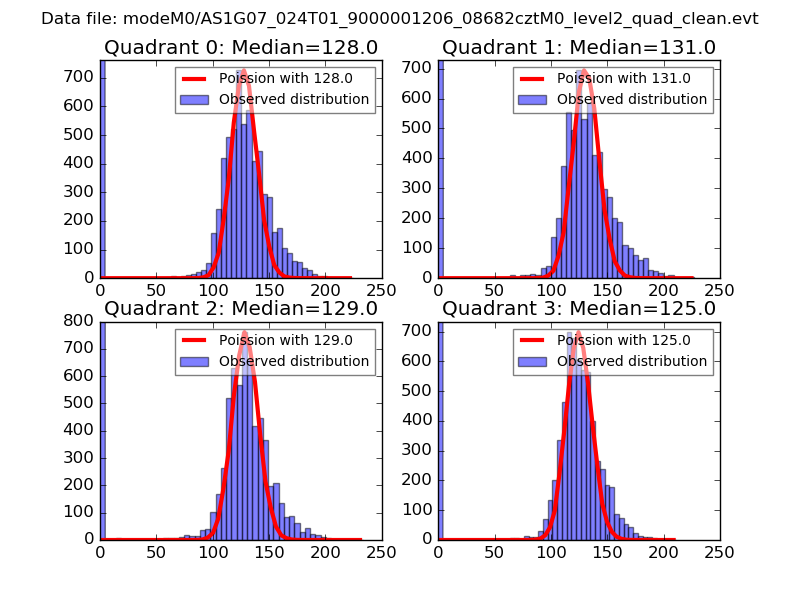 |
 |
| Quadrant-wise count rates Data is divided into 100 sec bins |
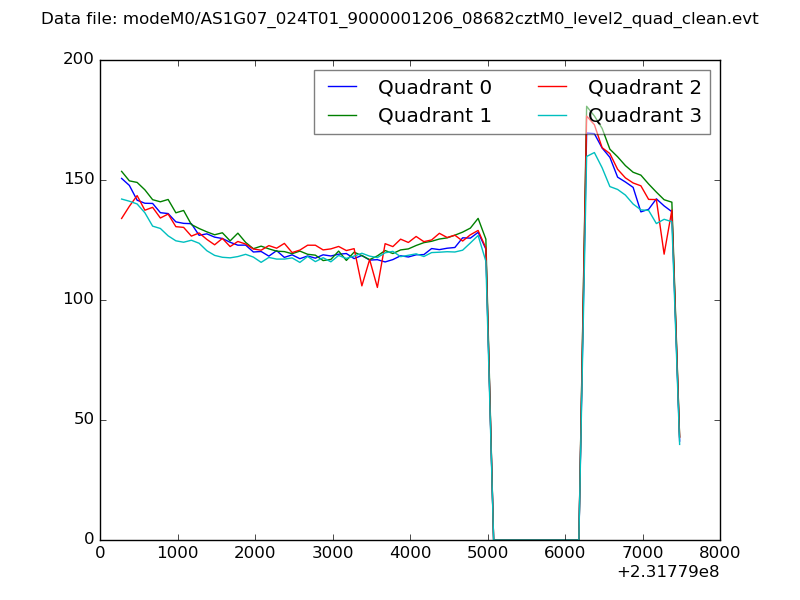 |
|
| Module-wise count rates for Quadrant A Data is divided into 100 sec bins |
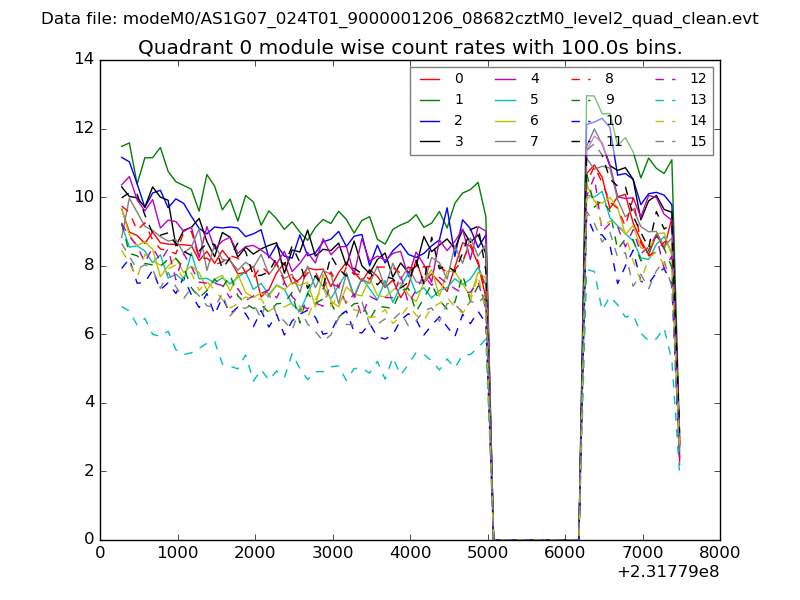 |
 |
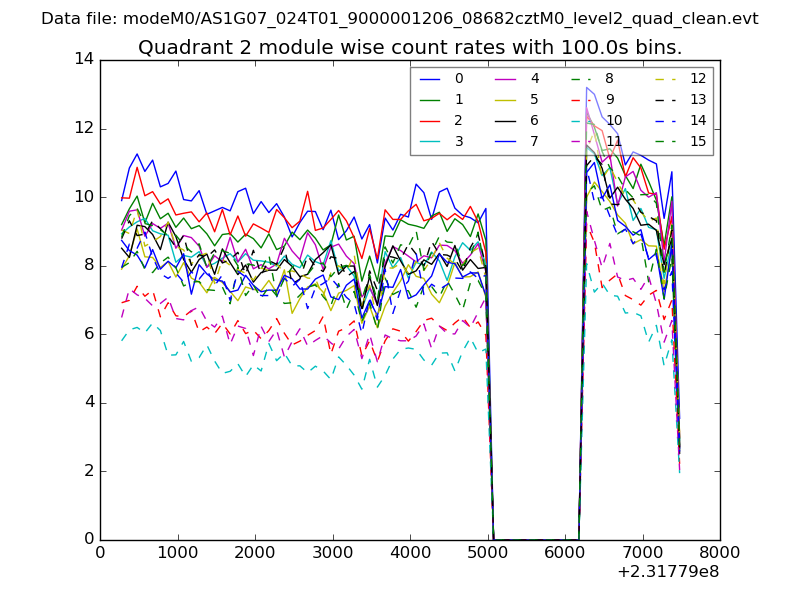
| Module-wise count rates for Quadrant B Data is divided into 100 sec bins |
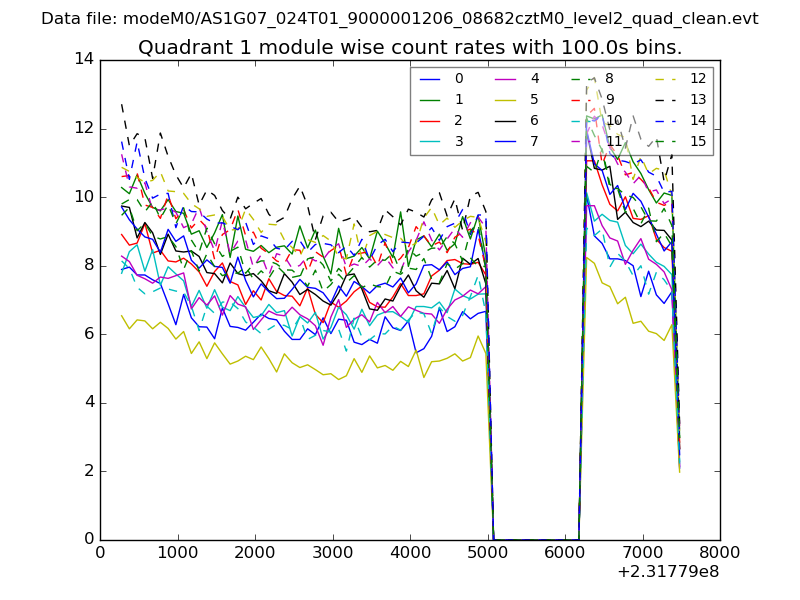 |
 |
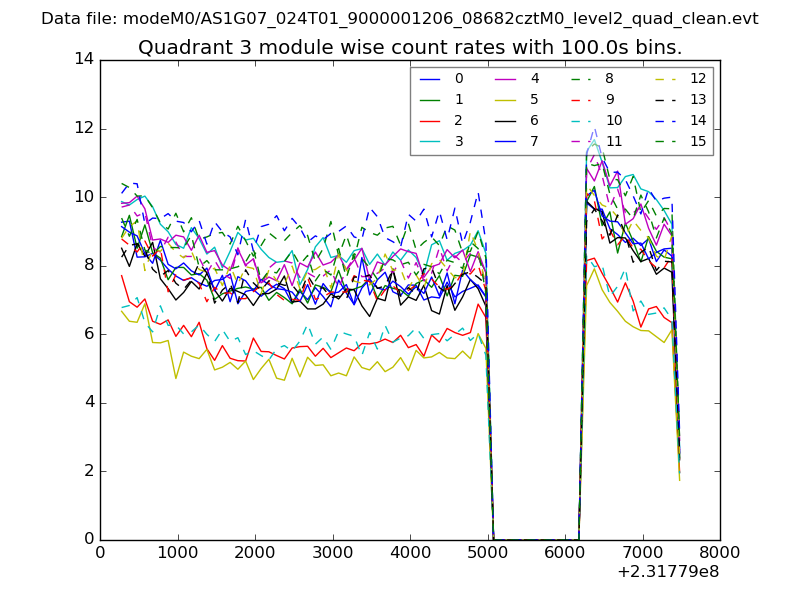
| Module-wise count rates for Quadrant C Data is divided into 100 sec bins |
 |
 |
| Module-wise count rates for Quadrant D Data is divided into 100 sec bins |
 |
 |
| Parameter | Plot |
|---|---|
| CZT HV Monitor | 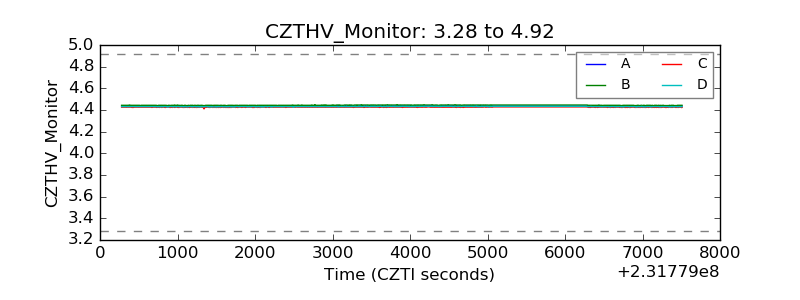 |
| D_VDD | 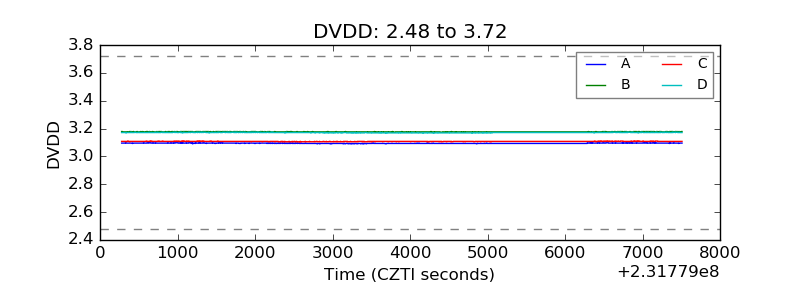 |
| Temperature 1 | 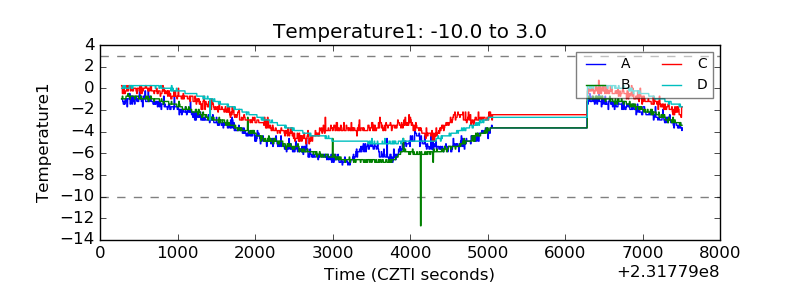 |
| Veto HV Monitor |  |
| Veto LLD | 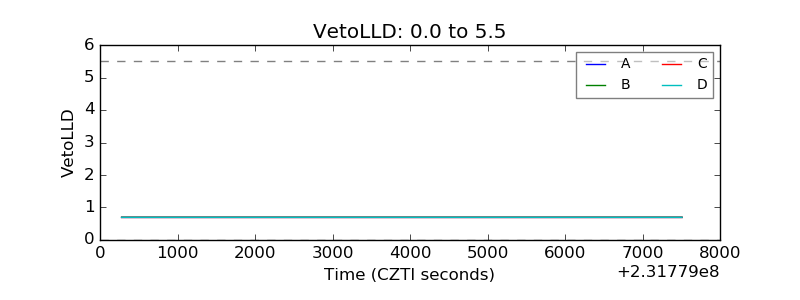 |
| Alpha Counter | 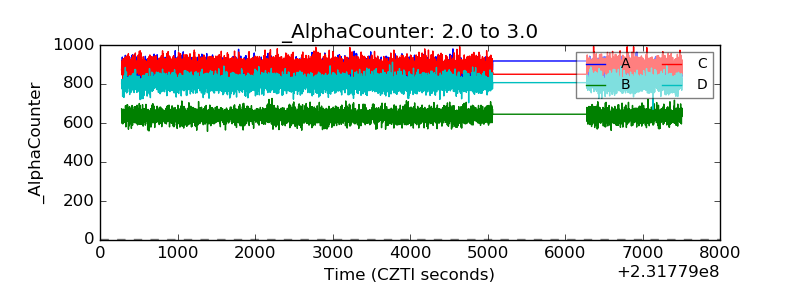 |
| _CPM_Rate | 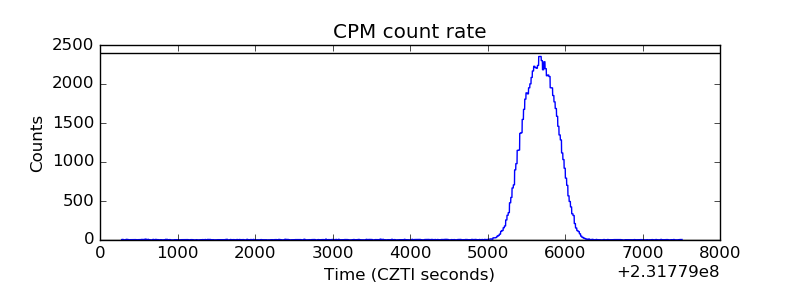 |
| CZT Counter | 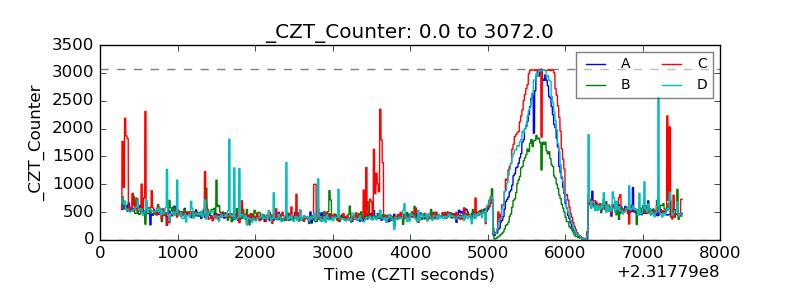 |
| +2.5 Volts monitor |  |
| +5 Volts monitor |  |
| _ROLL_ROT | 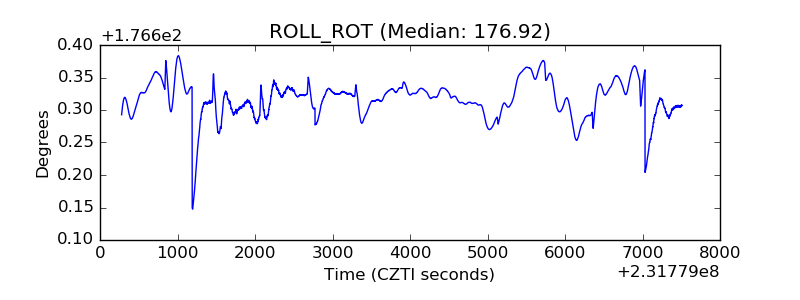 |
| _Roll_DEC | 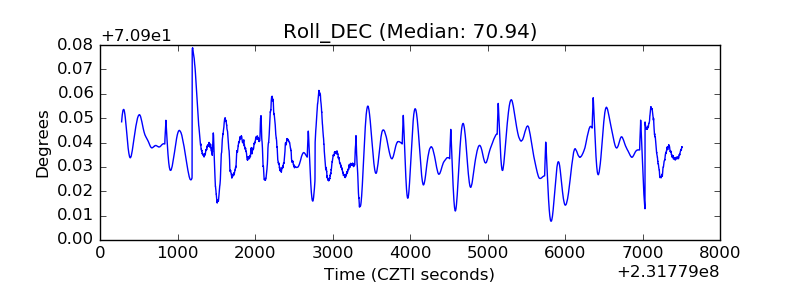 |
| _Roll_RA | 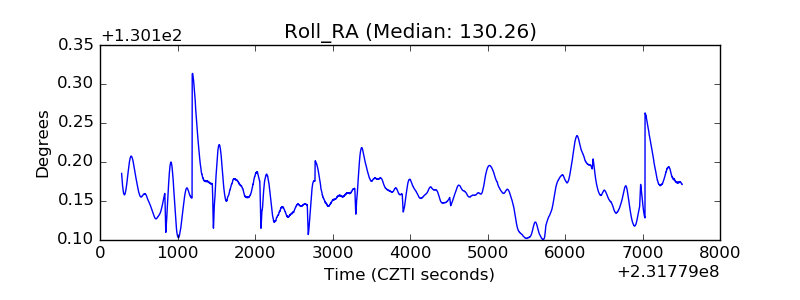 |
| Veto Counter | 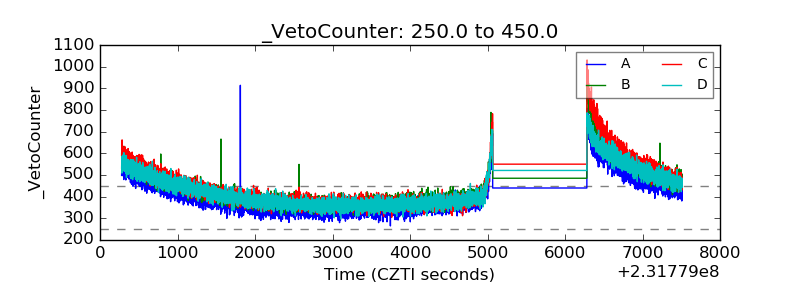 |