| Param | Original file | Final file |
|---|---|---|
| Filename | modeM0/AS1G07_024T01_9000001206_08683cztM0_level2.evt | modeM0/AS1G07_024T01_9000001206_08683cztM0_level2_quad_clean.evt |
| Size (bytes) | 413,435,520 | 124,776,000 |
| Size | 394.3 MB | 119.0 MB |
| Events in quadrant A | 2,926,948 | 827,502 |
| Events in quadrant B | 3,107,905 | 858,425 |
| Events in quadrant C | 3,019,321 | 853,846 |
| Events in quadrant D | 3,046,937 | 808,670 |
| Mode M0 | |||
|---|---|---|---|
| Quadrant | BADHDUFLAG | Total packets | Discarded packets |
| A | 0 | 12931 | 2 |
| B | 0 | 13375 | 1 |
| C | 0 | 13126 | 1 |
| D | 0 | 13344 | 1 |
| Mode M9 | |||
|---|---|---|---|
| Quadrant | BADHDUFLAG | Total packets | Discarded packets |
| A | 0 | 13 | 0 |
| B | 0 | 13 | 0 |
| C | 0 | 13 | 0 |
| D | 0 | 13 | 0 |
| Mode SS | |||
|---|---|---|---|
| Quadrant | BADHDUFLAG | Total packets | Discarded packets |
| A | 0 | 126 | 0 |
| B | 0 | 126 | 0 |
| C | 0 | 126 | 0 |
| D | 0 | 126 | 0 |
| Quadrant | Total seconds | Saturated seconds | Saturation percentage |
|---|---|---|---|
| A | 6171 | 37 | 0.599579% |
| B | 6171 | 53 | 0.858856% |
| C | 6171 | 56 | 0.907470% |
| D | 6171 | 57 | 0.923675% |
Noise dominated data is calculated using 1-second bins in cleaned event files. If a bin has >2000 counts, and if more than 50% of those come from <1% of pixels, then it is considered to be noise-dominated and hence unusable.
| Quadrant | # 1 sec bins | Bins with >0 counts | Bins with >2000 counts | High rate bins dominated by noise | Noise dominated (total time) | Noise dominated (detector-on time) | Marked lightcurve |
|---|---|---|---|---|---|---|---|
| A | 7461 | 6172 | 18 | 18 | 0.24% | 0.29% | 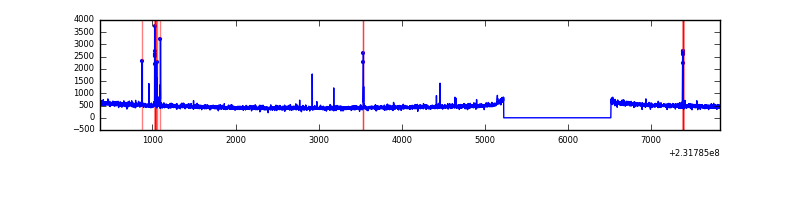 |
| B | 7461 | 6172 | 9 | 9 | 0.12% | 0.15% |  |
| C | 7461 | 6171 | 25 | 25 | 0.34% | 0.41% | 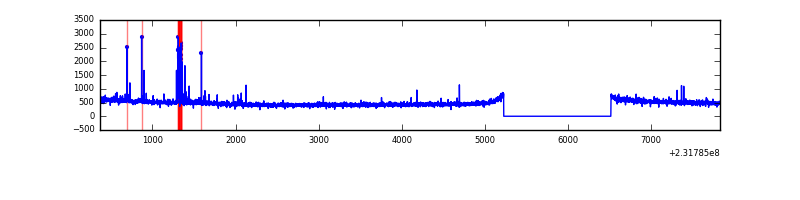 |
| D | 7461 | 6171 | 29 | 29 | 0.39% | 0.47% | 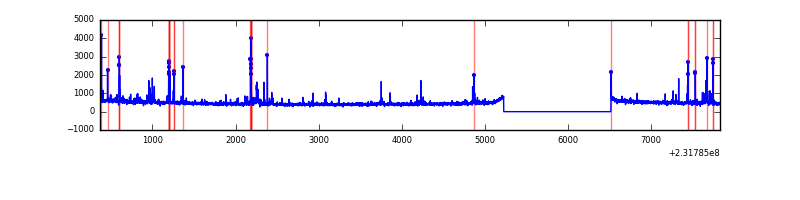 |
Top three noisy pixels from each quadrant. If the there are fewer than three noisy pixels in the level2.evt file, extra rows are filled as -1
| Pixel properties | Quadrant properties | ||||||
|---|---|---|---|---|---|---|---|
| Quadrant | DetID | PixID | Counts | Sigma | Mean | Median | Sigma |
| A | 5 | 16 | 38395 | 253.87 | 736 | 719 | 148.4 |
| A | 15 | 174 | 32576 | 214.66 | 736 | 719 | 148.4 |
| A | 13 | 251 | 15972 | 102.78 | 736 | 719 | 148.4 |
| B | 10 | 16 | 53507 | 380.13 | 752 | 735 | 138.8 |
| B | 0 | 219 | 30683 | 215.72 | 752 | 735 | 138.8 |
| B | 15 | 85 | 29563 | 207.65 | 752 | 735 | 138.8 |
| C | 1 | 16 | 121103 | 716.24 | 739 | 742 | 168.0 |
| C | 4 | 254 | 13087 | 73.46 | 739 | 742 | 168.0 |
| C | 13 | 61 | 5733 | 29.7 | 739 | 742 | 168.0 |
| D | 7 | 71 | 107477 | 606.37 | 731 | 707 | 176.1 |
| D | 2 | 152 | 104878 | 591.61 | 731 | 707 | 176.1 |
| D | 2 | 234 | 27658 | 153.06 | 731 | 707 | 176.1 |
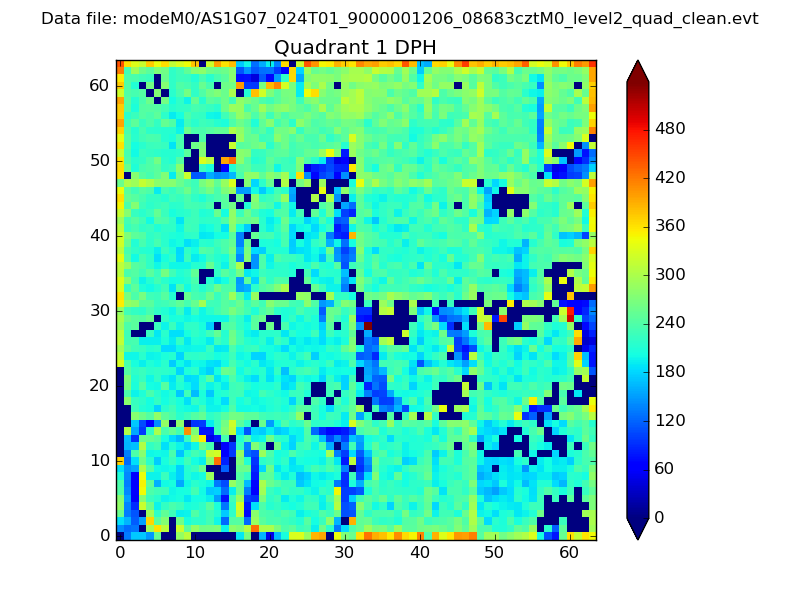
Histogram calculated using DETX and DETY for each event in the final _common_clean file
| Quadrant A | 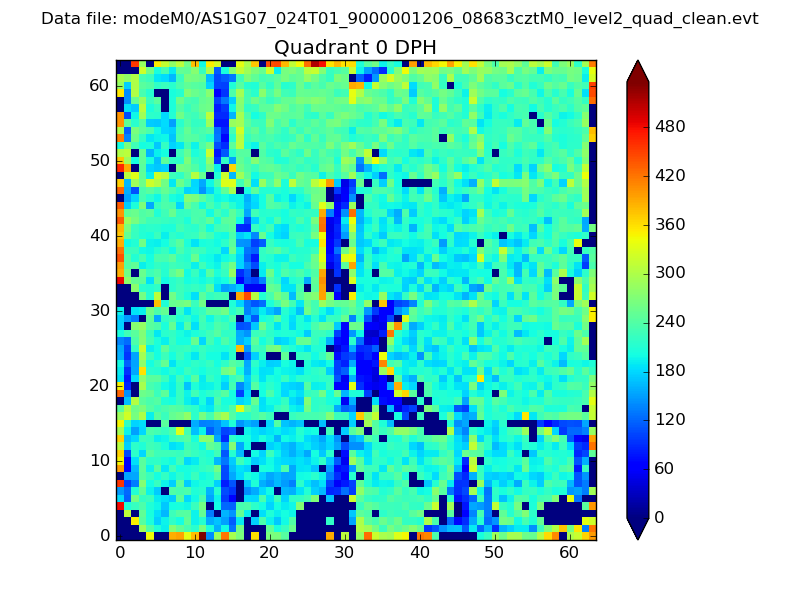 |
 |
Quadrant B |
|---|---|---|---|
| Quadrant D | 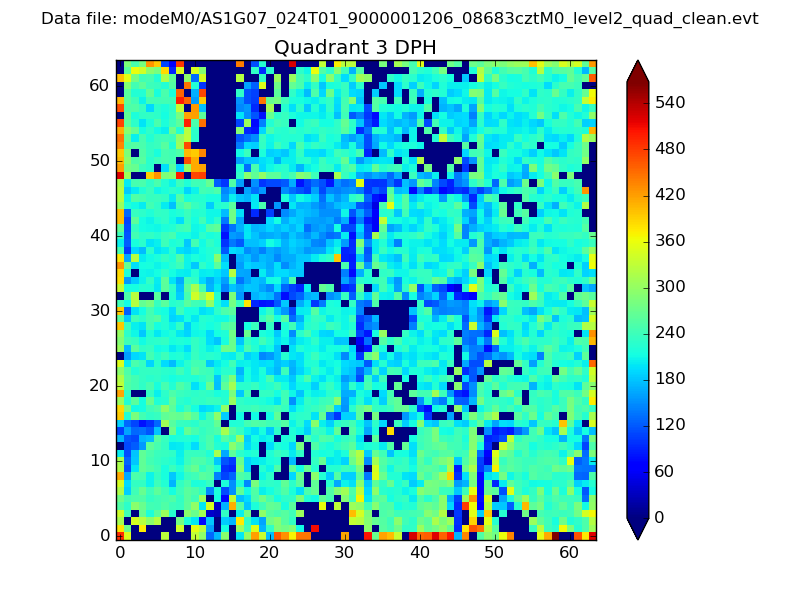 |
 |
Quadrant C |
| Plot type | Count rate plots | Images |
|---|---|---|
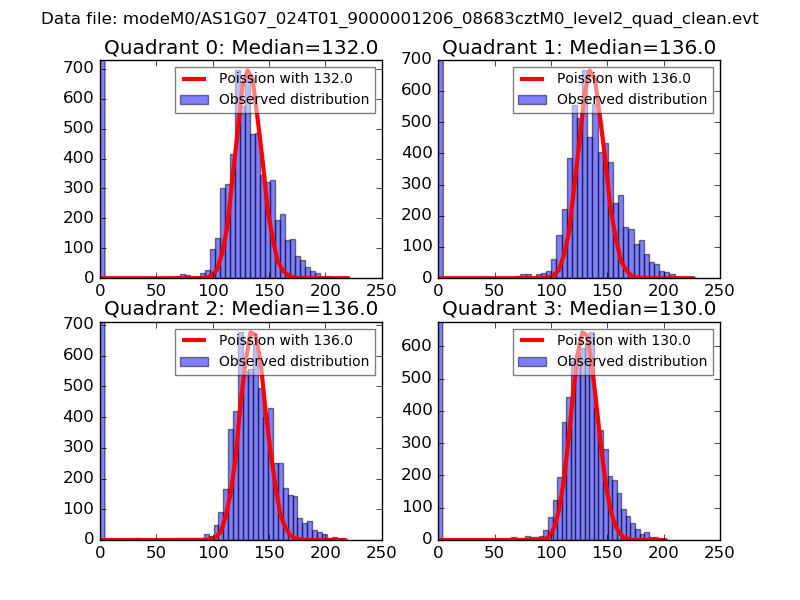
| Comparison with Poisson distribution Blue bars denote a histogram of data divided into 1 sec bins. Red curve is a Poisson curve with rate = median count rate of data. |
 |
 |
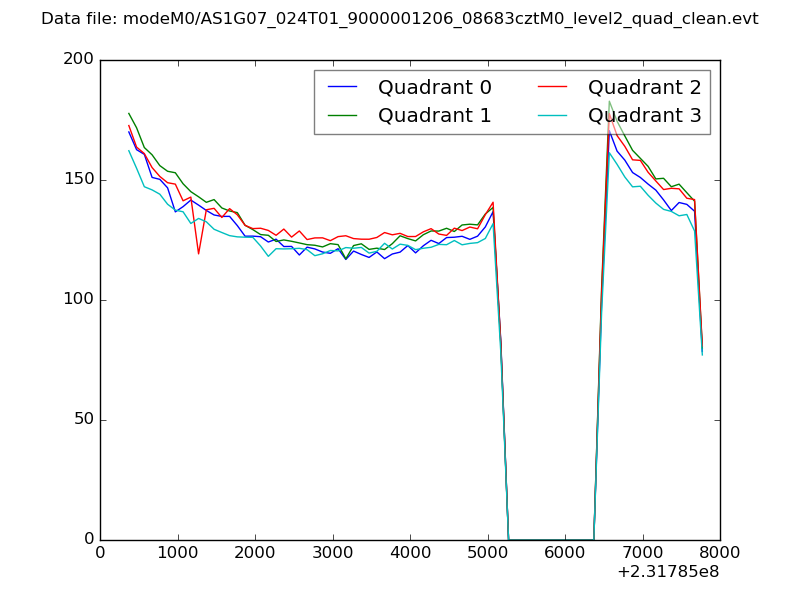
| Quadrant-wise count rates Data is divided into 100 sec bins |
 |
|
| Module-wise count rates for Quadrant A Data is divided into 100 sec bins |
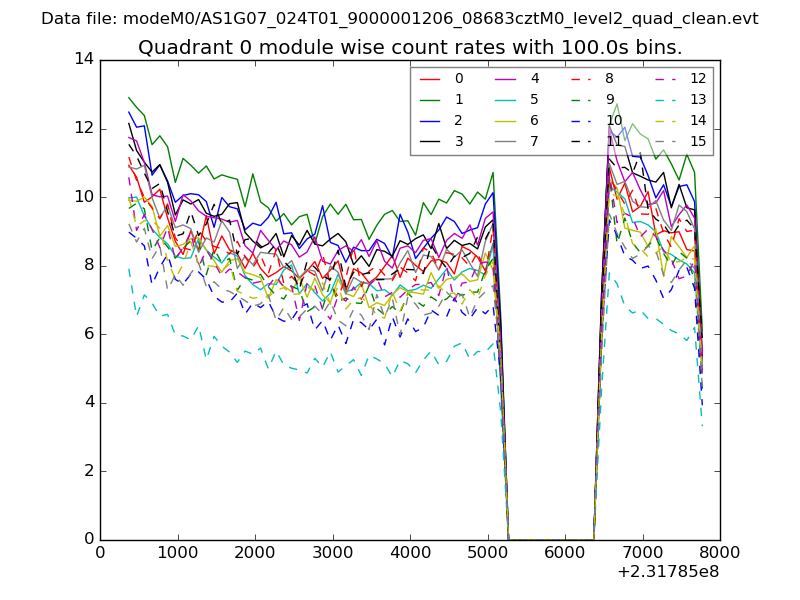 |
 |
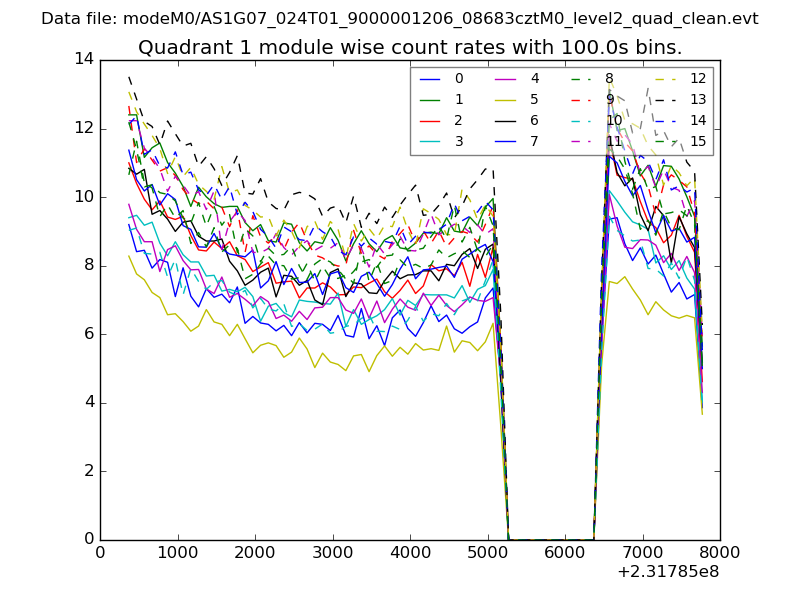
| Module-wise count rates for Quadrant B Data is divided into 100 sec bins |
 |
 |
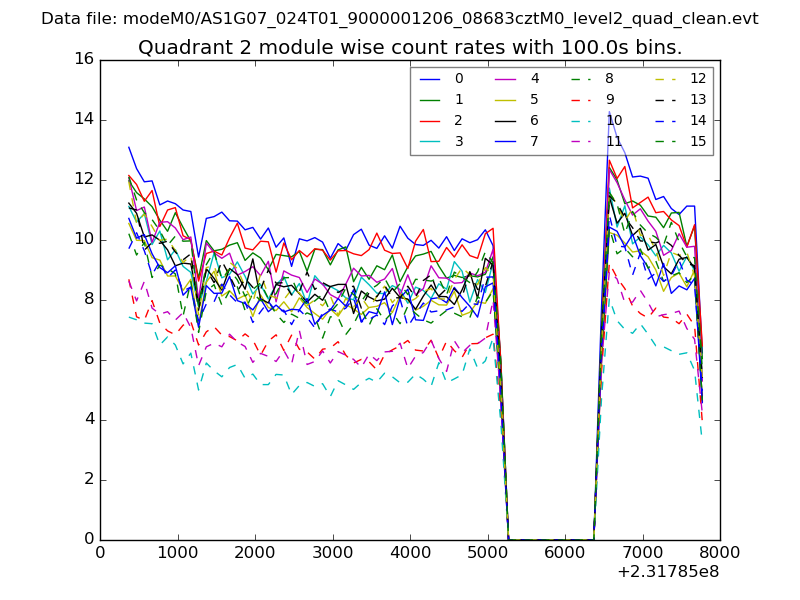
| Module-wise count rates for Quadrant C Data is divided into 100 sec bins |
 |
 |
| Module-wise count rates for Quadrant D Data is divided into 100 sec bins |
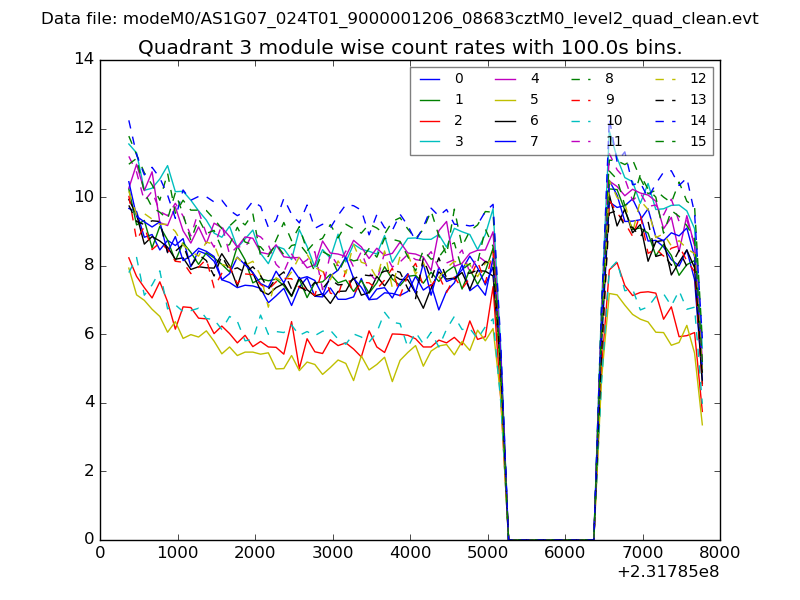 |
 |
| Parameter | Plot |
|---|---|
| CZT HV Monitor | 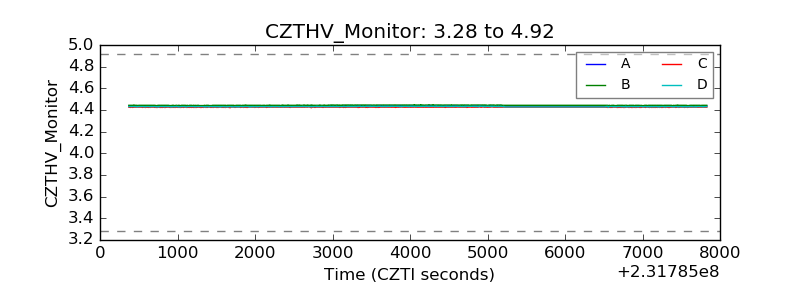 |
| D_VDD | 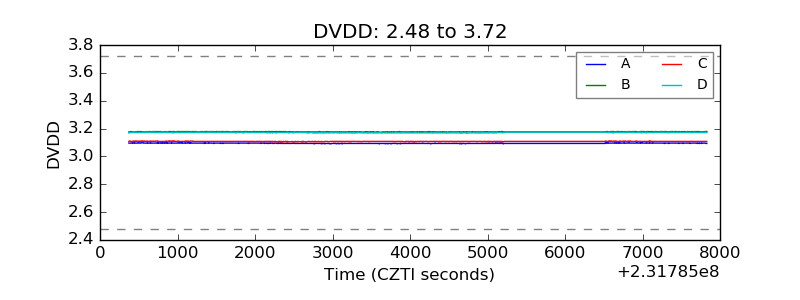 |
| Temperature 1 | 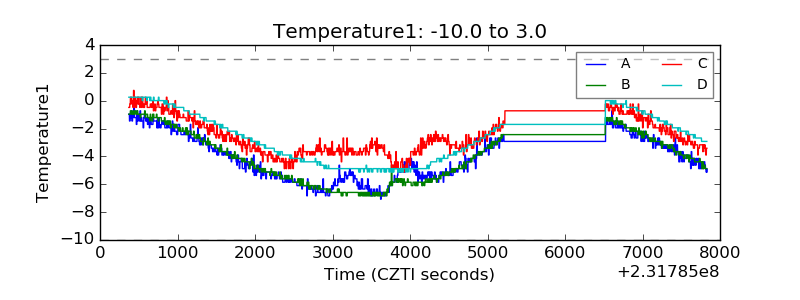 |
| Veto HV Monitor | 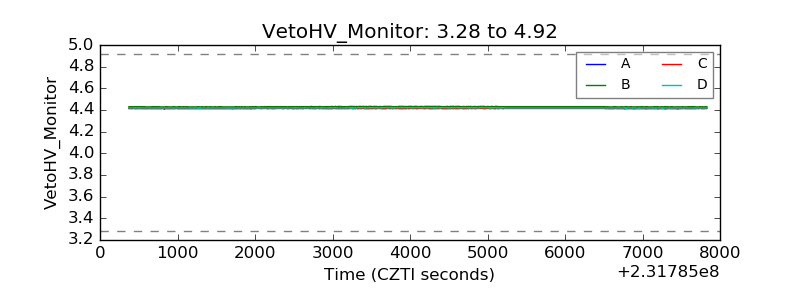 |
| Veto LLD | 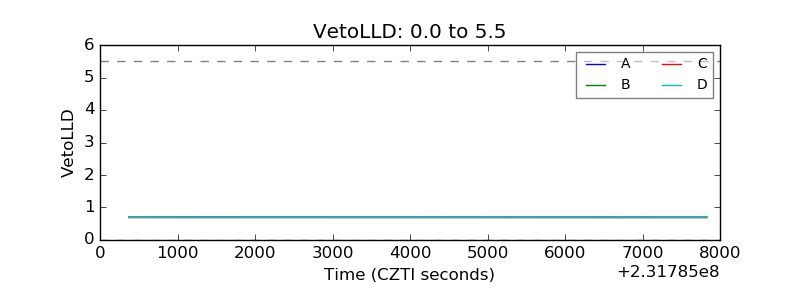 |
| Alpha Counter | 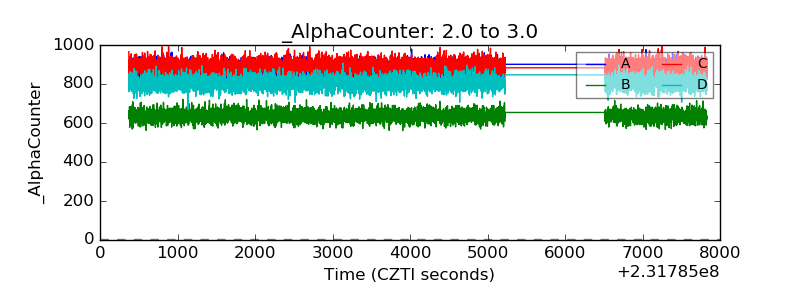 |
| _CPM_Rate | 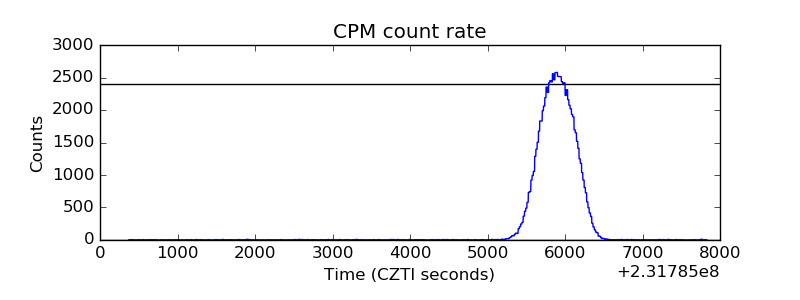 |
| CZT Counter | 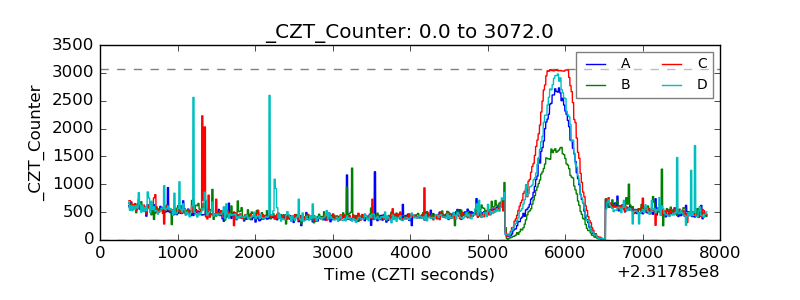 |
| +2.5 Volts monitor |  |
| +5 Volts monitor |  |
| _ROLL_ROT | 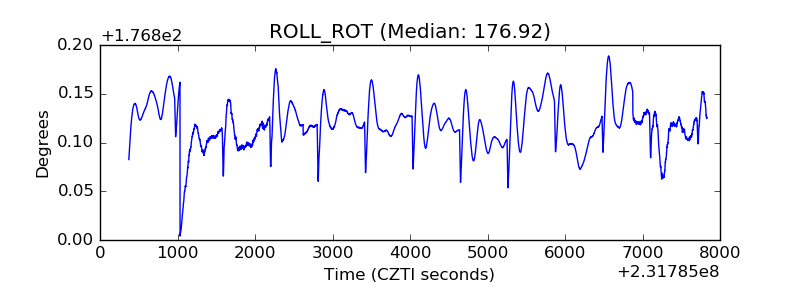 |
| _Roll_DEC | 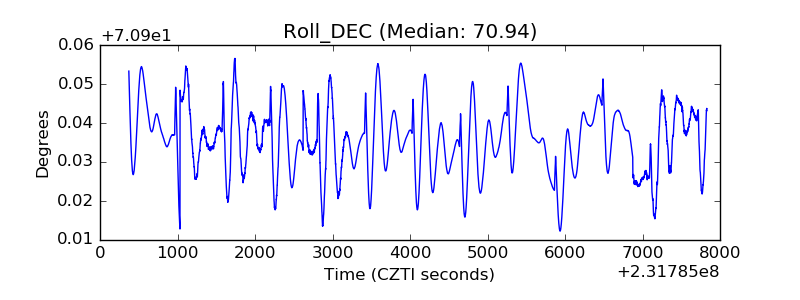 |
| _Roll_RA | 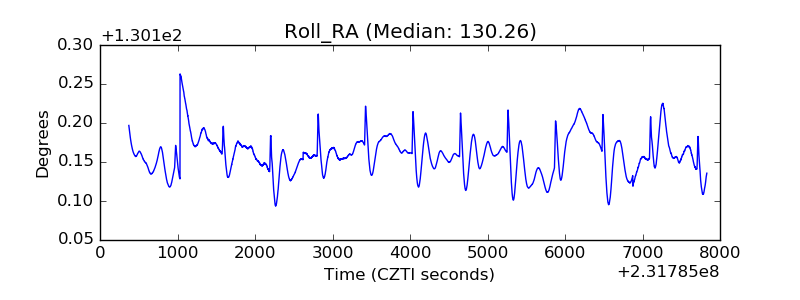 |
| Veto Counter | 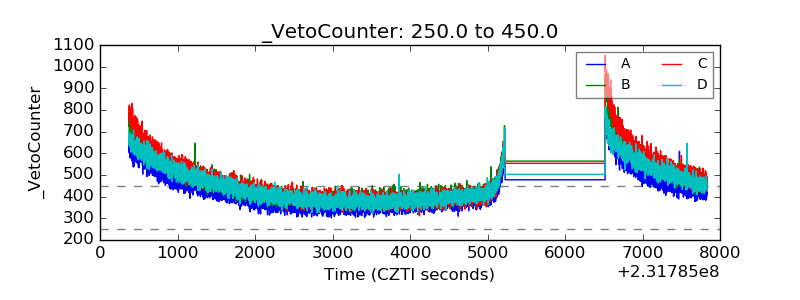 |