| Param | Original file | Final file |
|---|---|---|
| Filename | modeM0/AS1G07_024T01_9000001206_08686cztM0_level2.evt | modeM0/AS1G07_024T01_9000001206_08686cztM0_level2_quad_clean.evt |
| Size (bytes) | 483,338,880 | 116,665,920 |
| Size | 460.9 MB | 111.3 MB |
| Events in quadrant A | 2,824,895 | 776,846 |
| Events in quadrant B | 3,535,895 | 795,646 |
| Events in quadrant C | 4,489,096 | 761,351 |
| Events in quadrant D | 3,355,344 | 755,080 |
| Mode M0 | |||
|---|---|---|---|
| Quadrant | BADHDUFLAG | Total packets | Discarded packets |
| A | 0 | 13014 | 3 |
| B | 0 | 14874 | 2 |
| C | 0 | 17865 | 2 |
| D | 0 | 14690 | 2 |
| Mode M9 | |||
|---|---|---|---|
| Quadrant | BADHDUFLAG | Total packets | Discarded packets |
| A | 0 | 17 | 0 |
| B | 0 | 17 | 0 |
| C | 0 | 17 | 0 |
| D | 0 | 18 | 0 |
| Mode SS | |||
|---|---|---|---|
| Quadrant | BADHDUFLAG | Total packets | Discarded packets |
| A | 0 | 128 | 0 |
| B | 0 | 128 | 0 |
| C | 0 | 128 | 0 |
| D | 0 | 128 | 0 |
| Quadrant | Total seconds | Saturated seconds | Saturation percentage |
|---|---|---|---|
| A | 6372 | 14 | 0.219711% |
| B | 6372 | 159 | 2.495292% |
| C | 6372 | 588 | 9.227872% |
| D | 6372 | 127 | 1.993095% |
Noise dominated data is calculated using 1-second bins in cleaned event files. If a bin has >2000 counts, and if more than 50% of those come from <1% of pixels, then it is considered to be noise-dominated and hence unusable.
| Quadrant | # 1 sec bins | Bins with >0 counts | Bins with >2000 counts | High rate bins dominated by noise | Noise dominated (total time) | Noise dominated (detector-on time) | Marked lightcurve |
|---|---|---|---|---|---|---|---|
| A | 7477 | 6373 | 5 | 5 | 0.07% | 0.08% | 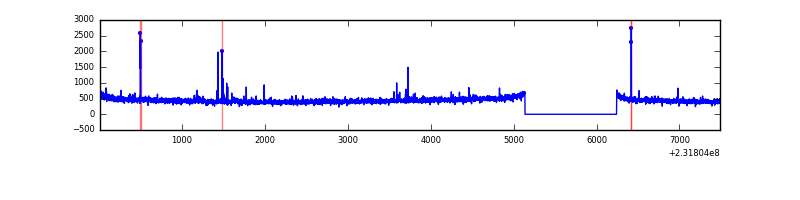 |
| B | 7477 | 6373 | 121 | 121 | 1.62% | 1.90% | 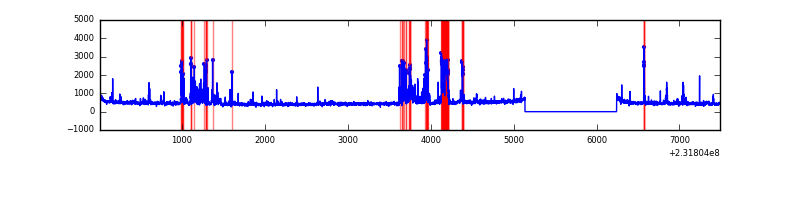 |
| C | 7477 | 6373 | 438 | 438 | 5.86% | 6.87% | 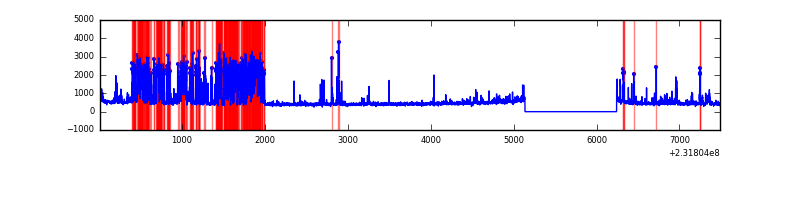 |
| D | 7477 | 6373 | 88 | 88 | 1.18% | 1.38% | 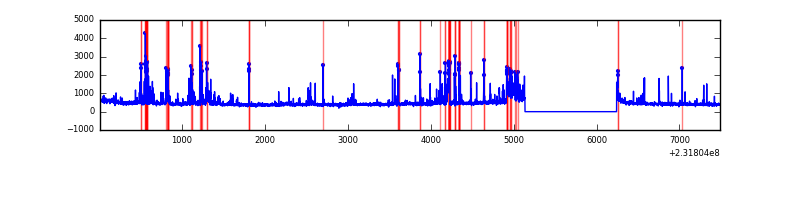 |
Top three noisy pixels from each quadrant. If the there are fewer than three noisy pixels in the level2.evt file, extra rows are filled as -1
| Pixel properties | Quadrant properties | ||||||
|---|---|---|---|---|---|---|---|
| Quadrant | DetID | PixID | Counts | Sigma | Mean | Median | Sigma |
| A | 13 | 251 | 24247 | 162.97 | 713 | 697 | 144.5 |
| A | 5 | 16 | 23592 | 158.43 | 713 | 697 | 144.5 |
| A | 15 | 174 | 21300 | 142.57 | 713 | 697 | 144.5 |
| B | 10 | 16 | 620127 | 4568.98 | 723 | 706 | 135.6 |
| B | 4 | 80 | 22770 | 162.75 | 723 | 706 | 135.6 |
| B | 0 | 230 | 21159 | 150.87 | 723 | 706 | 135.6 |
| C | 4 | 254 | 1679017 | 10771.03 | 683 | 686 | 155.8 |
| C | 1 | 16 | 124342 | 793.59 | 683 | 686 | 155.8 |
| C | 4 | 238 | 13731 | 83.72 | 683 | 686 | 155.8 |
| D | 2 | 152 | 221069 | 1302.87 | 696 | 676 | 169.2 |
| D | 1 | 52 | 213801 | 1259.91 | 696 | 676 | 169.2 |
| D | 12 | 233 | 95097 | 558.18 | 696 | 676 | 169.2 |
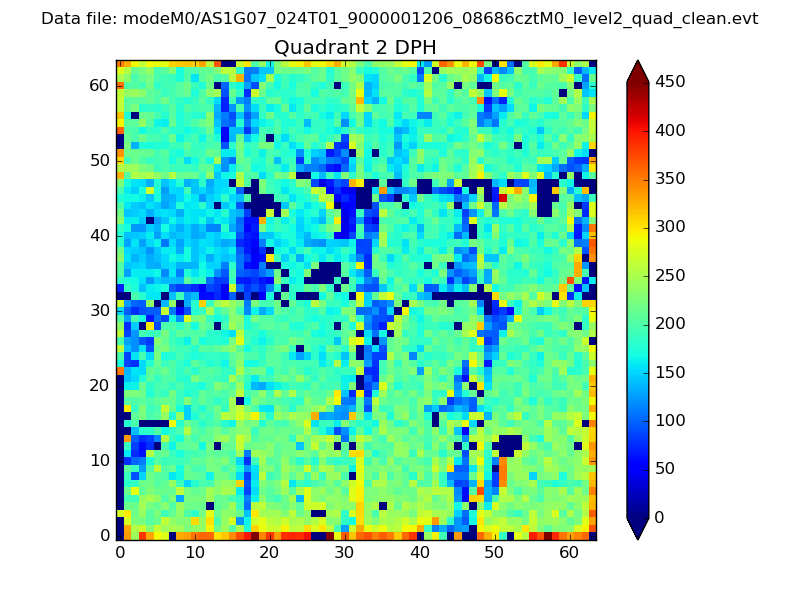
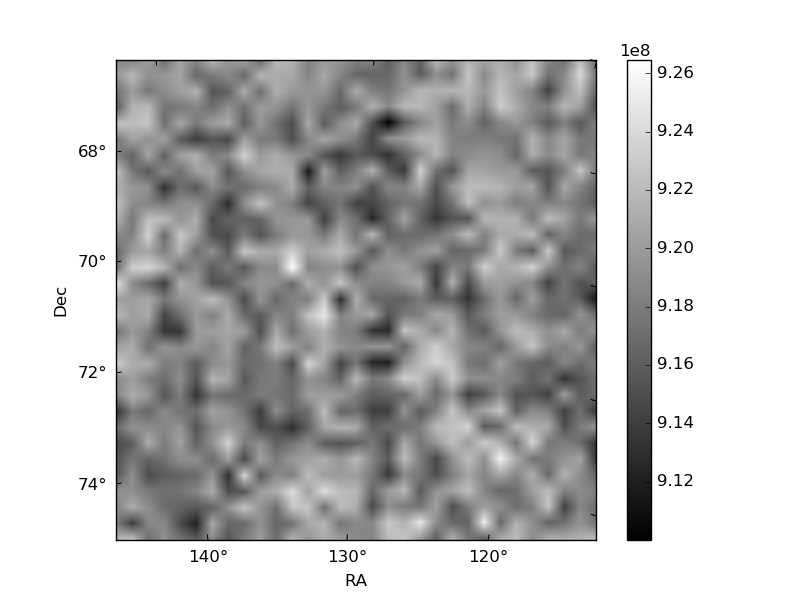
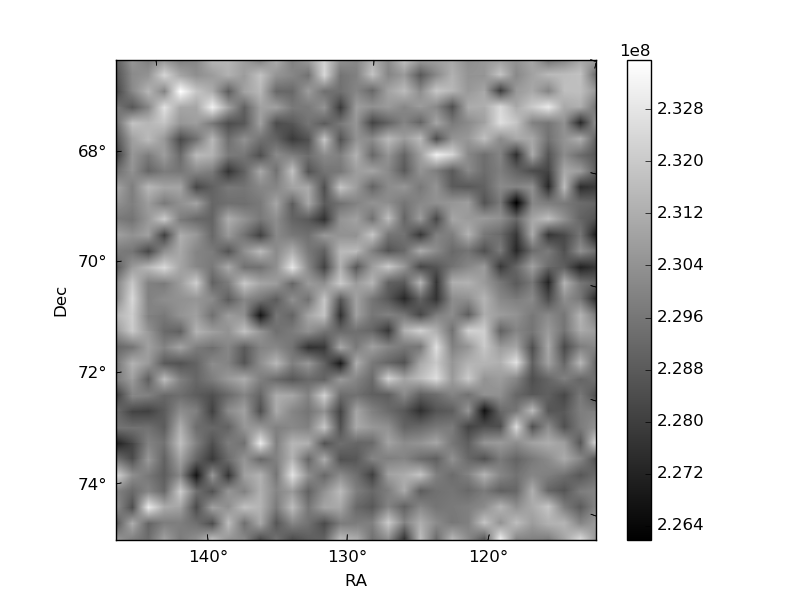
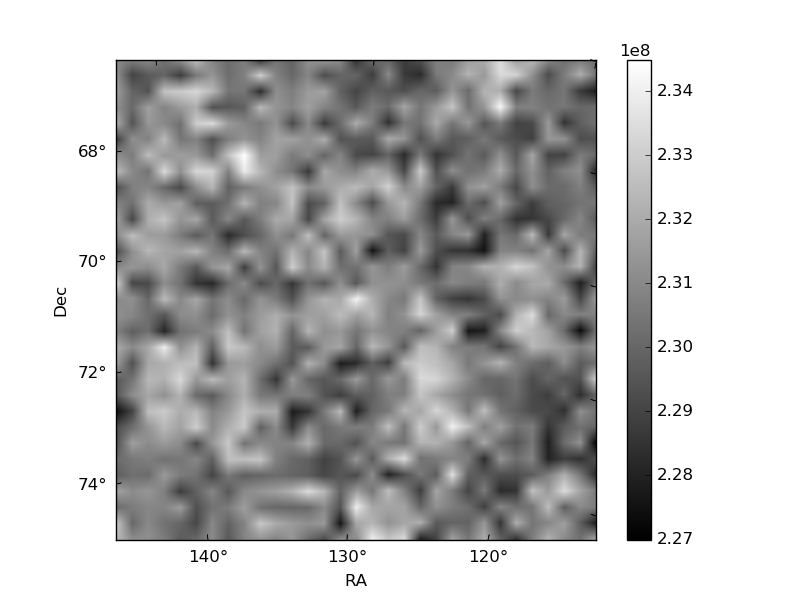
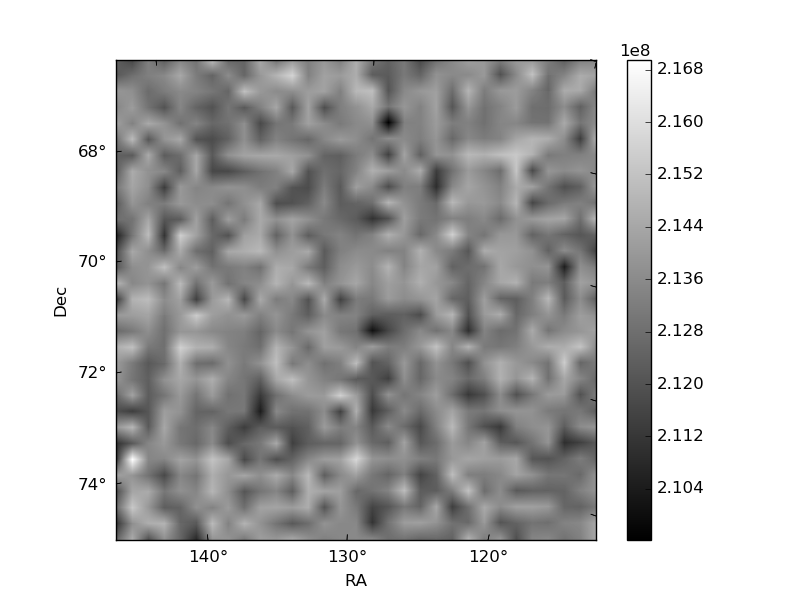
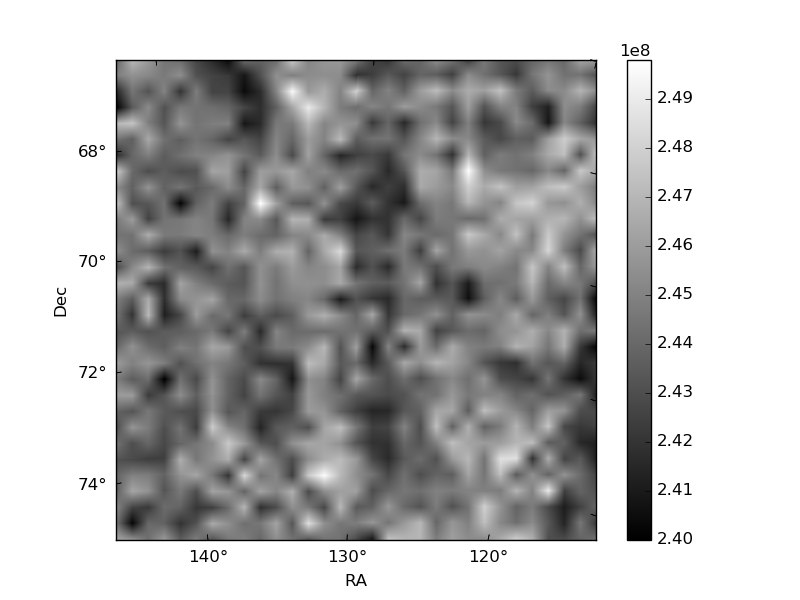
Histogram calculated using DETX and DETY for each event in the final _common_clean file
| Quadrant A | 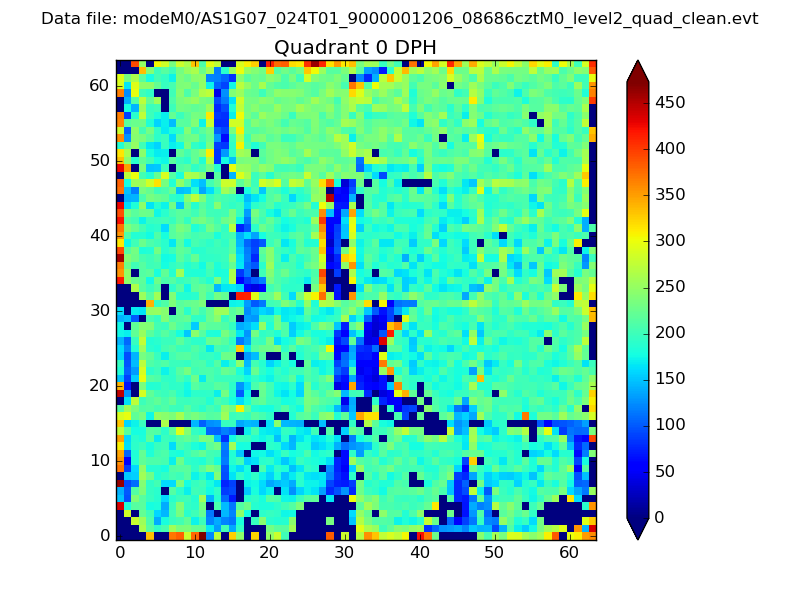 |
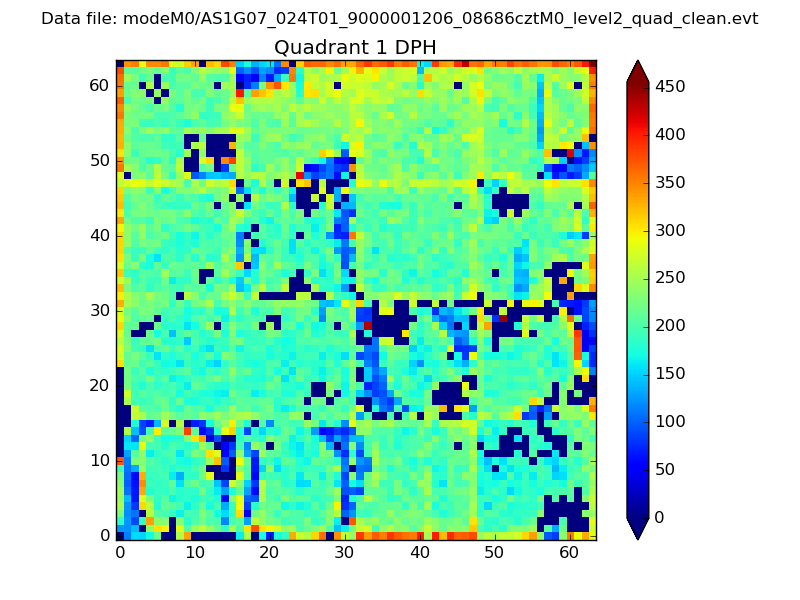 |
Quadrant B |
|---|---|---|---|
| Quadrant D | 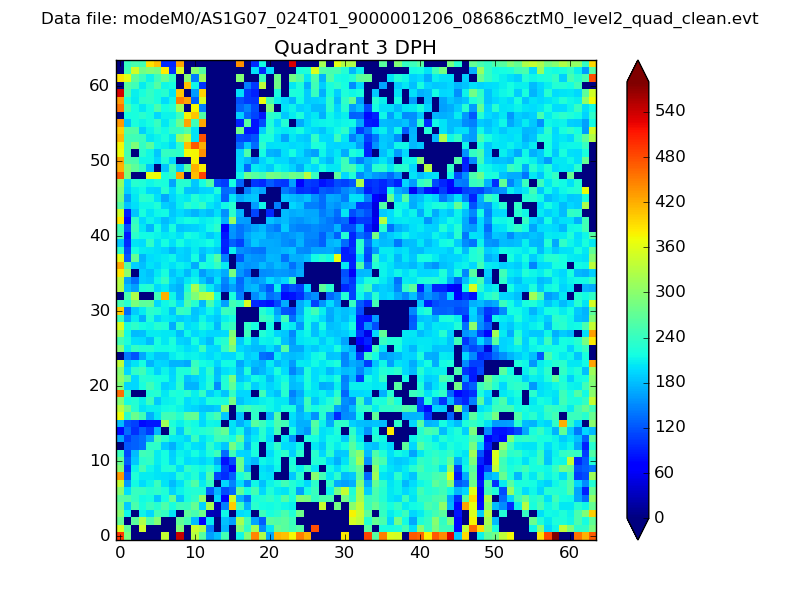 |
 |
Quadrant C |
| Plot type | Count rate plots | Images |
|---|---|---|
| Comparison with Poisson distribution Blue bars denote a histogram of data divided into 1 sec bins. Red curve is a Poisson curve with rate = median count rate of data. |
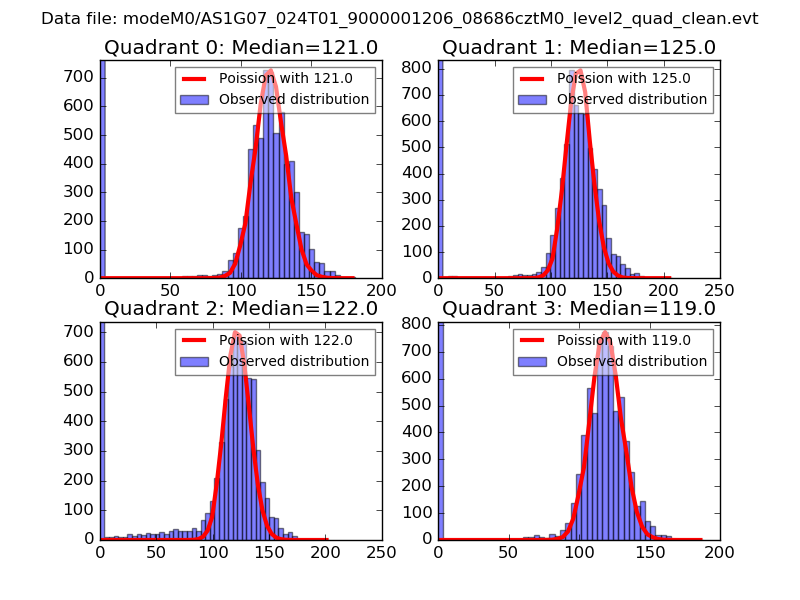 |
 |
| Quadrant-wise count rates Data is divided into 100 sec bins |
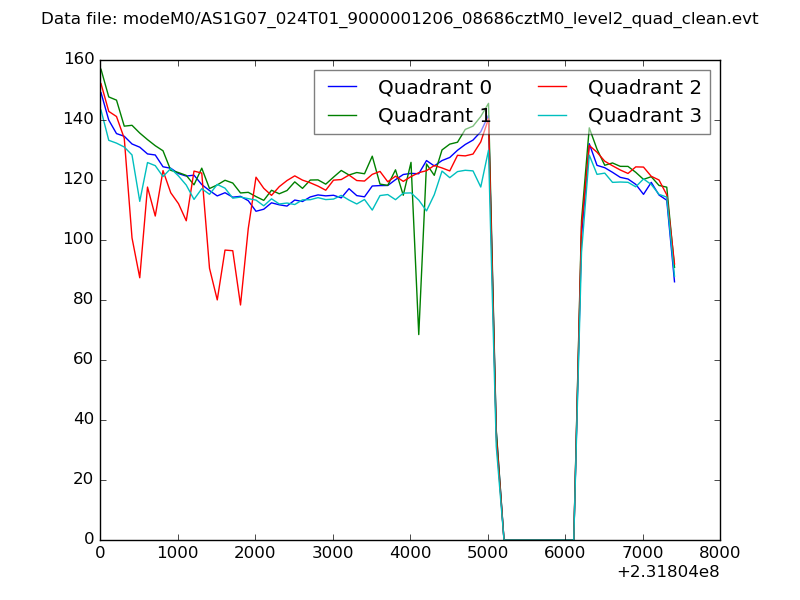 |
|
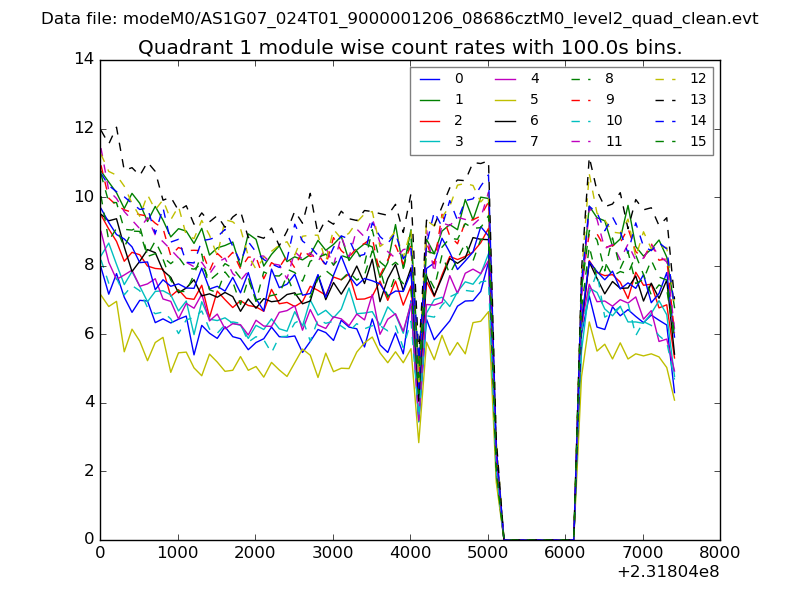
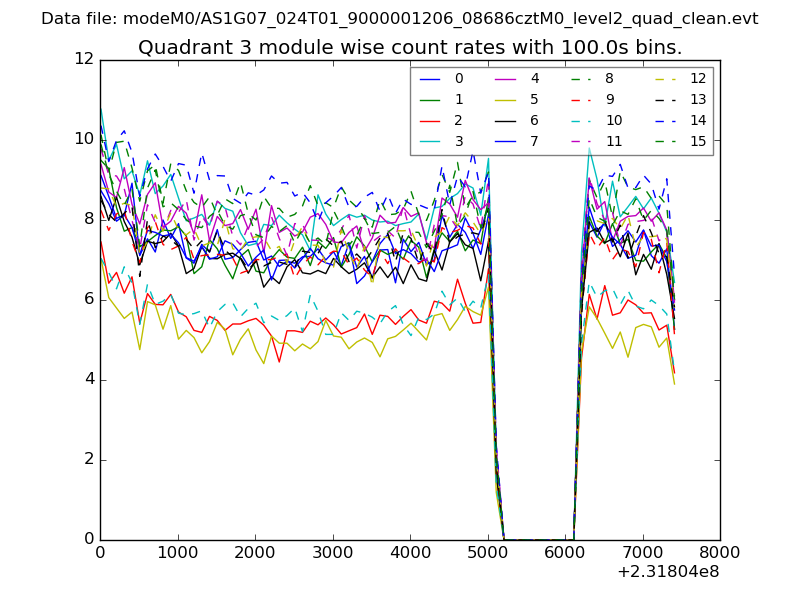
| Module-wise count rates for Quadrant A Data is divided into 100 sec bins |
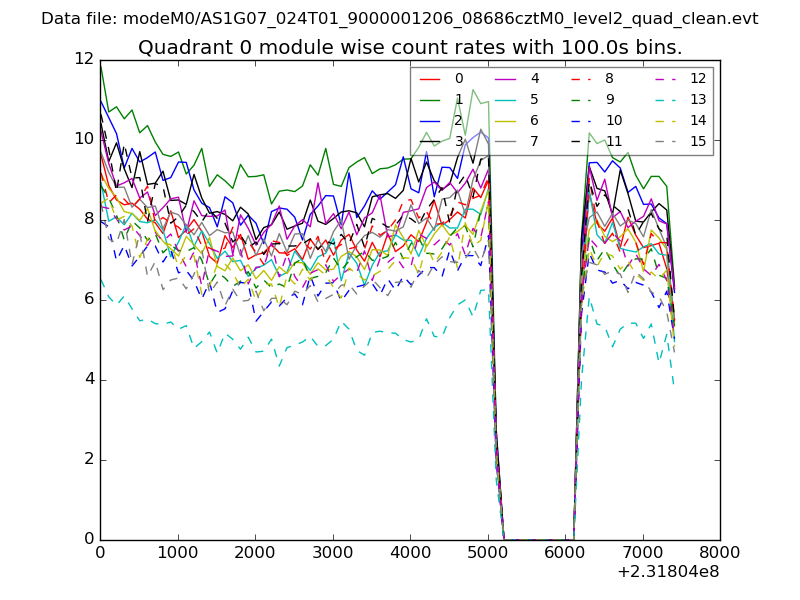 |
 |
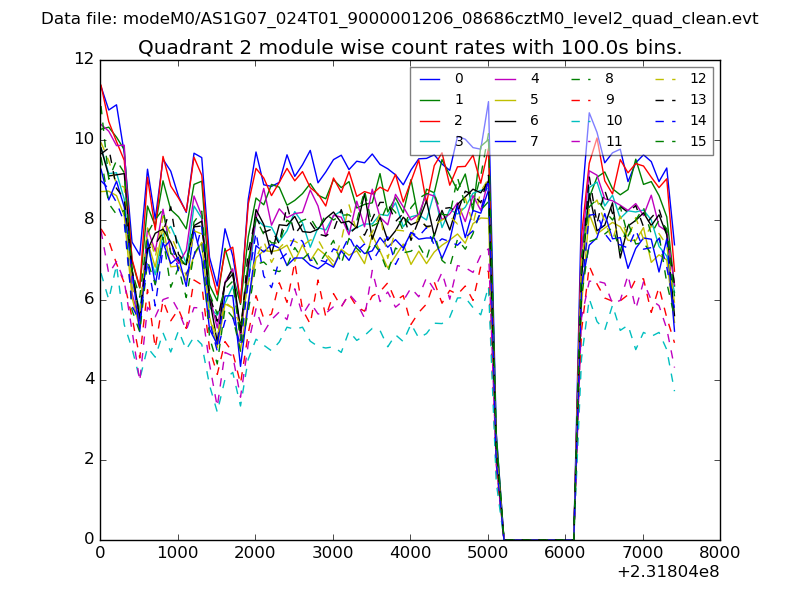
| Module-wise count rates for Quadrant B Data is divided into 100 sec bins |
 |
 |
| Module-wise count rates for Quadrant C Data is divided into 100 sec bins |
 |
 |
| Module-wise count rates for Quadrant D Data is divided into 100 sec bins |
 |
 |
| Parameter | Plot |
|---|---|
| CZT HV Monitor | 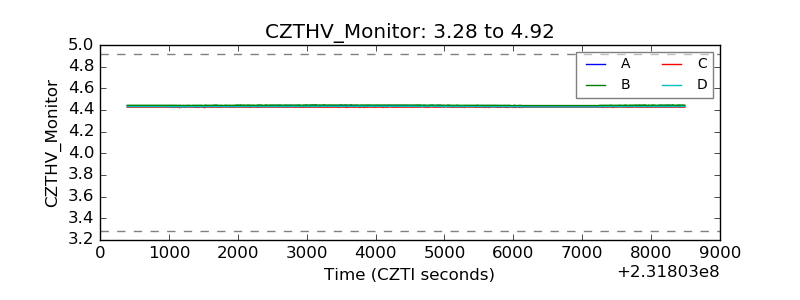 |
| D_VDD | 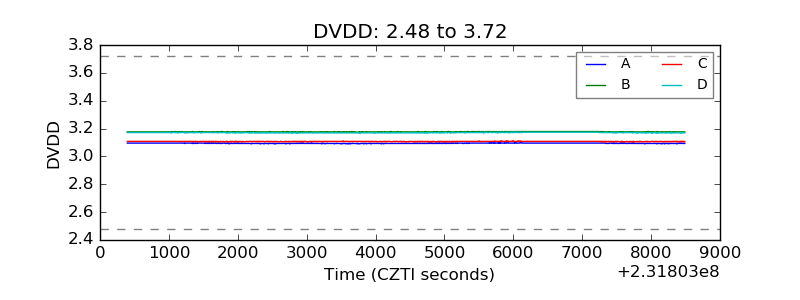 |
| Temperature 1 | 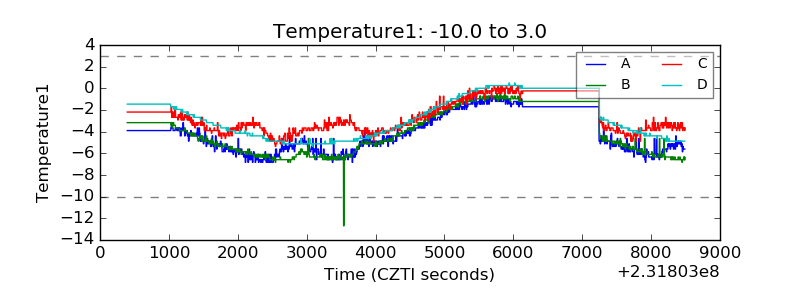 |
| Veto HV Monitor |  |
| Veto LLD | 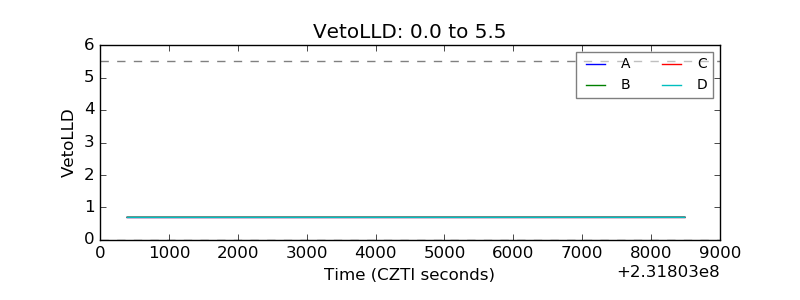 |
| Alpha Counter | 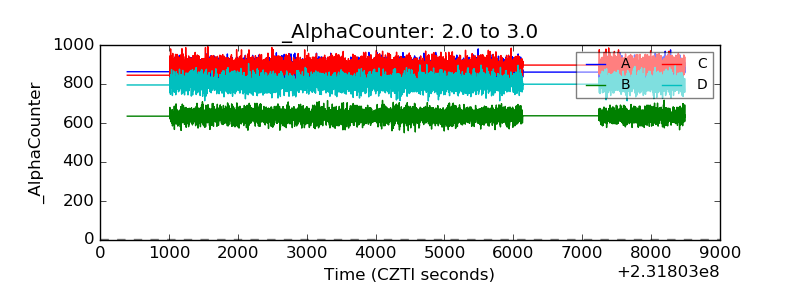 |
| _CPM_Rate | 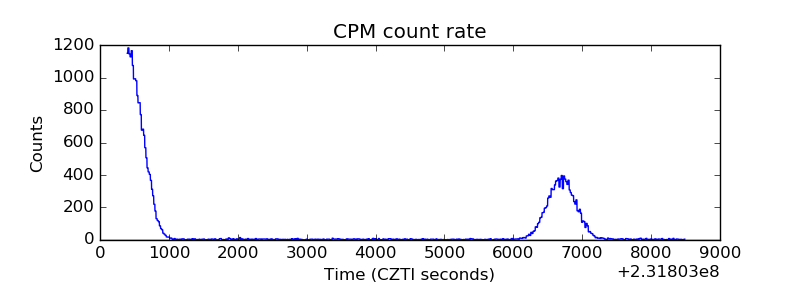 |
| CZT Counter | 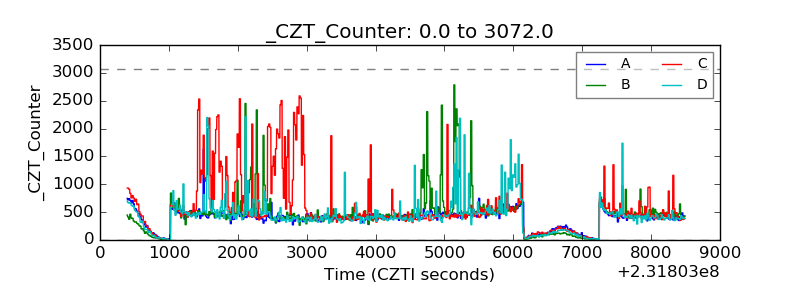 |
| +2.5 Volts monitor |  |
| +5 Volts monitor |  |
| _ROLL_ROT | 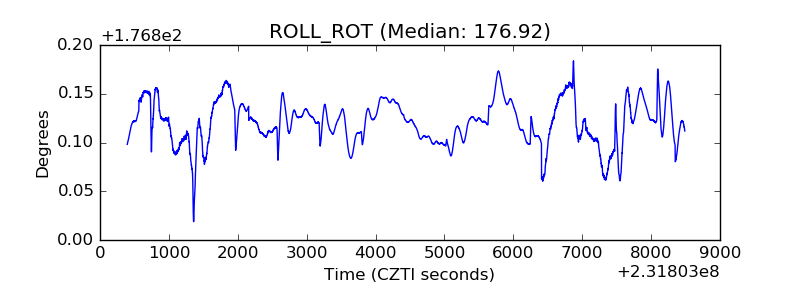 |
| _Roll_DEC |  |
| _Roll_RA | 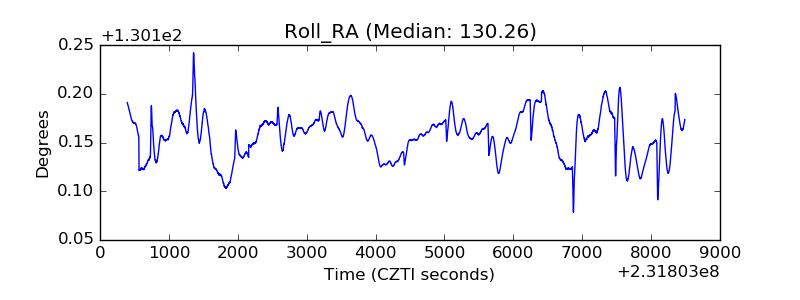 |
| Veto Counter | 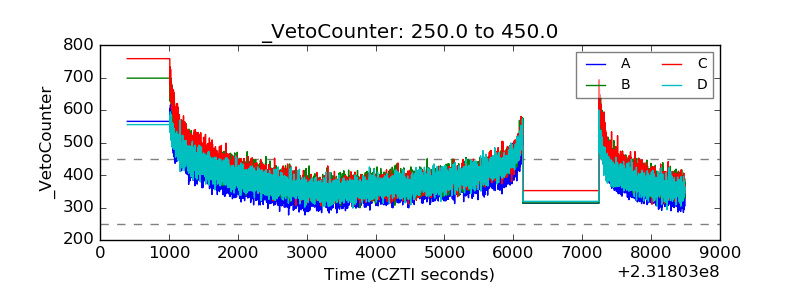 |