| Param | Original file | Final file |
|---|---|---|
| Filename | modeM0/AS1G07_024T01_9000001206_08688cztM0_level2.evt | modeM0/AS1G07_024T01_9000001206_08688cztM0_level2_quad_clean.evt |
| Size (bytes) | 510,350,400 | 130,003,200 |
| Size | 486.7 MB | 124.0 MB |
| Events in quadrant A | 3,200,193 | 852,703 |
| Events in quadrant B | 3,723,441 | 878,640 |
| Events in quadrant C | 4,065,273 | 864,012 |
| Events in quadrant D | 3,966,611 | 829,393 |
| Mode M0 | |||
|---|---|---|---|
| Quadrant | BADHDUFLAG | Total packets | Discarded packets |
| A | 0 | 15093 | 2 |
| B | 0 | 16200 | 1 |
| C | 0 | 17599 | 1 |
| D | 0 | 17397 | 1 |
| Mode M9 | |||
|---|---|---|---|
| Quadrant | BADHDUFLAG | Total packets | Discarded packets |
| A | 0 | 2 | 0 |
| B | 0 | 2 | 0 |
| C | 0 | 2 | 0 |
| D | 0 | 2 | 0 |
| Mode SS | |||
|---|---|---|---|
| Quadrant | BADHDUFLAG | Total packets | Discarded packets |
| A | 0 | 150 | 0 |
| B | 0 | 150 | 0 |
| C | 0 | 150 | 0 |
| D | 0 | 150 | 0 |
| Quadrant | Total seconds | Saturated seconds | Saturation percentage |
|---|---|---|---|
| A | 7370 | 105 | 1.424695% |
| B | 7370 | 190 | 2.578019% |
| C | 7370 | 279 | 3.785617% |
| D | 7370 | 284 | 3.853460% |
Noise dominated data is calculated using 1-second bins in cleaned event files. If a bin has >2000 counts, and if more than 50% of those come from <1% of pixels, then it is considered to be noise-dominated and hence unusable.
| Quadrant | # 1 sec bins | Bins with >0 counts | Bins with >2000 counts | High rate bins dominated by noise | Noise dominated (total time) | Noise dominated (detector-on time) | Marked lightcurve |
|---|---|---|---|---|---|---|---|
| A | 7500 | 7372 | 4 | 4 | 0.05% | 0.05% | 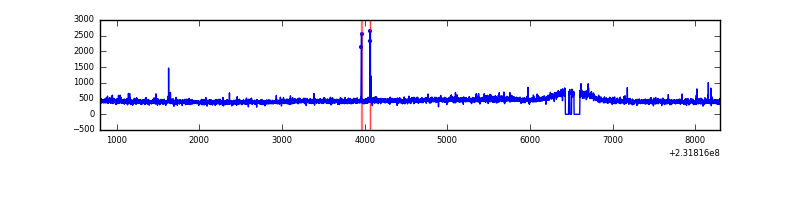 |
| B | 7500 | 7373 | 33 | 33 | 0.44% | 0.45% | 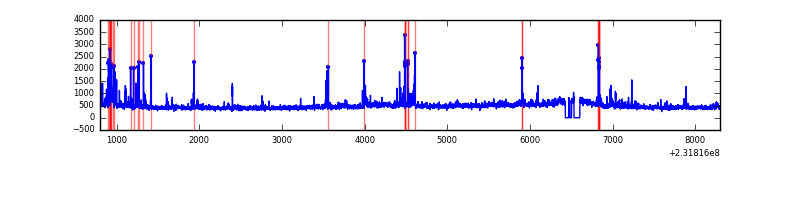 |
| C | 7500 | 7373 | 158 | 158 | 2.11% | 2.14% | 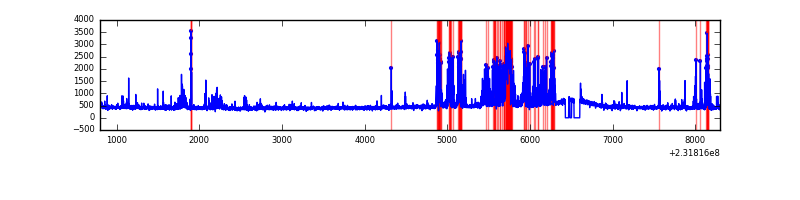 |
| D | 7500 | 7373 | 203 | 203 | 2.71% | 2.75% | 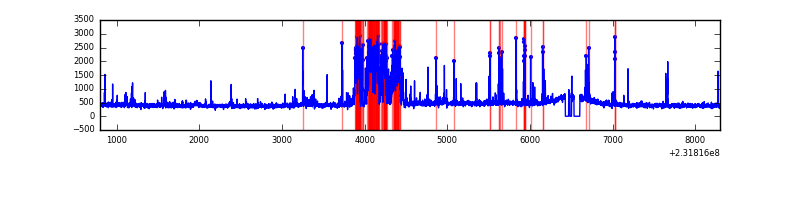 |
Top three noisy pixels from each quadrant. If the there are fewer than three noisy pixels in the level2.evt file, extra rows are filled as -1
| Pixel properties | Quadrant properties | ||||||
|---|---|---|---|---|---|---|---|
| Quadrant | DetID | PixID | Counts | Sigma | Mean | Median | Sigma |
| A | 15 | 174 | 20566 | 117.83 | 820 | 800 | 167.8 |
| A | 13 | 251 | 15218 | 85.95 | 820 | 800 | 167.8 |
| A | 5 | 16 | 9204 | 50.1 | 820 | 800 | 167.8 |
| B | 10 | 16 | 187343 | 1175.76 | 834 | 813 | 158.6 |
| B | 4 | 48 | 130888 | 819.91 | 834 | 813 | 158.6 |
| B | 0 | 219 | 103091 | 644.69 | 834 | 813 | 158.6 |
| C | 4 | 254 | 895120 | 4788.89 | 805 | 805 | 186.7 |
| C | 1 | 16 | 24530 | 127.04 | 805 | 805 | 186.7 |
| C | 13 | 61 | 6161 | 28.68 | 805 | 805 | 186.7 |
| D | 2 | 152 | 682630 | 3514.2 | 797 | 772 | 194.0 |
| D | 7 | 71 | 100521 | 514.09 | 797 | 772 | 194.0 |
| D | 2 | 14 | 73323 | 373.92 | 797 | 772 | 194.0 |
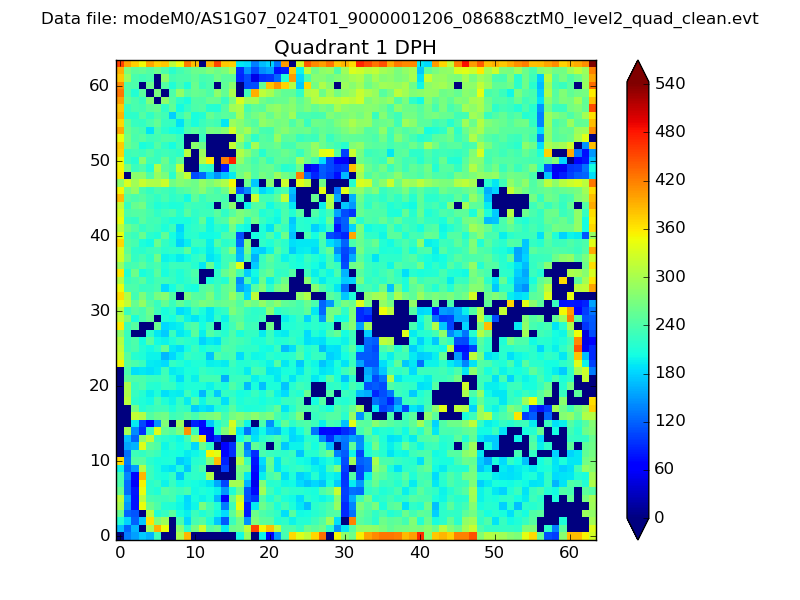
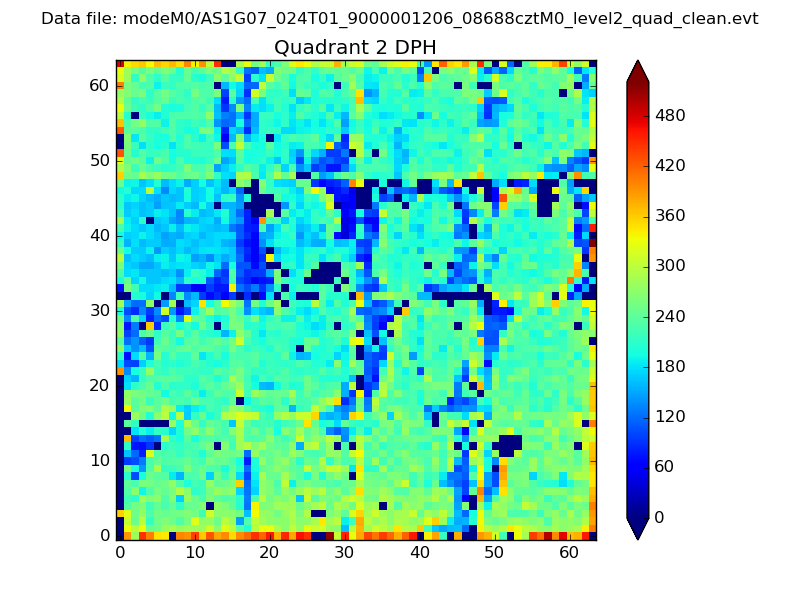
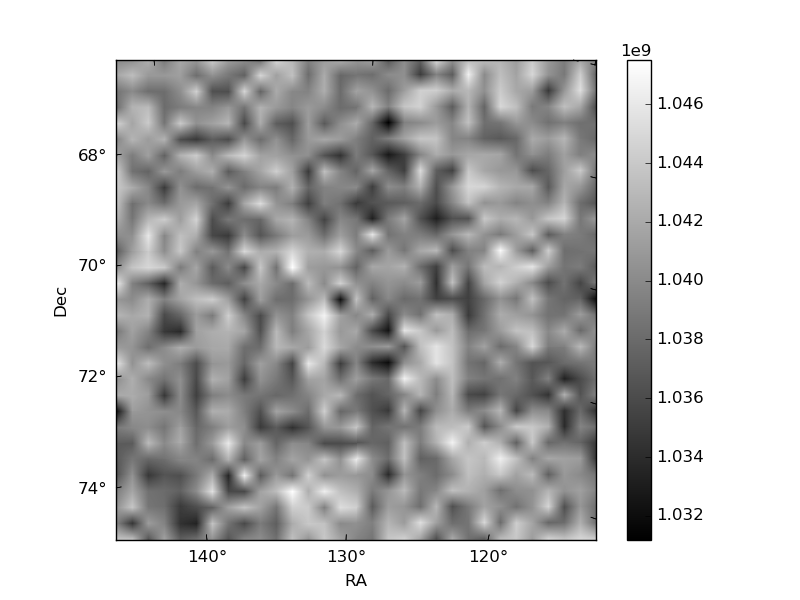
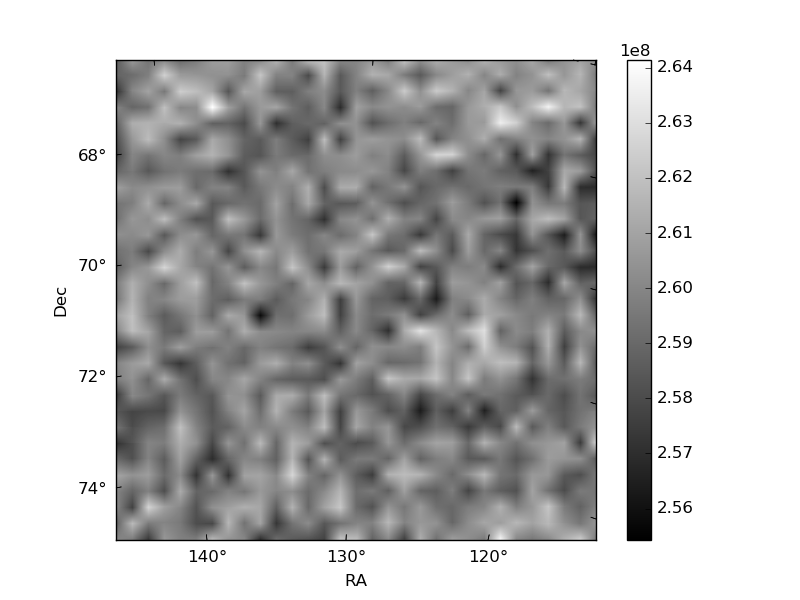
Histogram calculated using DETX and DETY for each event in the final _common_clean file
| Quadrant A |  |
 |
Quadrant B |
|---|---|---|---|
| Quadrant D | 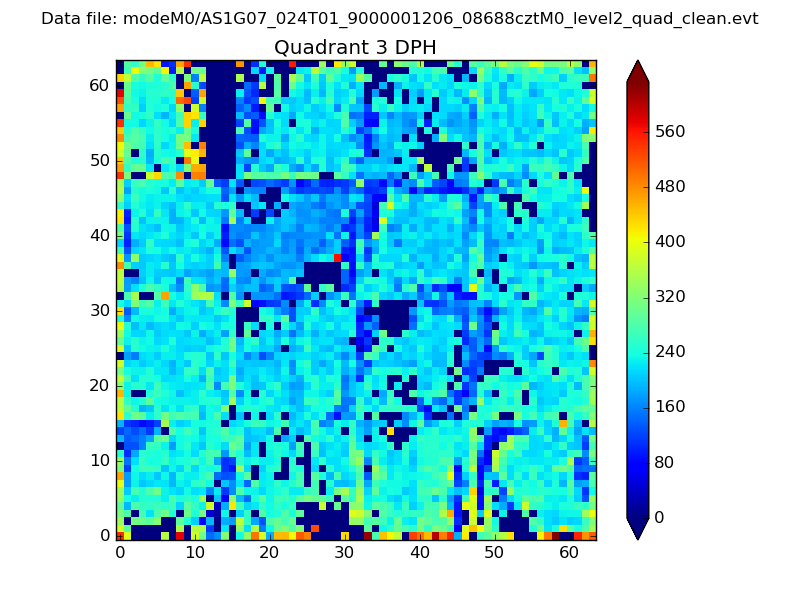 |
 |
Quadrant C |
| Plot type | Count rate plots | Images |
|---|---|---|
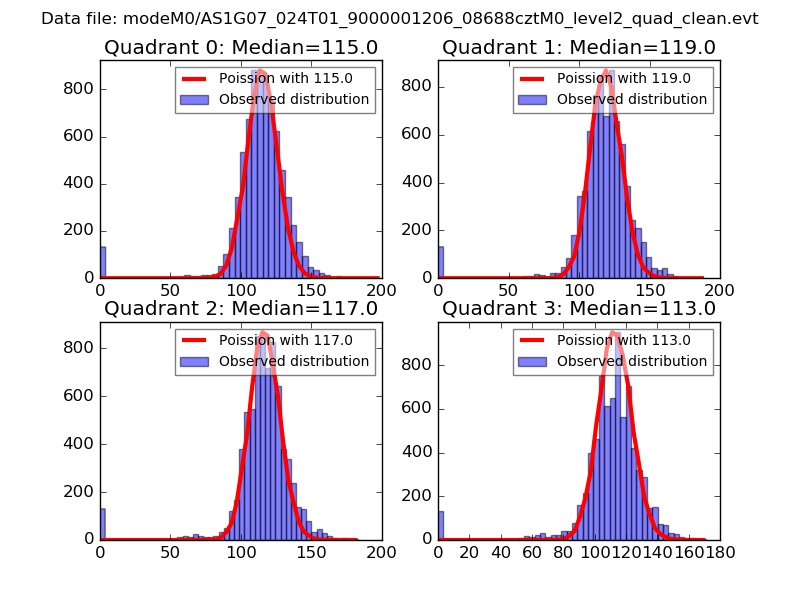
| Comparison with Poisson distribution Blue bars denote a histogram of data divided into 1 sec bins. Red curve is a Poisson curve with rate = median count rate of data. |
 |
 |
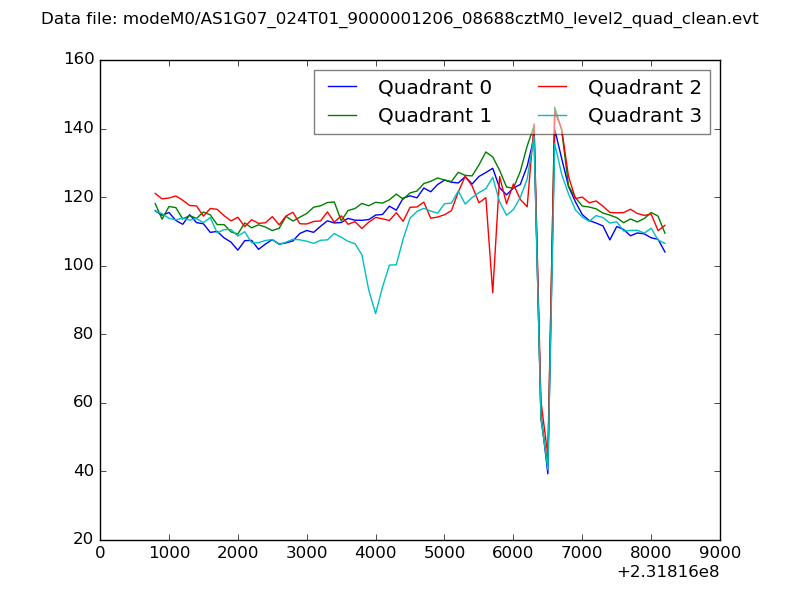
| Quadrant-wise count rates Data is divided into 100 sec bins |
 |
|
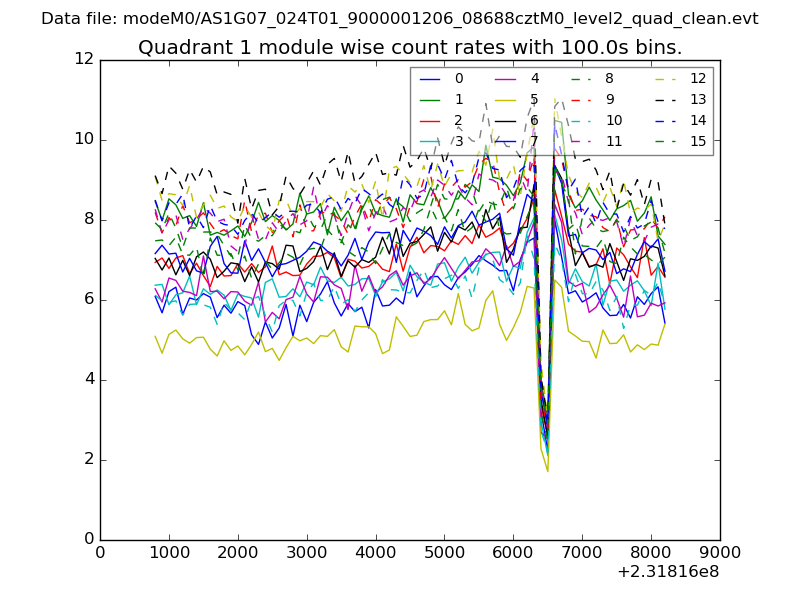
| Module-wise count rates for Quadrant A Data is divided into 100 sec bins |
 |
 |
| Module-wise count rates for Quadrant B Data is divided into 100 sec bins |
 |
 |
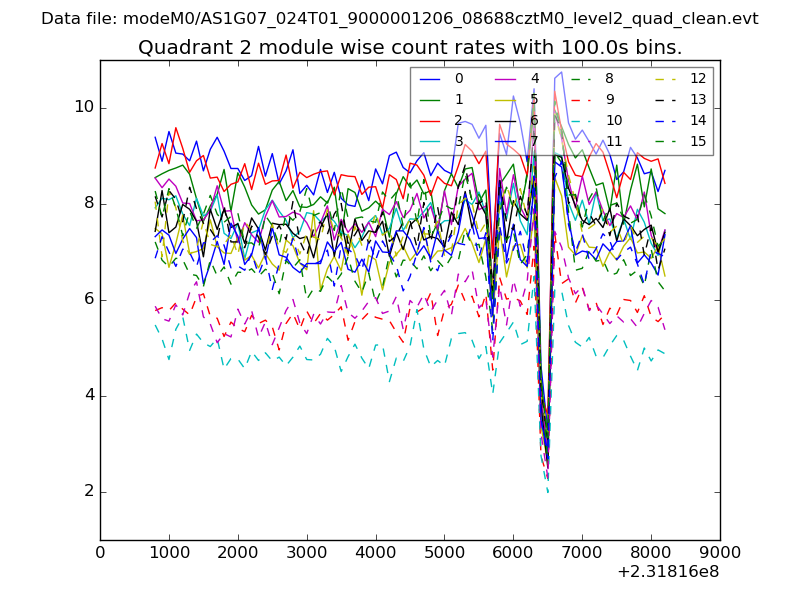
| Module-wise count rates for Quadrant C Data is divided into 100 sec bins |
 |
 |
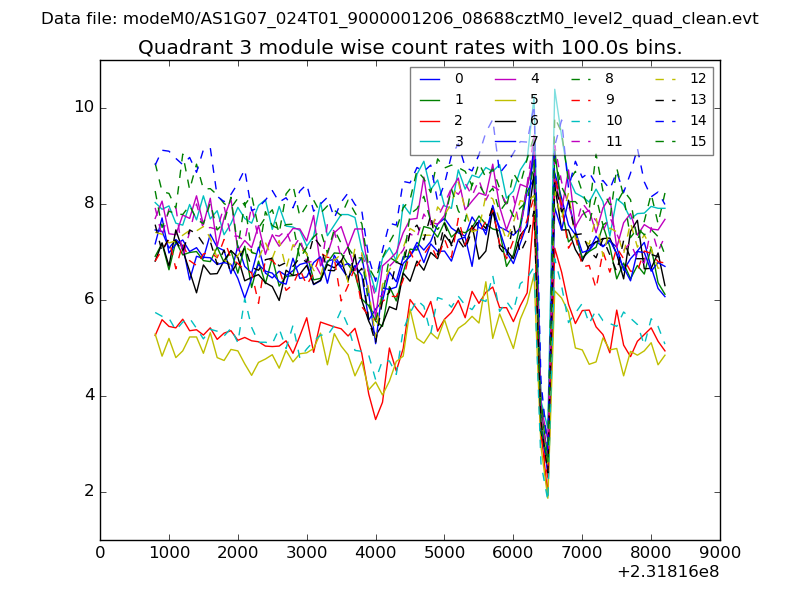
| Module-wise count rates for Quadrant D Data is divided into 100 sec bins |
 |
 |
| Parameter | Plot |
|---|---|
| CZT HV Monitor | 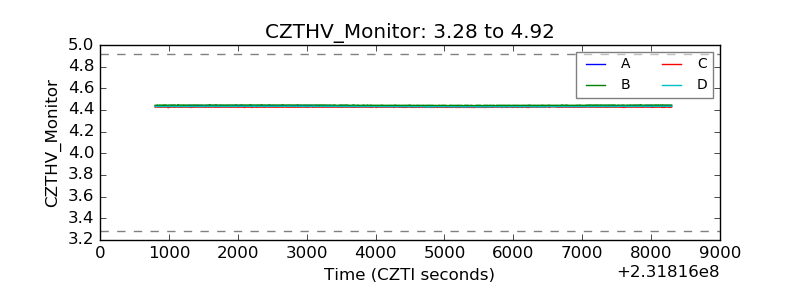 |
| D_VDD | 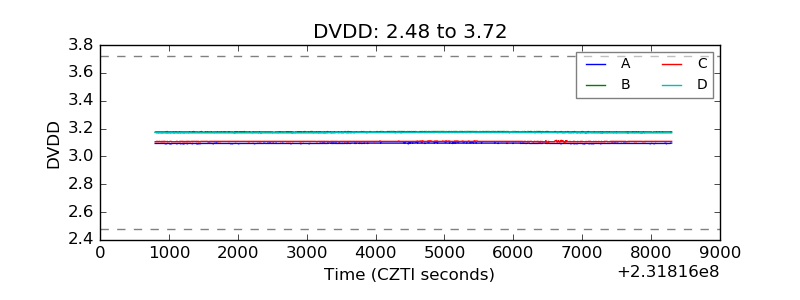 |
| Temperature 1 | 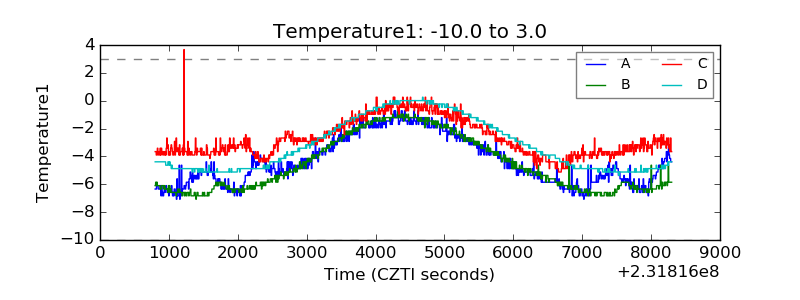 |
| Veto HV Monitor | 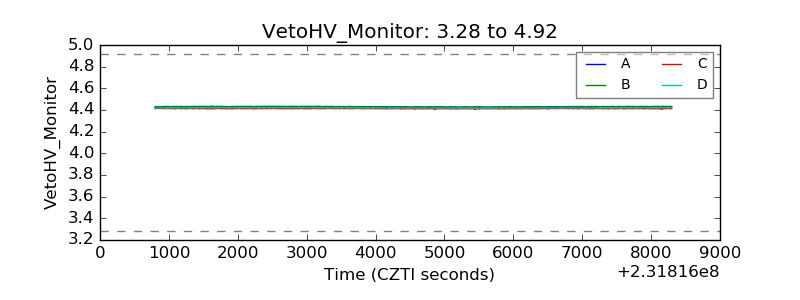 |
| Veto LLD |  |
| Alpha Counter | 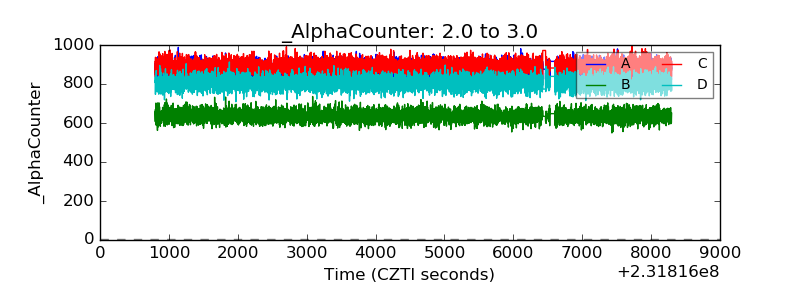 |
| _CPM_Rate | 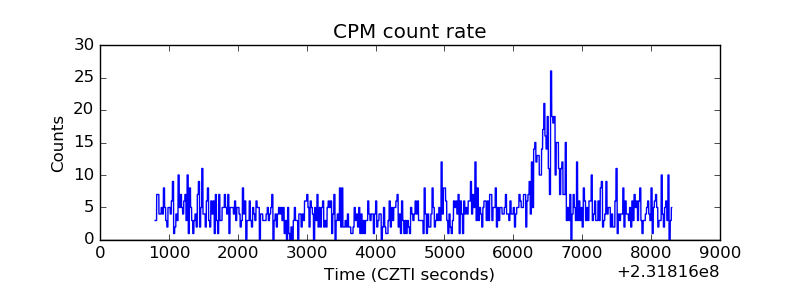 |
| CZT Counter | 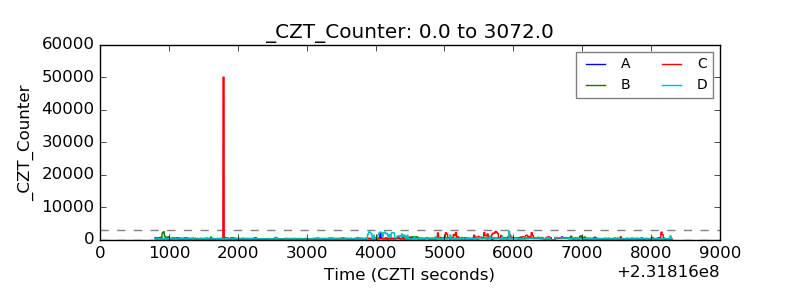 |
| +2.5 Volts monitor |  |
| +5 Volts monitor |  |
| _ROLL_ROT | 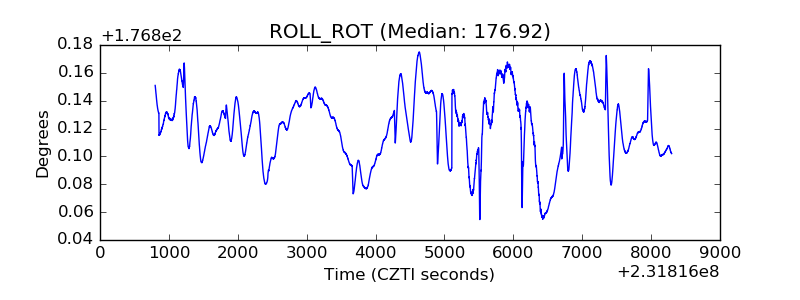 |
| _Roll_DEC | 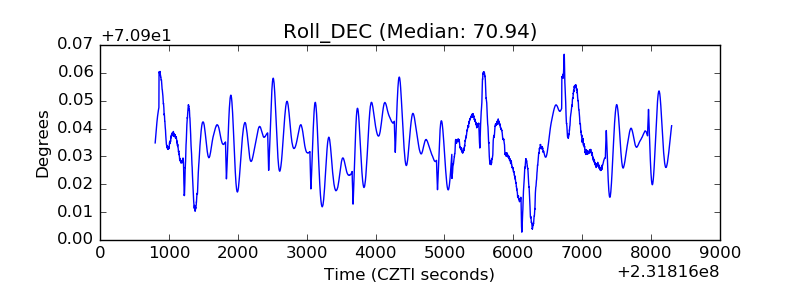 |
| _Roll_RA | 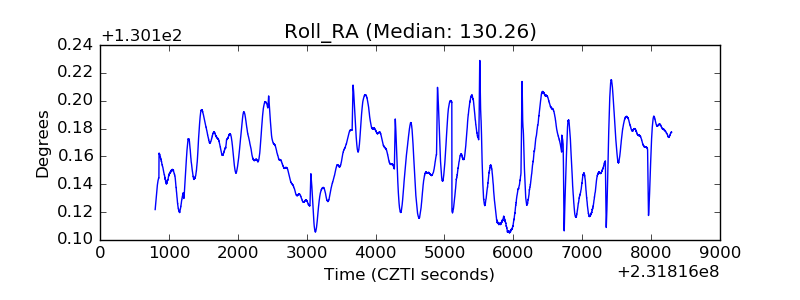 |
| Veto Counter | 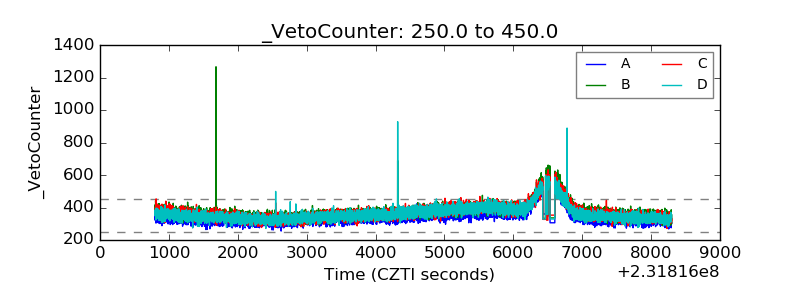 |