| Param | Original file | Final file |
|---|---|---|
| Filename | modeM0/AS1G07_024T01_9000001206_08690cztM0_level2.evt | modeM0/AS1G07_024T01_9000001206_08690cztM0_level2_quad_clean.evt |
| Size (bytes) | 476,478,720 | 131,561,280 |
| Size | 454.4 MB | 125.5 MB |
| Events in quadrant A | 3,305,994 | 860,950 |
| Events in quadrant B | 3,756,165 | 885,924 |
| Events in quadrant C | 3,250,605 | 877,922 |
| Events in quadrant D | 3,606,109 | 836,660 |
| Mode M0 | |||
|---|---|---|---|
| Quadrant | BADHDUFLAG | Total packets | Discarded packets |
| A | 0 | 15283 | 2 |
| B | 0 | 16320 | 1 |
| C | 0 | 15245 | 1 |
| D | 0 | 16372 | 1 |
| Mode M9 | |||
|---|---|---|---|
| Quadrant | BADHDUFLAG | Total packets | Discarded packets |
| A | 0 | 3 | 0 |
| B | 0 | 3 | 0 |
| C | 0 | 3 | 0 |
| D | 0 | 3 | 0 |
| Mode SS | |||
|---|---|---|---|
| Quadrant | BADHDUFLAG | Total packets | Discarded packets |
| A | 0 | 152 | 0 |
| B | 0 | 152 | 0 |
| C | 0 | 152 | 0 |
| D | 0 | 152 | 0 |
| Quadrant | Total seconds | Saturated seconds | Saturation percentage |
|---|---|---|---|
| A | 7521 | 104 | 1.382795% |
| B | 7521 | 170 | 2.260338% |
| C | 7521 | 61 | 0.811062% |
| D | 7521 | 109 | 1.449275% |
Noise dominated data is calculated using 1-second bins in cleaned event files. If a bin has >2000 counts, and if more than 50% of those come from <1% of pixels, then it is considered to be noise-dominated and hence unusable.
| Quadrant | # 1 sec bins | Bins with >0 counts | Bins with >2000 counts | High rate bins dominated by noise | Noise dominated (total time) | Noise dominated (detector-on time) | Marked lightcurve |
|---|---|---|---|---|---|---|---|
| A | 7821 | 7521 | 2 | 2 | 0.03% | 0.03% | 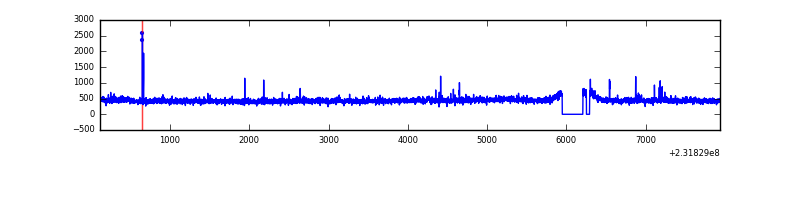 |
| B | 7821 | 7522 | 46 | 46 | 0.59% | 0.61% | 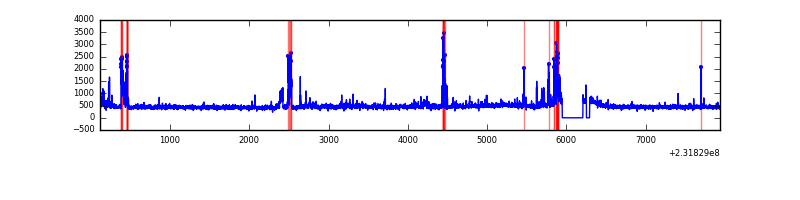 |
| C | 7821 | 7522 | 0 | 0 | 0.00% | 0.00% | 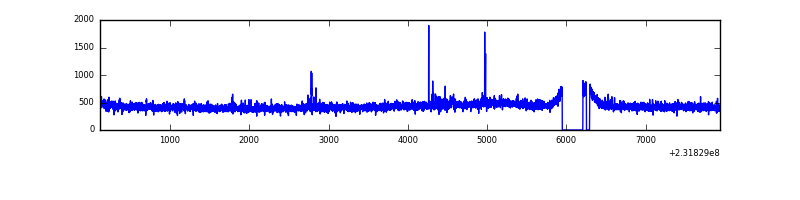 |
| D | 7821 | 7522 | 43 | 43 | 0.55% | 0.57% | 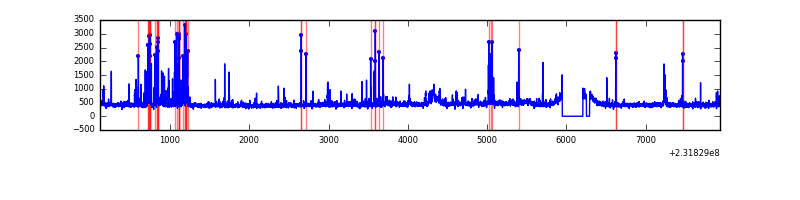 |
Top three noisy pixels from each quadrant. If the there are fewer than three noisy pixels in the level2.evt file, extra rows are filled as -1
| Pixel properties | Quadrant properties | ||||||
|---|---|---|---|---|---|---|---|
| Quadrant | DetID | PixID | Counts | Sigma | Mean | Median | Sigma |
| A | 5 | 16 | 21041 | 115.22 | 842 | 822 | 175.5 |
| A | 15 | 236 | 17817 | 96.85 | 842 | 822 | 175.5 |
| A | 15 | 174 | 16337 | 88.41 | 842 | 822 | 175.5 |
| B | 10 | 16 | 281904 | 1718.36 | 849 | 827 | 163.6 |
| B | 0 | 219 | 62691 | 378.2 | 849 | 827 | 163.6 |
| B | 4 | 80 | 41185 | 246.73 | 849 | 827 | 163.6 |
| C | 4 | 254 | 29435 | 149.98 | 822 | 824 | 190.8 |
| C | 13 | 61 | 6252 | 28.45 | 822 | 824 | 190.8 |
| C | 8 | 222 | 5396 | 23.97 | 822 | 824 | 190.8 |
| D | 12 | 233 | 259486 | 1290.29 | 816 | 789 | 200.5 |
| D | 2 | 152 | 82629 | 408.19 | 816 | 789 | 200.5 |
| D | 7 | 71 | 63843 | 314.49 | 816 | 789 | 200.5 |
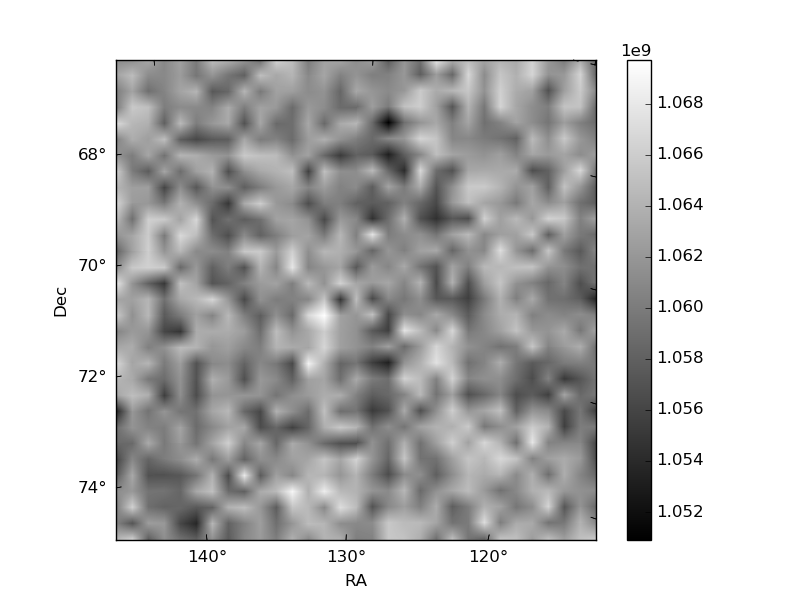
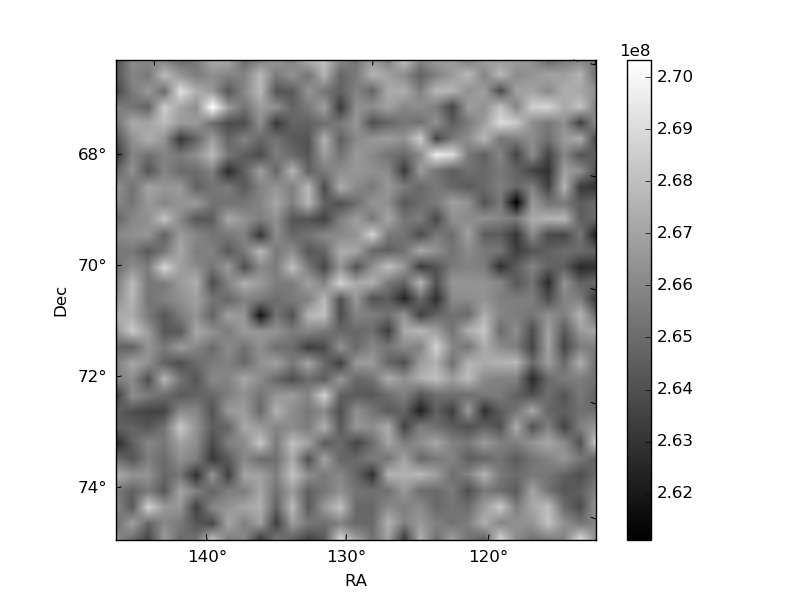
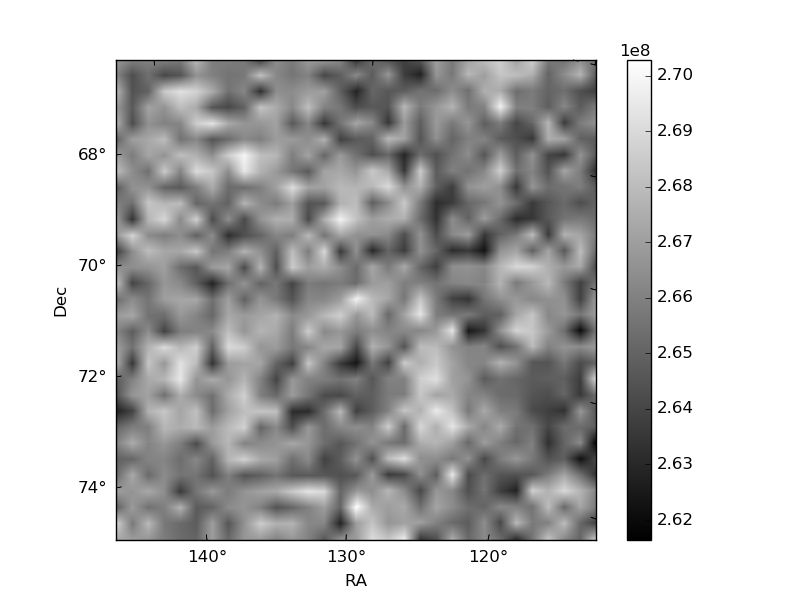
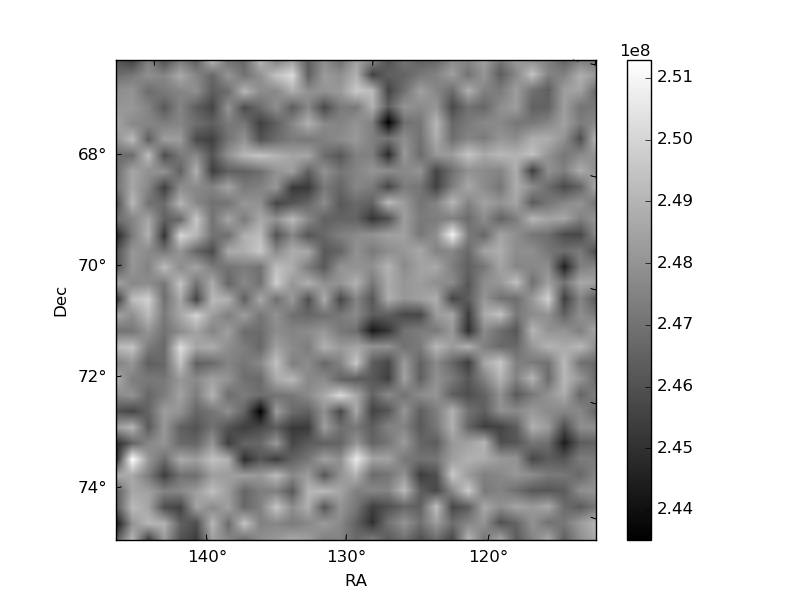
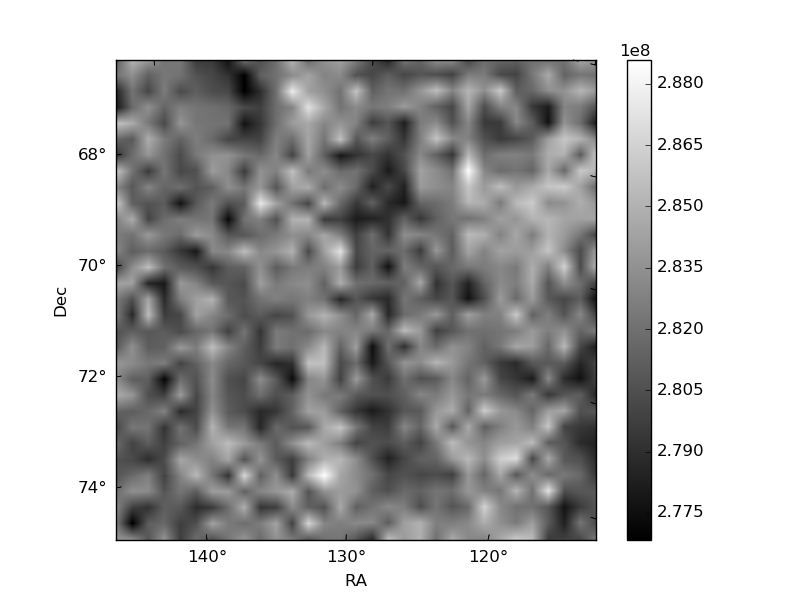
Histogram calculated using DETX and DETY for each event in the final _common_clean file
| Quadrant A | 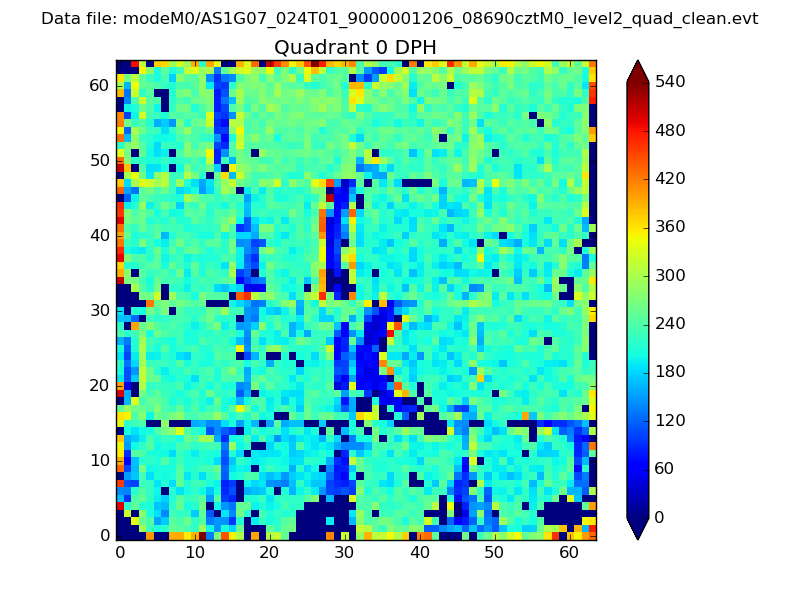 |
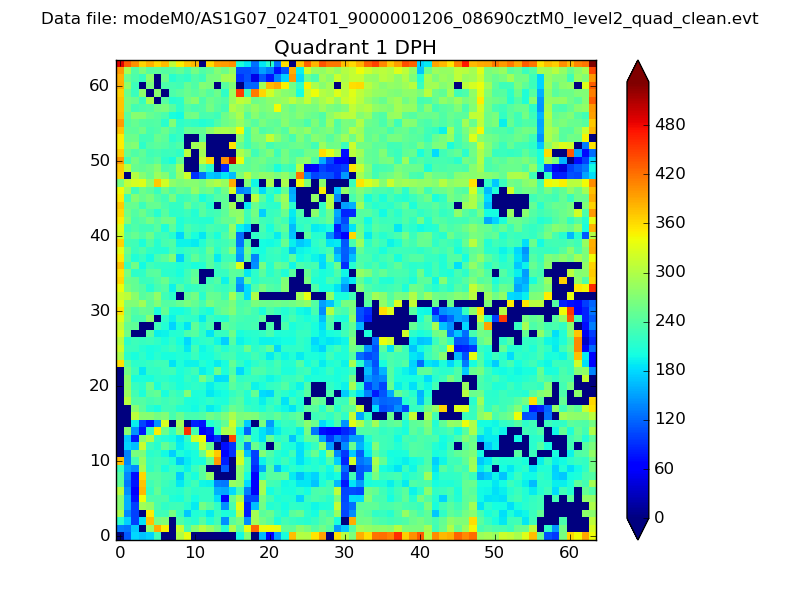 |
Quadrant B |
|---|---|---|---|
| Quadrant D | 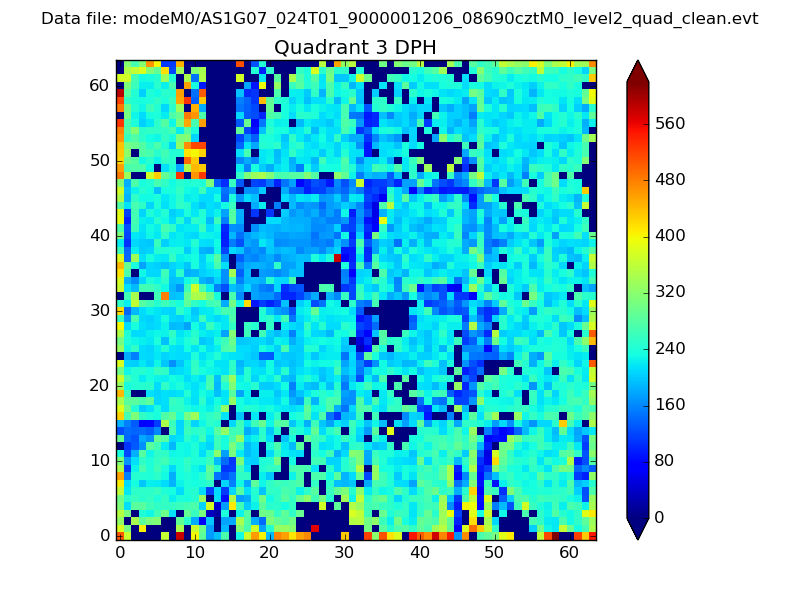 |
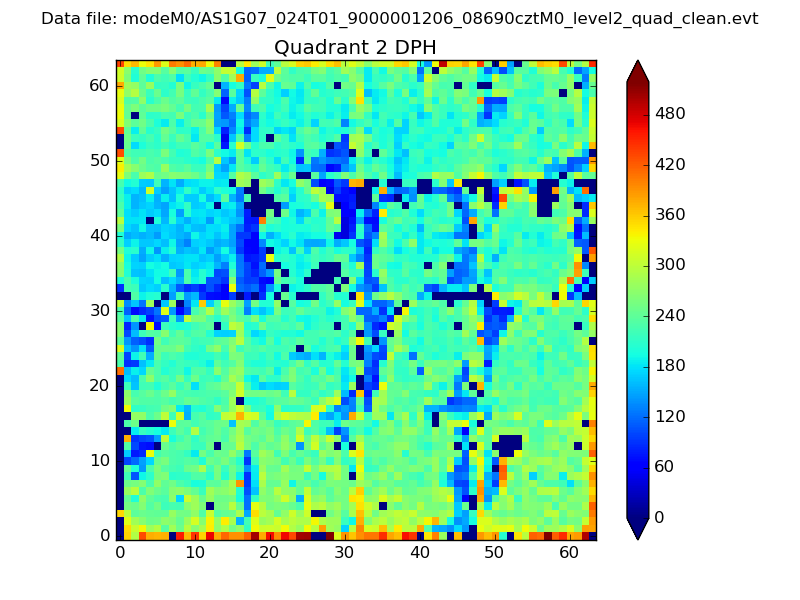 |
Quadrant C |
| Plot type | Count rate plots | Images |
|---|---|---|
| Comparison with Poisson distribution Blue bars denote a histogram of data divided into 1 sec bins. Red curve is a Poisson curve with rate = median count rate of data. |
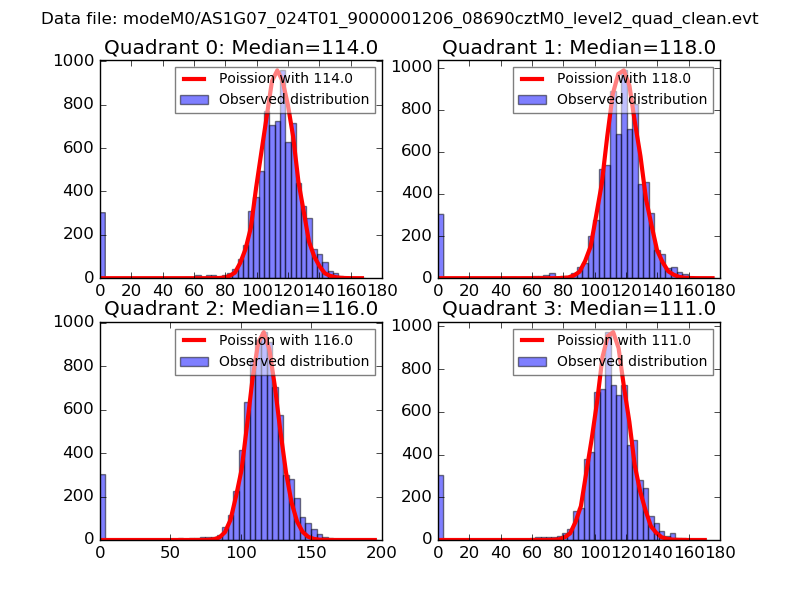 |
 |
| Quadrant-wise count rates Data is divided into 100 sec bins |
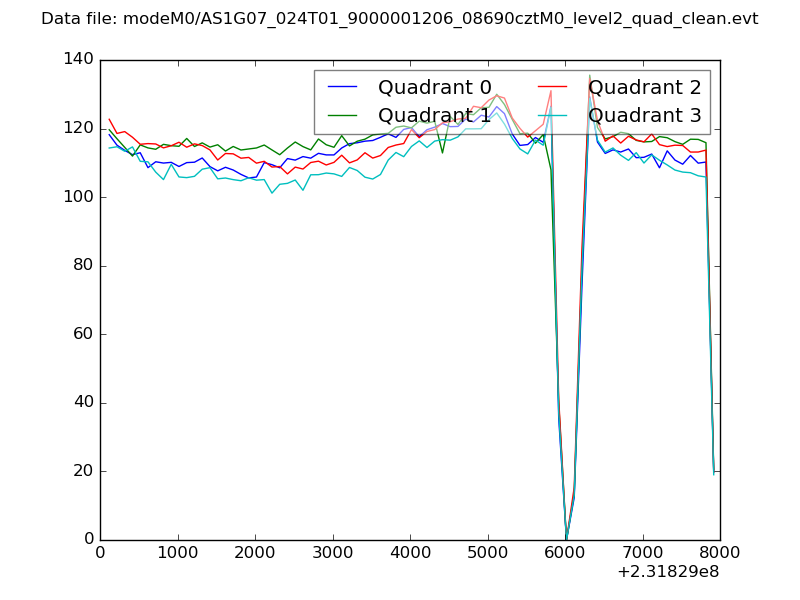 |
|
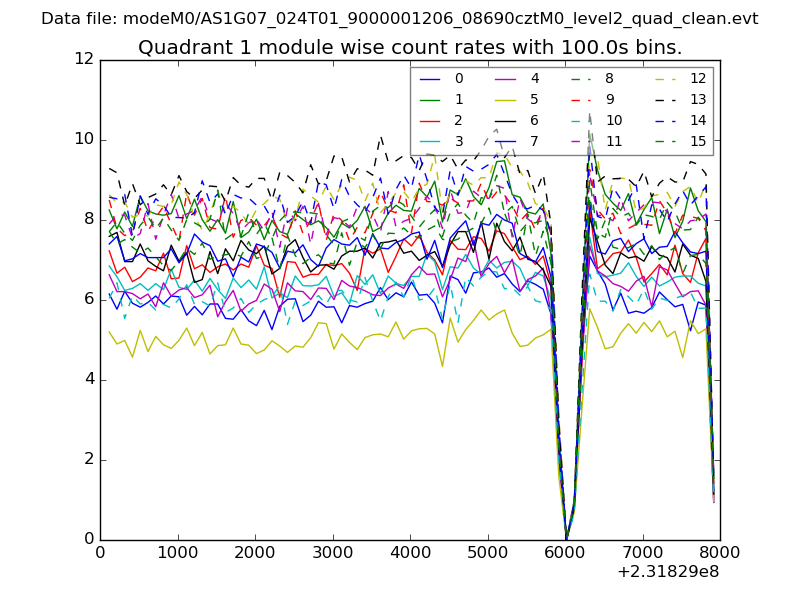
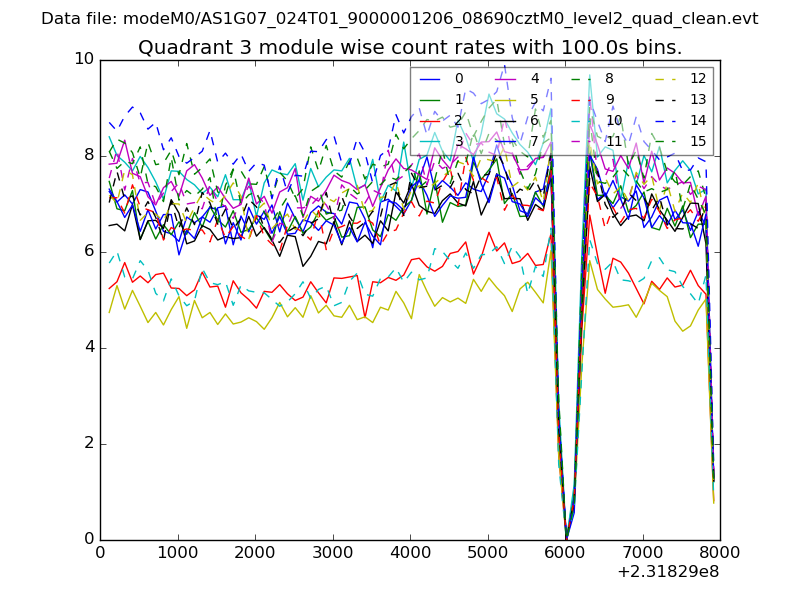
| Module-wise count rates for Quadrant A Data is divided into 100 sec bins |
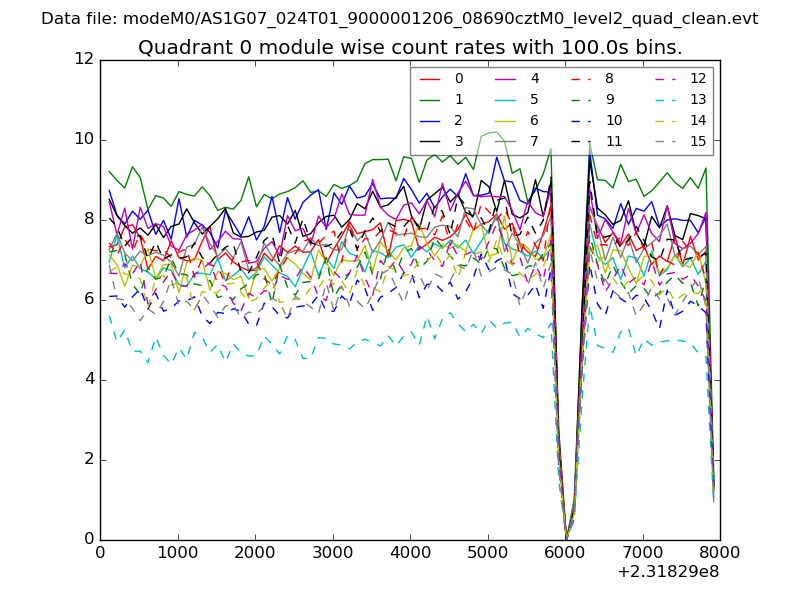 |
 |
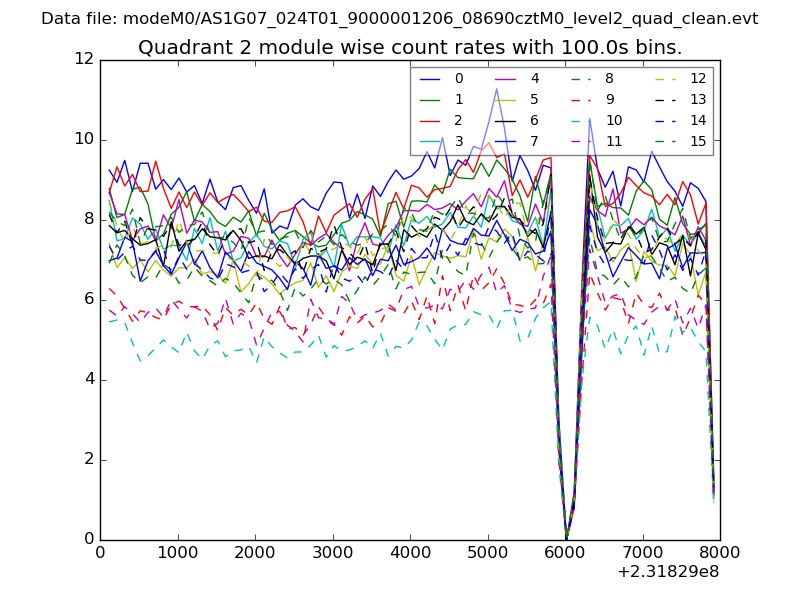
| Module-wise count rates for Quadrant B Data is divided into 100 sec bins |
 |
 |
| Module-wise count rates for Quadrant C Data is divided into 100 sec bins |
 |
 |
| Module-wise count rates for Quadrant D Data is divided into 100 sec bins |
 |
 |
| Parameter | Plot |
|---|---|
| CZT HV Monitor | 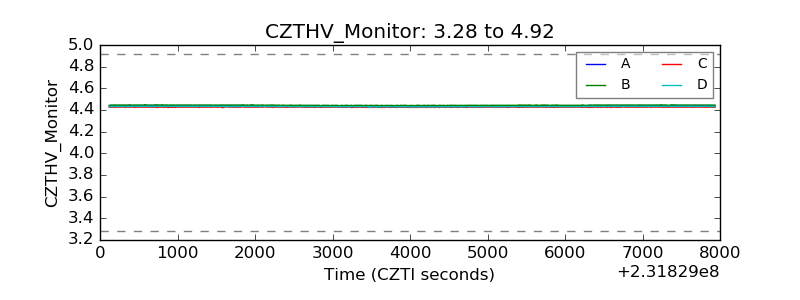 |
| D_VDD | 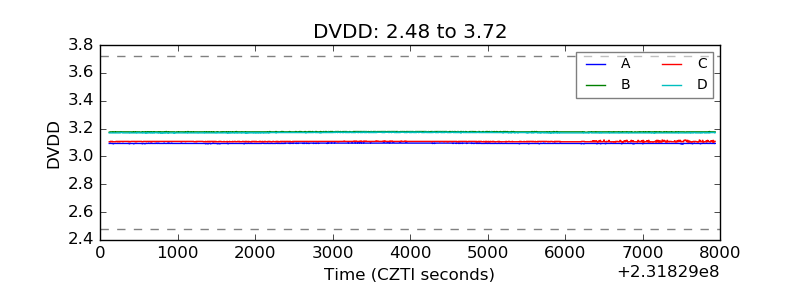 |
| Temperature 1 | 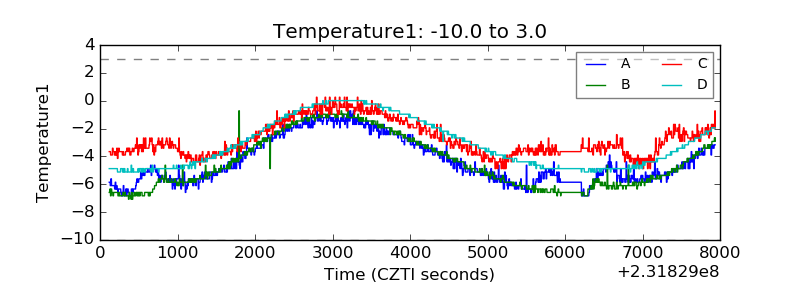 |
| Veto HV Monitor | 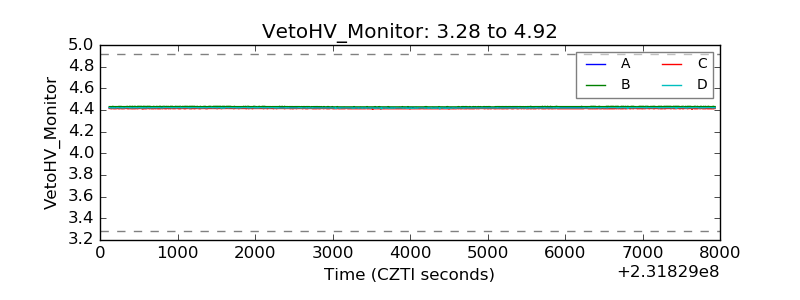 |
| Veto LLD | 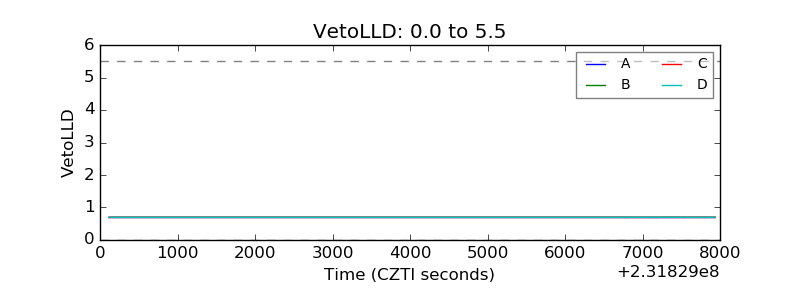 |
| Alpha Counter | 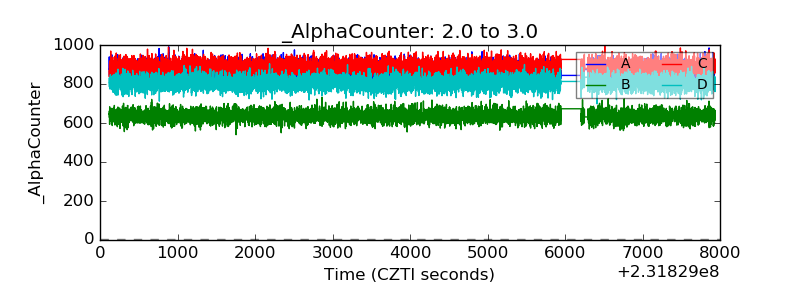 |
| _CPM_Rate | 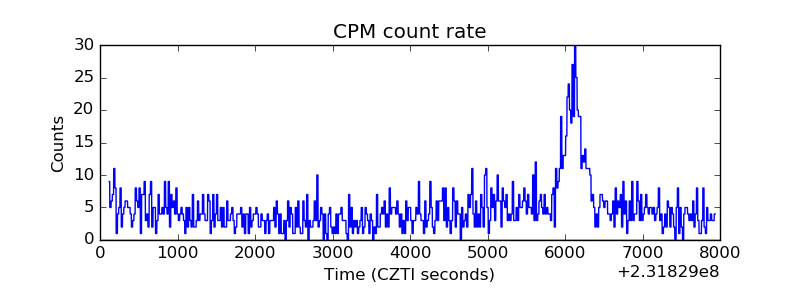 |
| CZT Counter | 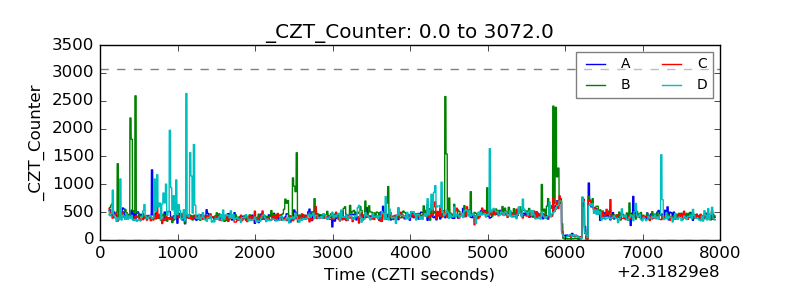 |
| +2.5 Volts monitor |  |
| +5 Volts monitor |  |
| _ROLL_ROT | 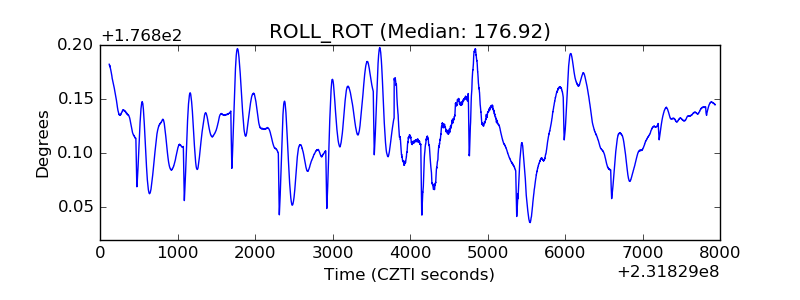 |
| _Roll_DEC | 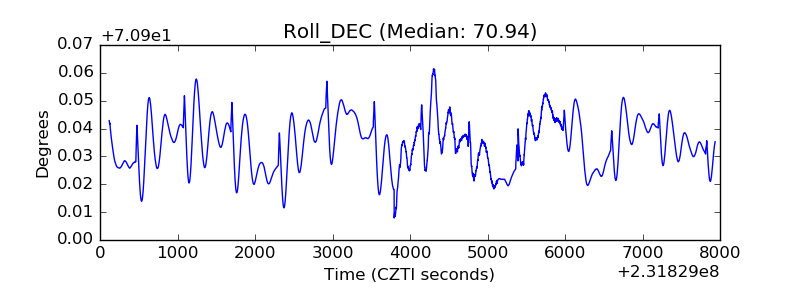 |
| _Roll_RA | 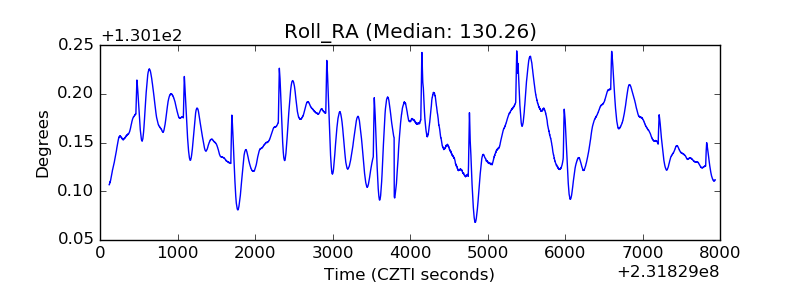 |
| Veto Counter | 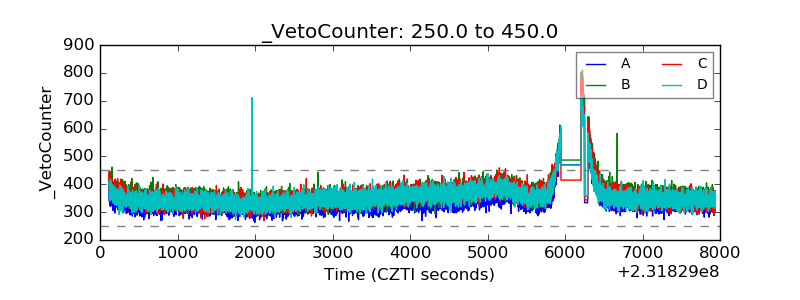 |