| Param | Original file | Final file |
|---|---|---|
| Filename | modeM0/AS1G07_024T01_9000001206_08692cztM0_level2.evt | modeM0/AS1G07_024T01_9000001206_08692cztM0_level2_quad_clean.evt |
| Size (bytes) | 802,212,480 | 215,447,040 |
| Size | 765.0 MB | 205.5 MB |
| Events in quadrant A | 5,510,423 | 1,423,002 |
| Events in quadrant B | 6,292,562 | 1,453,667 |
| Events in quadrant C | 5,336,987 | 1,433,386 |
| Events in quadrant D | 6,319,119 | 1,363,088 |
| Mode M0 | |||
|---|---|---|---|
| Quadrant | BADHDUFLAG | Total packets | Discarded packets |
| A | 0 | 25197 | 11 |
| B | 0 | 26966 | 16 |
| C | 0 | 24936 | 10 |
| D | 0 | 27919 | 20 |
| Mode M9 | |||
|---|---|---|---|
| Quadrant | BADHDUFLAG | Total packets | Discarded packets |
| A | 0 | 13 | 0 |
| B | 0 | 13 | 0 |
| C | 0 | 13 | 1 |
| D | 0 | 13 | 0 |
| Mode SS | |||
|---|---|---|---|
| Quadrant | BADHDUFLAG | Total packets | Discarded packets |
| A | 0 | 250 | 0 |
| B | 0 | 250 | 0 |
| C | 0 | 250 | 0 |
| D | 0 | 250 | 0 |
| Quadrant | Total seconds | Saturated seconds | Saturation percentage |
|---|---|---|---|
| A | 12338 | 91 | 0.737559% |
| B | 12335 | 178 | 1.443048% |
| C | 12338 | 27 | 0.218836% |
| D | 12333 | 249 | 2.018973% |
Noise dominated data is calculated using 1-second bins in cleaned event files. If a bin has >2000 counts, and if more than 50% of those come from <1% of pixels, then it is considered to be noise-dominated and hence unusable.
| Quadrant | # 1 sec bins | Bins with >0 counts | Bins with >2000 counts | High rate bins dominated by noise | Noise dominated (total time) | Noise dominated (detector-on time) | Marked lightcurve |
|---|---|---|---|---|---|---|---|
| A | 13592 | 12342 | 5 | 5 | 0.04% | 0.04% | 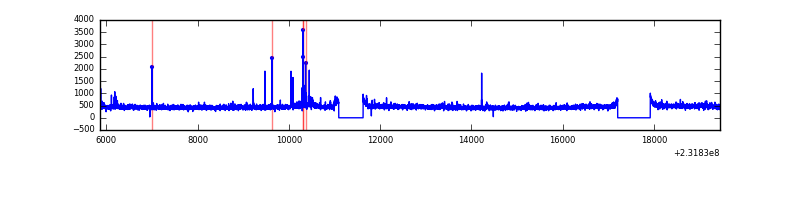 |
| B | 13592 | 12343 | 92 | 92 | 0.68% | 0.75% | 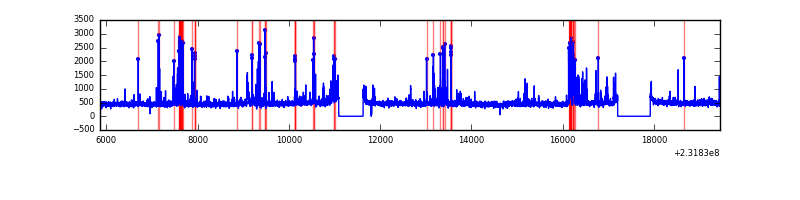 |
| C | 13592 | 12344 | 2 | 2 | 0.01% | 0.02% | 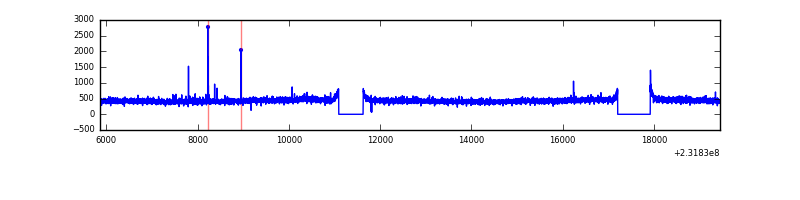 |
| D | 13592 | 12340 | 168 | 168 | 1.24% | 1.36% | 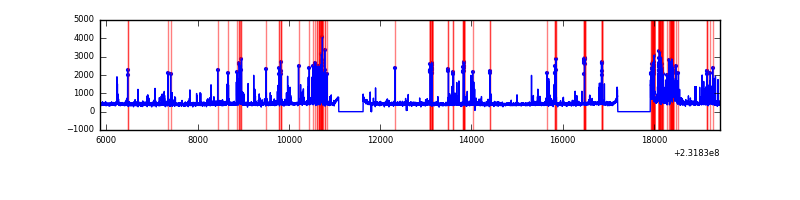 |
Top three noisy pixels from each quadrant. If the there are fewer than three noisy pixels in the level2.evt file, extra rows are filled as -1
| Pixel properties | Quadrant properties | ||||||
|---|---|---|---|---|---|---|---|
| Quadrant | DetID | PixID | Counts | Sigma | Mean | Median | Sigma |
| A | 13 | 251 | 117027 | 405.78 | 1390 | 1358 | 285.1 |
| A | 15 | 174 | 19634 | 64.11 | 1390 | 1358 | 285.1 |
| A | 5 | 16 | 15994 | 51.34 | 1390 | 1358 | 285.1 |
| B | 10 | 16 | 305390 | 1151.51 | 1399 | 1366 | 264.0 |
| B | 4 | 48 | 295586 | 1114.38 | 1399 | 1366 | 264.0 |
| B | 0 | 219 | 65672 | 243.56 | 1399 | 1366 | 264.0 |
| C | 1 | 16 | 32675 | 100.62 | 1352 | 1357 | 311.2 |
| C | 13 | 61 | 10670 | 29.92 | 1352 | 1357 | 311.2 |
| C | 8 | 128 | 8798 | 23.91 | 1352 | 1357 | 311.2 |
| D | 12 | 233 | 741486 | 2255.54 | 1345 | 1301 | 328.2 |
| D | 7 | 71 | 206984 | 626.77 | 1345 | 1301 | 328.2 |
| D | 2 | 152 | 79977 | 239.75 | 1345 | 1301 | 328.2 |
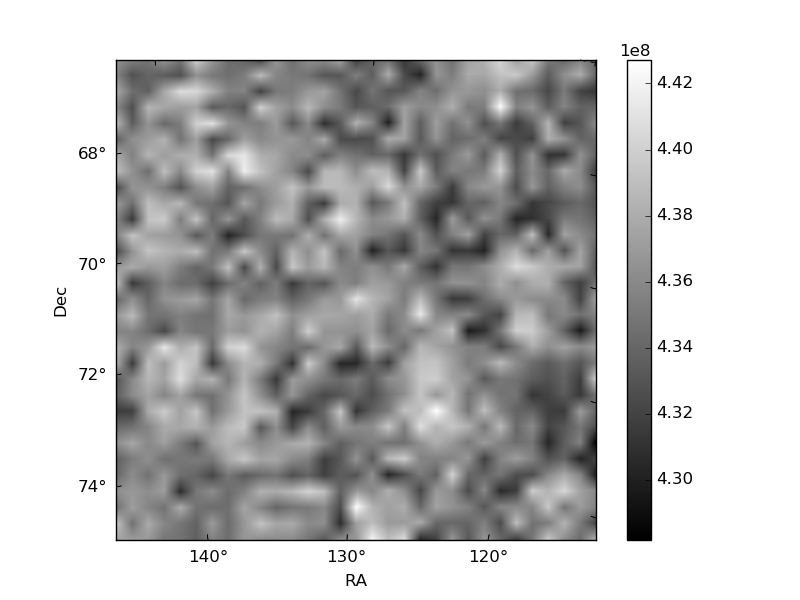
Histogram calculated using DETX and DETY for each event in the final _common_clean file
| Quadrant A | 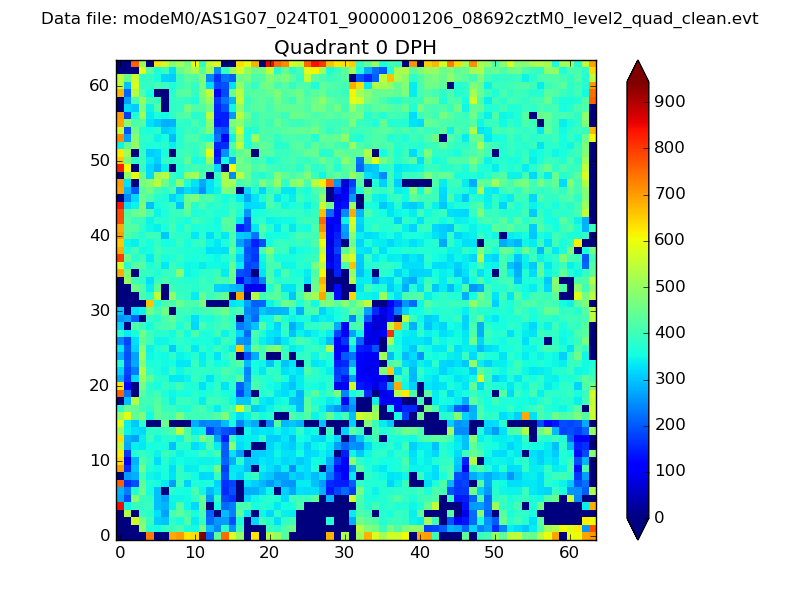 |
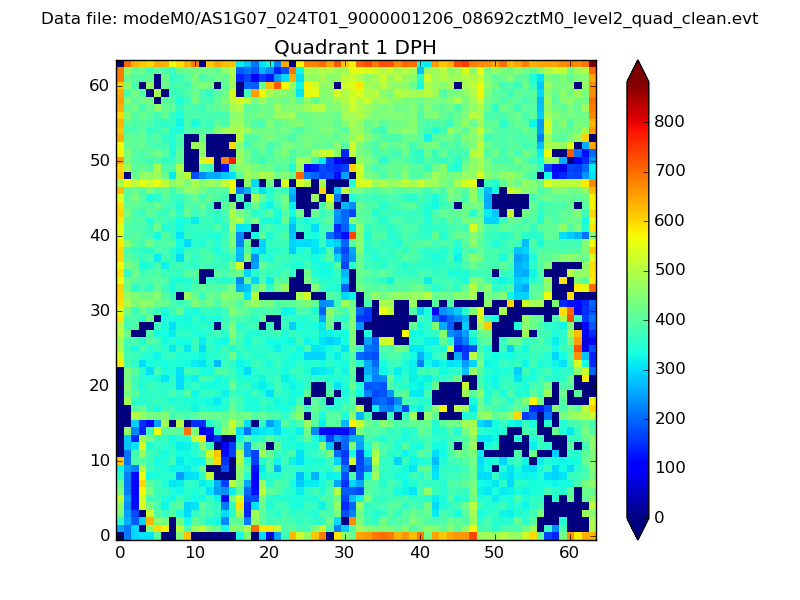 |
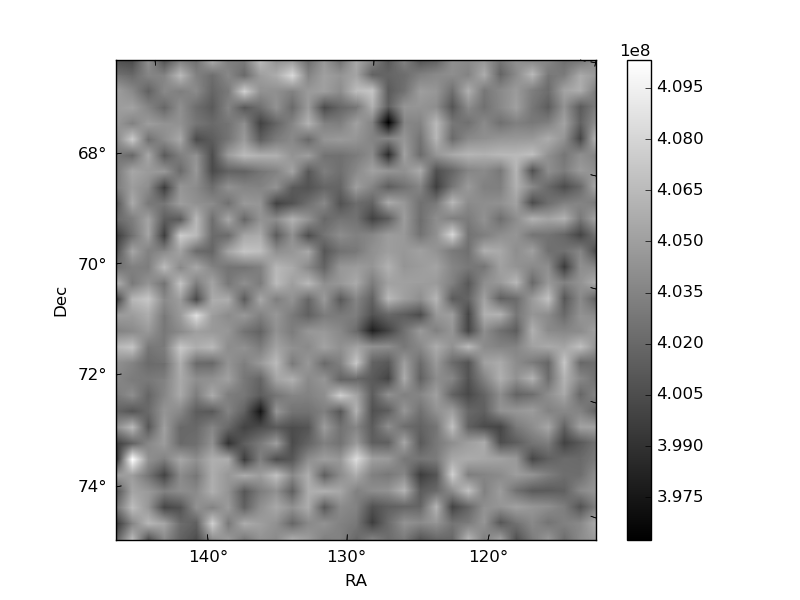
Quadrant B |
|---|---|---|---|
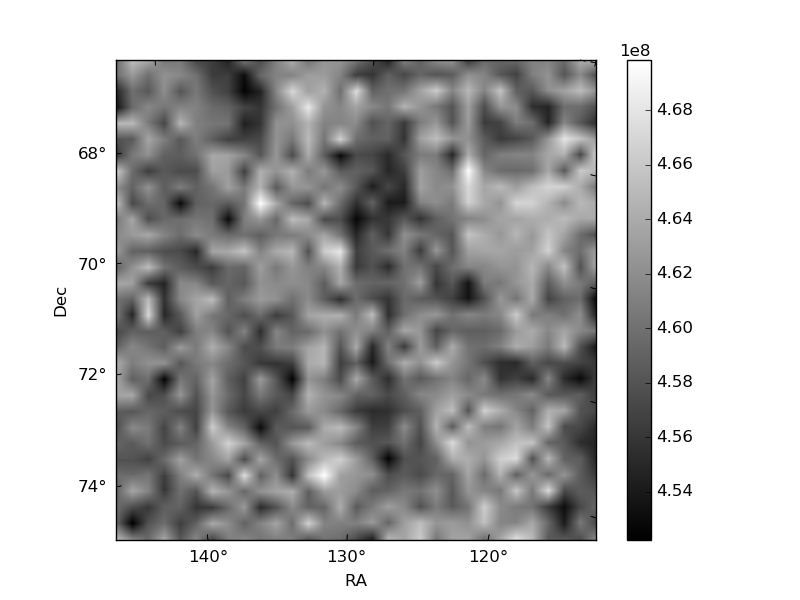
| Quadrant D | 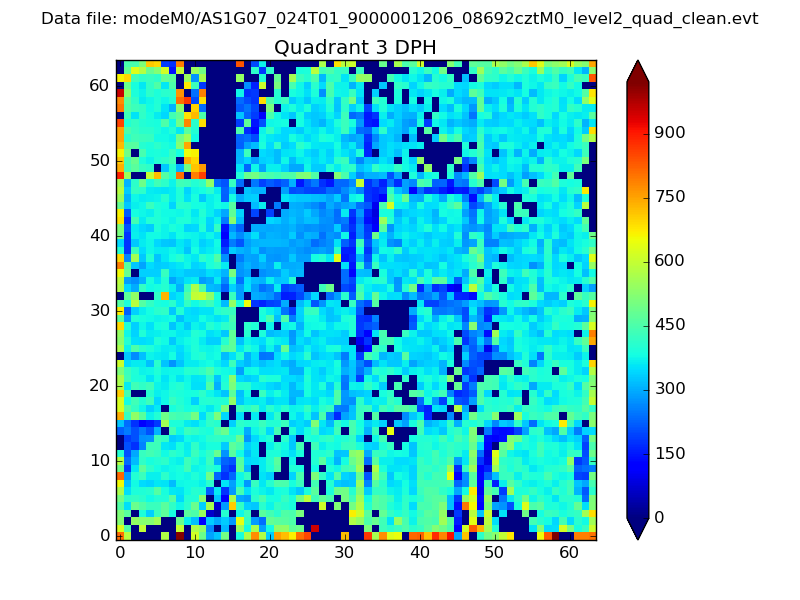 |
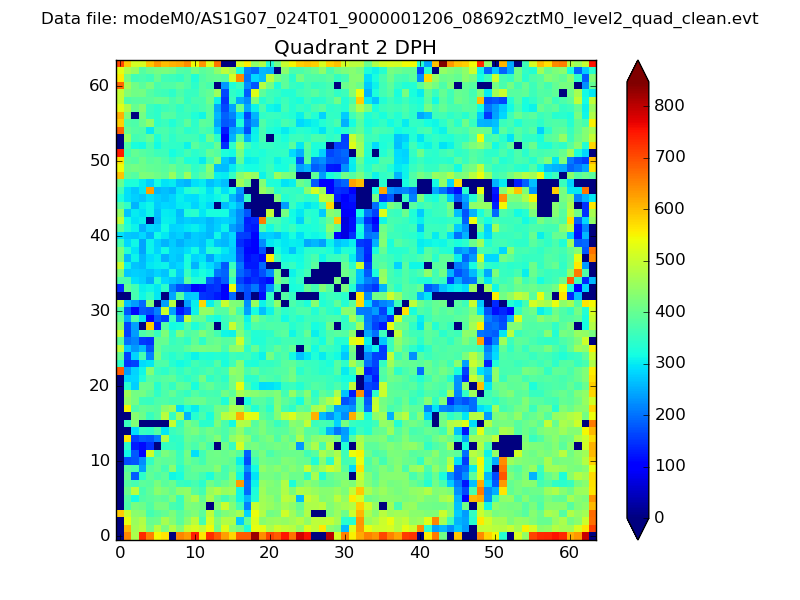 |
Quadrant C |
| Plot type | Count rate plots | Images |
|---|---|---|
| Comparison with Poisson distribution Blue bars denote a histogram of data divided into 1 sec bins. Red curve is a Poisson curve with rate = median count rate of data. |
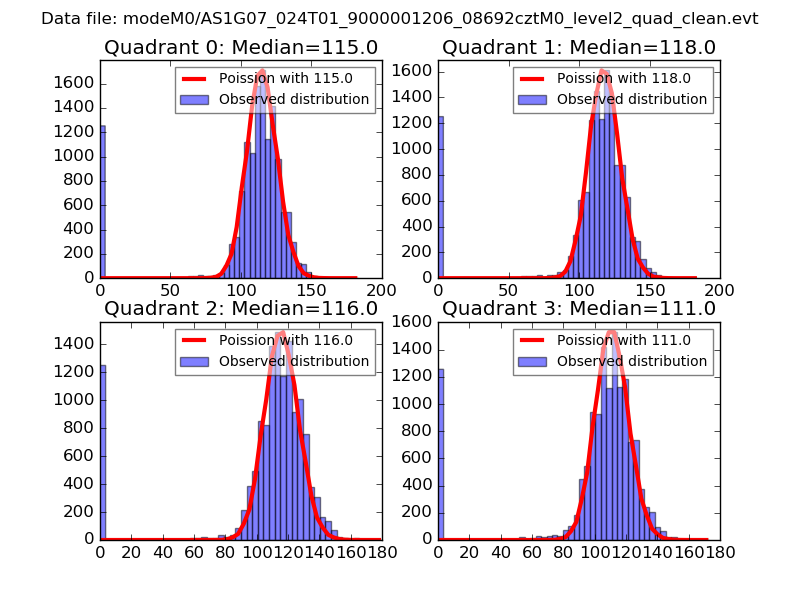 |
 |
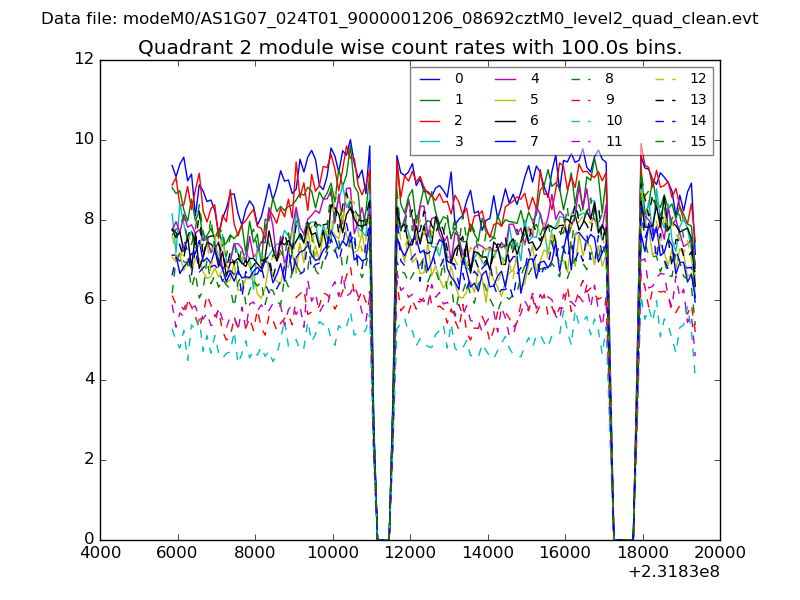
| Quadrant-wise count rates Data is divided into 100 sec bins |
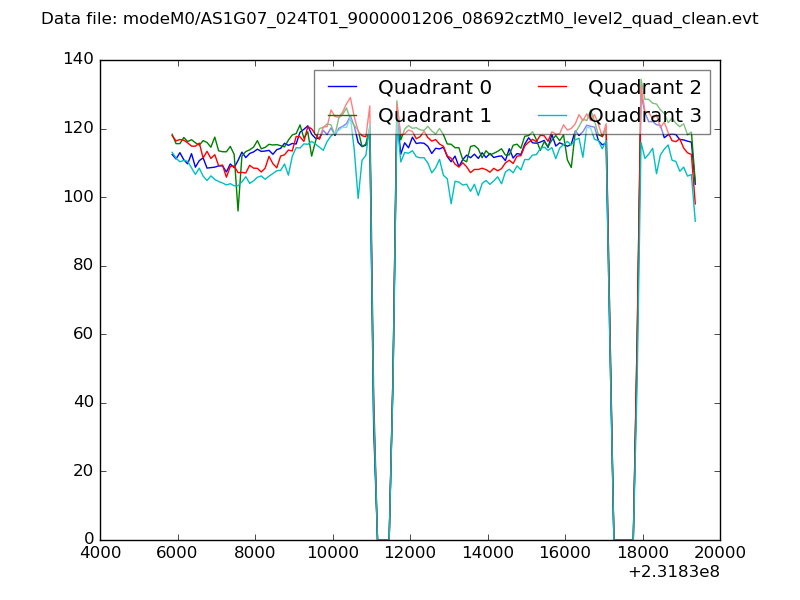 |
|
| Module-wise count rates for Quadrant A Data is divided into 100 sec bins |
 |
 |
| Module-wise count rates for Quadrant B Data is divided into 100 sec bins |
 |
 |
| Module-wise count rates for Quadrant C Data is divided into 100 sec bins |
 |
 |
| Module-wise count rates for Quadrant D Data is divided into 100 sec bins |
 |
 |
| Parameter | Plot |
|---|---|
| CZT HV Monitor | 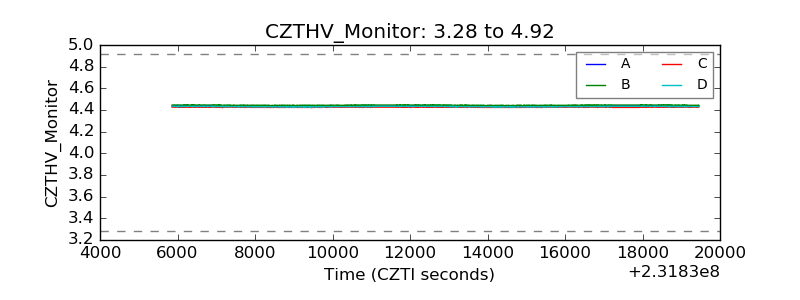 |
| D_VDD | 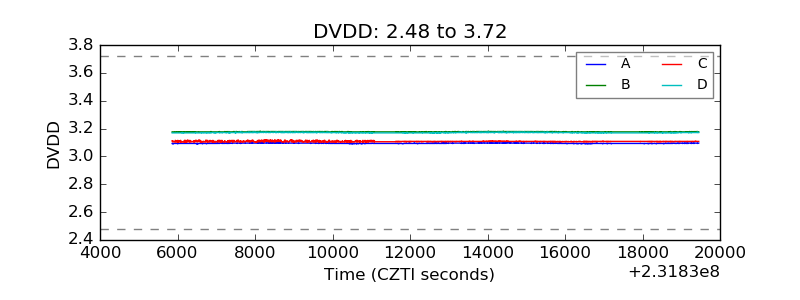 |
| Temperature 1 | 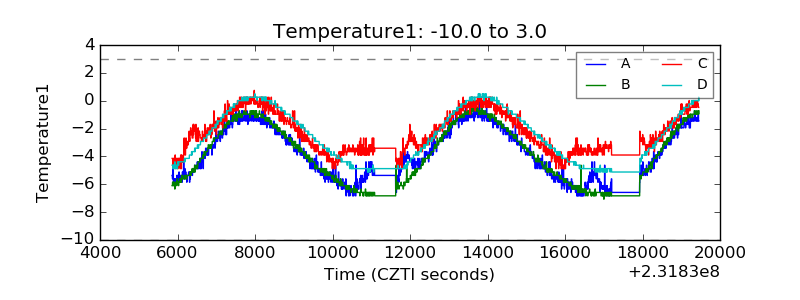 |
| Veto HV Monitor | 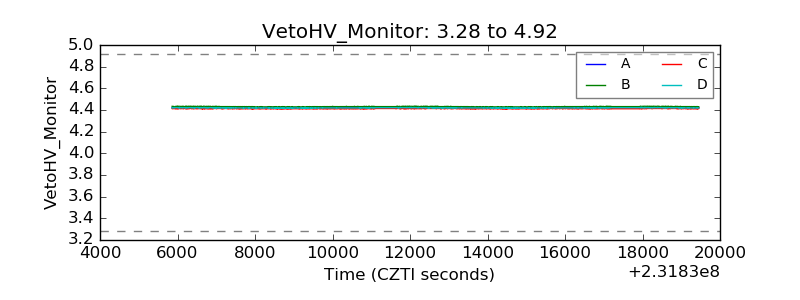 |
| Veto LLD | 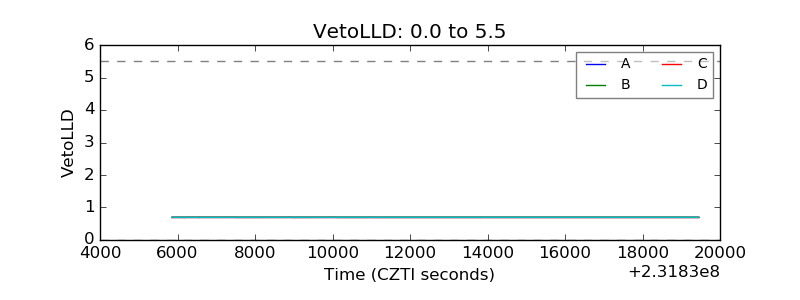 |
| Alpha Counter | 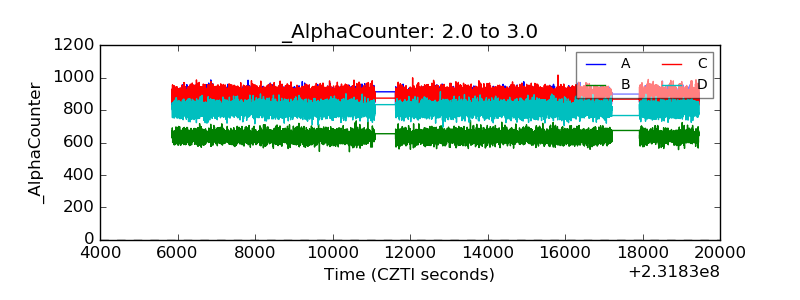 |
| _CPM_Rate | 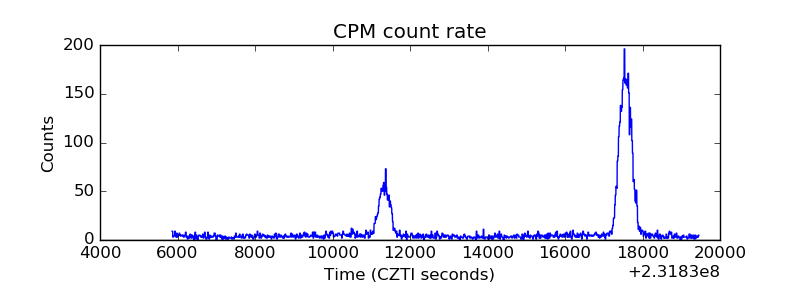 |
| CZT Counter | 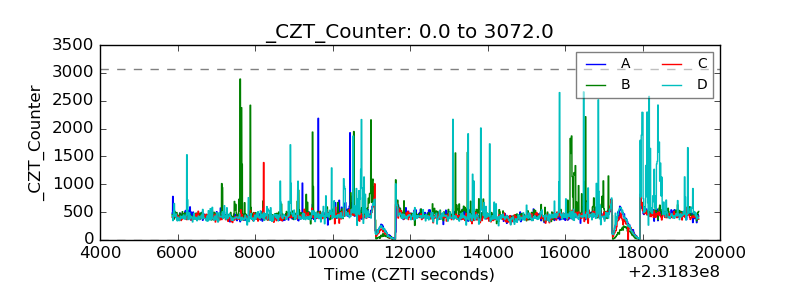 |
| +2.5 Volts monitor | 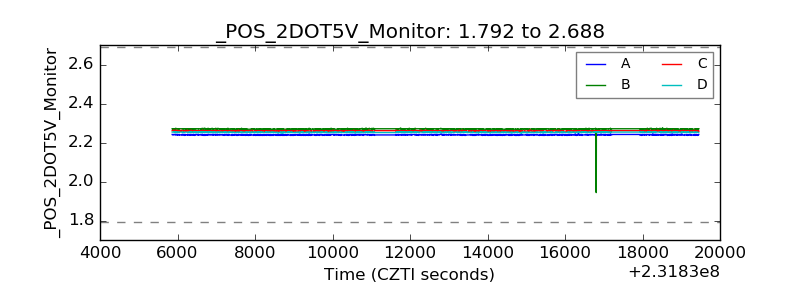 |
| +5 Volts monitor |  |
| _ROLL_ROT |  |
| _Roll_DEC | 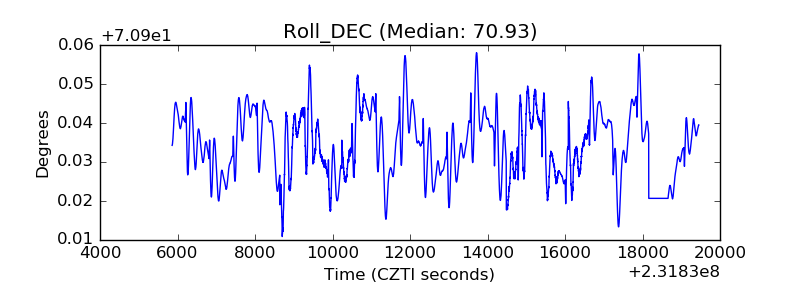 |
| _Roll_RA | 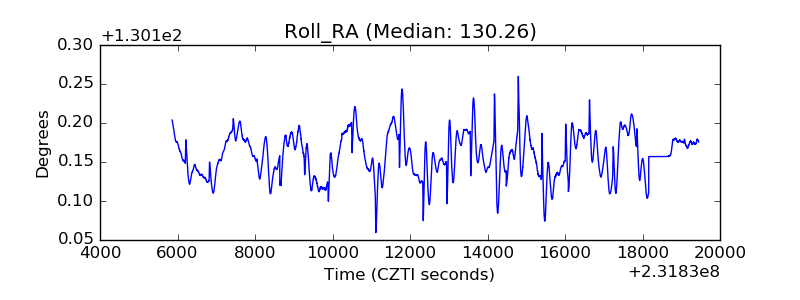 |
| Veto Counter | 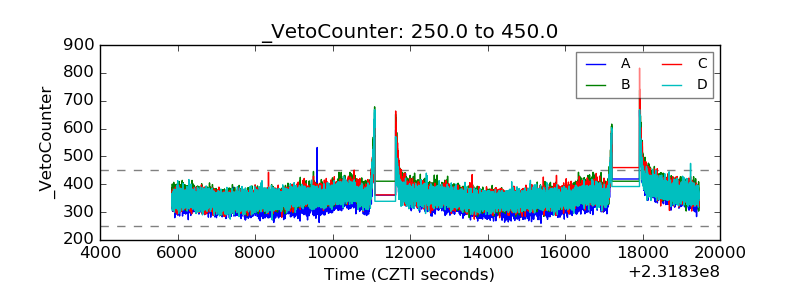 |