| Param | Original file | Final file |
|---|---|---|
| Filename | modeM0/AS1G07_024T01_9000001206_08694cztM0_level2.evt | modeM0/AS1G07_024T01_9000001206_08694cztM0_level2_quad_clean.evt |
| Size (bytes) | 84,594,240 | 24,292,800 |
| Size | 80.7 MB | 23.2 MB |
| Events in quadrant A | 600,331 | 163,332 |
| Events in quadrant B | 659,489 | 160,149 |
| Events in quadrant C | 596,490 | 156,798 |
| Events in quadrant D | 609,274 | 152,629 |
| Mode M0 | |||
|---|---|---|---|
| Quadrant | BADHDUFLAG | Total packets | Discarded packets |
| A | 0 | 4883 | 2099 |
| B | 0 | 5298 | 2477 |
| C | 0 | 4992 | 2201 |
| D | 0 | 4969 | 2148 |
| Mode SS | |||
|---|---|---|---|
| Quadrant | BADHDUFLAG | Total packets | Discarded packets |
| A | 0 | 48 | 20 |
| B | 0 | 47 | 19 |
| C | 0 | 46 | 20 |
| D | 0 | 48 | 16 |
| Quadrant | Total seconds | Saturated seconds | Saturation percentage |
|---|---|---|---|
| A | 1378 | 1 | 0.072569% |
| B | 1330 | 4 | 0.300752% |
| C | 1357 | 8 | 0.589536% |
| D | 1359 | 4 | 0.294334% |
Noise dominated data is calculated using 1-second bins in cleaned event files. If a bin has >2000 counts, and if more than 50% of those come from <1% of pixels, then it is considered to be noise-dominated and hence unusable.
| Quadrant | # 1 sec bins | Bins with >0 counts | Bins with >2000 counts | High rate bins dominated by noise | Noise dominated (total time) | Noise dominated (detector-on time) | Marked lightcurve |
|---|---|---|---|---|---|---|---|
| A | 2405 | 1730 | 0 | 0 | 0.00% | 0.00% | 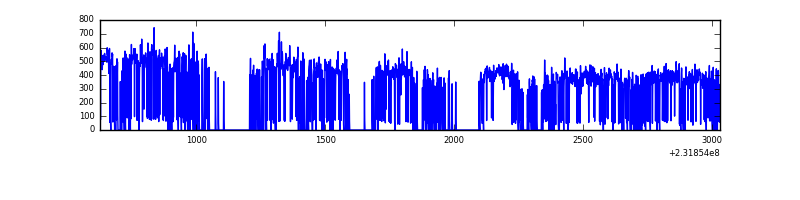 |
| B | 2403 | 1673 | 1 | 1 | 0.04% | 0.06% | 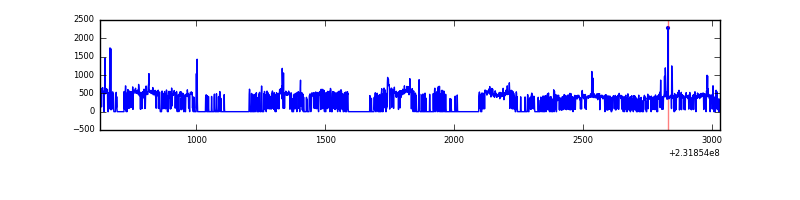 |
| C | 2405 | 1731 | 6 | 6 | 0.25% | 0.35% | 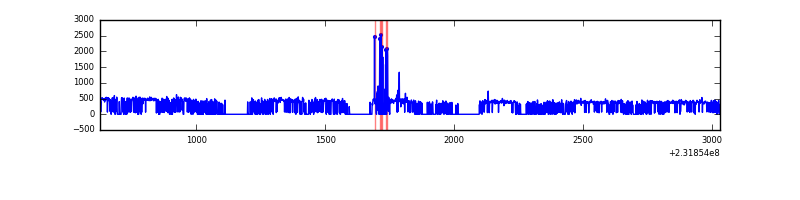 |
| D | 2404 | 1722 | 2 | 2 | 0.08% | 0.12% | 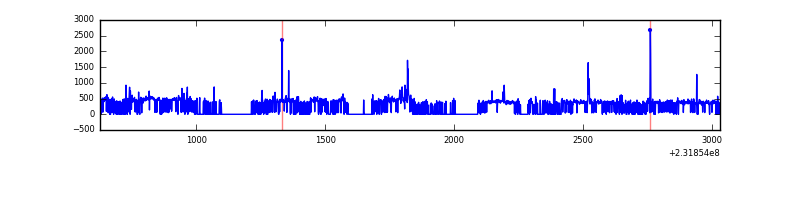 |
Top three noisy pixels from each quadrant. If the there are fewer than three noisy pixels in the level2.evt file, extra rows are filled as -1
| Pixel properties | Quadrant properties | ||||||
|---|---|---|---|---|---|---|---|
| Quadrant | DetID | PixID | Counts | Sigma | Mean | Median | Sigma |
| A | 13 | 251 | 10388 | 308.88 | 152 | 148 | 33.2 |
| A | 15 | 174 | 2169 | 60.95 | 152 | 148 | 33.2 |
| A | 0 | 226 | 1484 | 40.29 | 152 | 148 | 33.2 |
| B | 0 | 219 | 29201 | 990.43 | 146 | 143 | 29.3 |
| B | 0 | 214 | 12084 | 407.0 | 146 | 143 | 29.3 |
| B | 10 | 16 | 11658 | 392.48 | 146 | 143 | 29.3 |
| C | 14 | 234 | 28365 | 806.33 | 145 | 145 | 35.0 |
| C | 13 | 61 | 1155 | 28.86 | 145 | 145 | 35.0 |
| C | 8 | 222 | 1076 | 26.6 | 145 | 145 | 35.0 |
| D | 2 | 152 | 20670 | 548.34 | 147 | 142 | 37.4 |
| D | 2 | 14 | 13525 | 357.48 | 147 | 142 | 37.4 |
| D | 9 | 64 | 6017 | 156.93 | 147 | 142 | 37.4 |
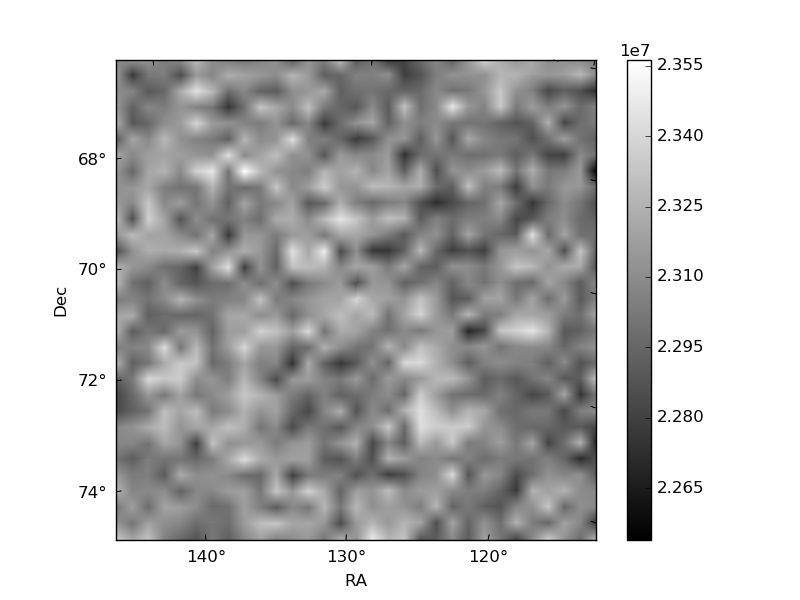
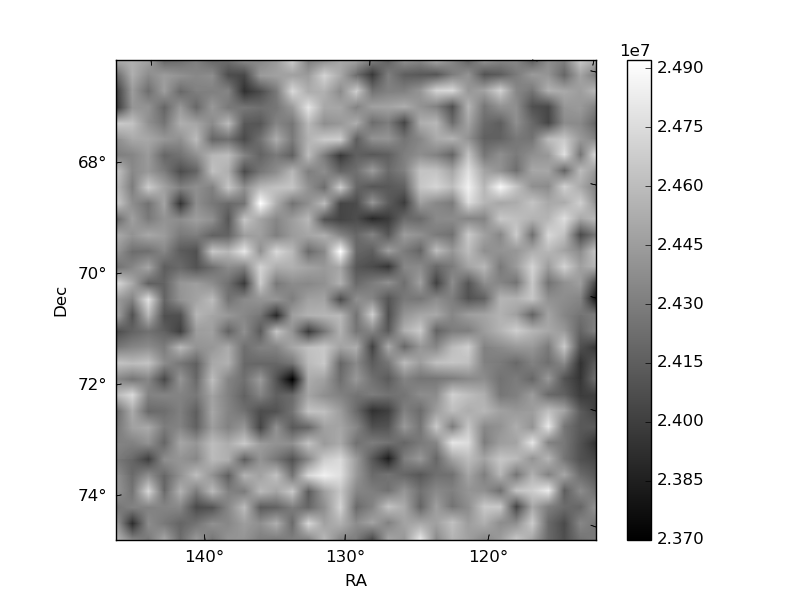
Histogram calculated using DETX and DETY for each event in the final _common_clean file
| Quadrant A | 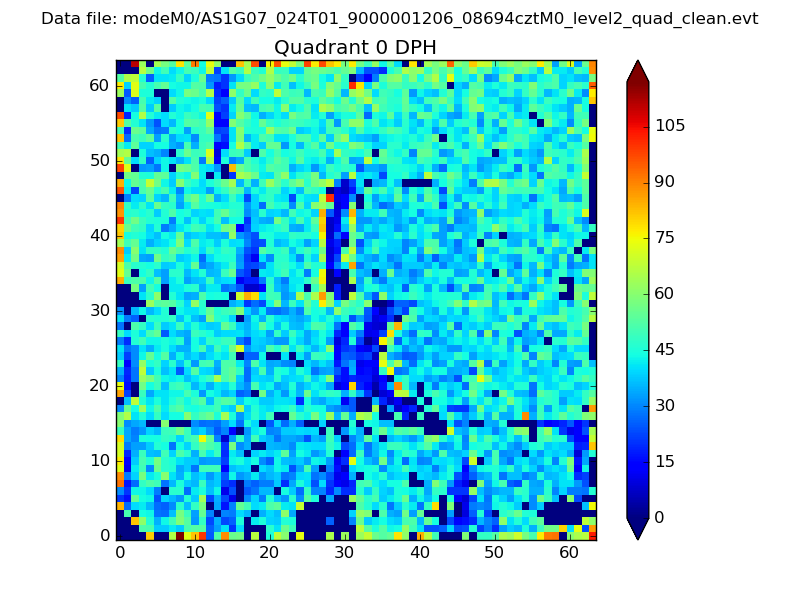 |
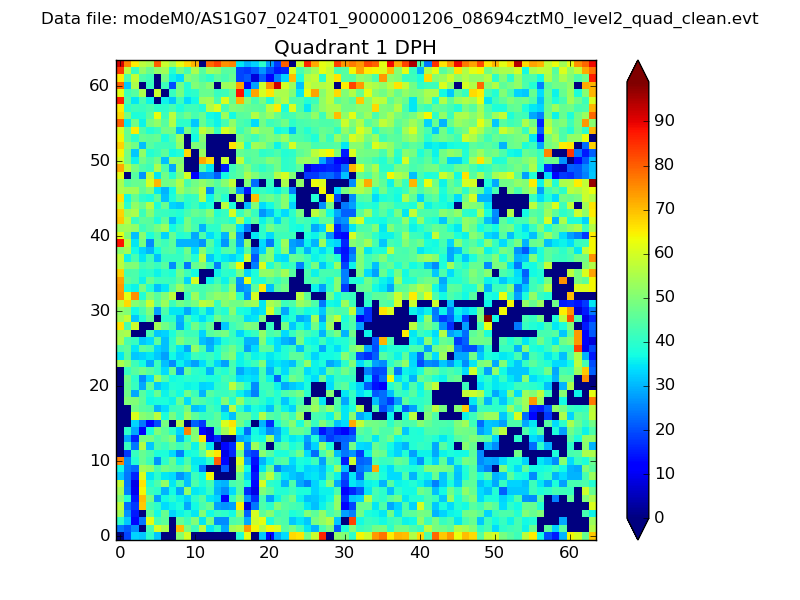 |
Quadrant B |
|---|---|---|---|
| Quadrant D | 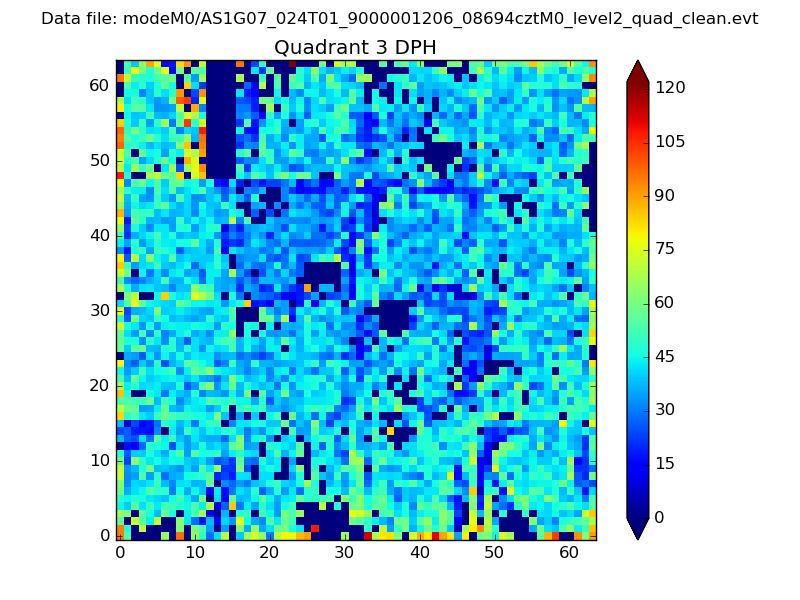 |
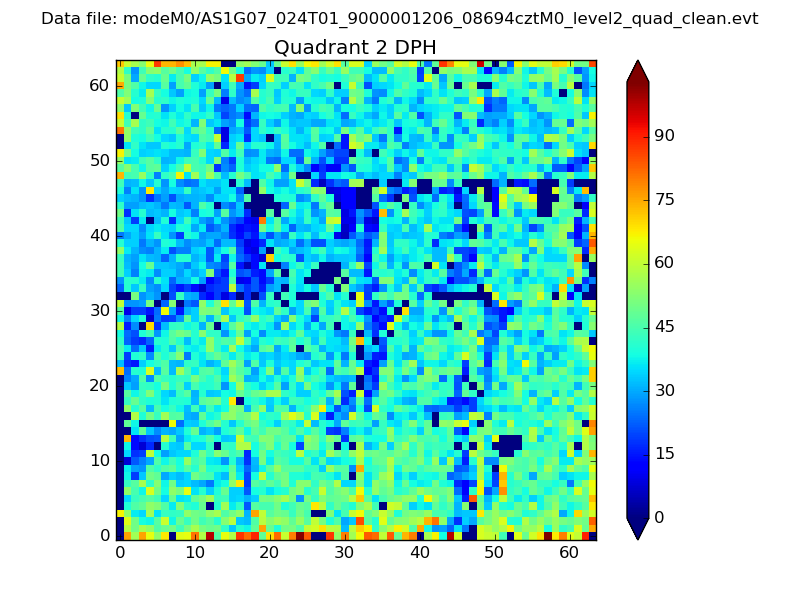 |
Quadrant C |
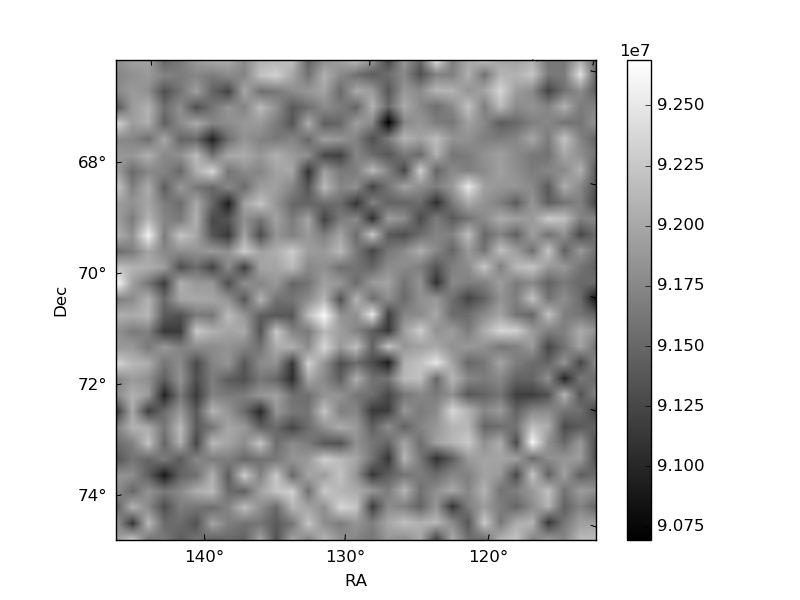
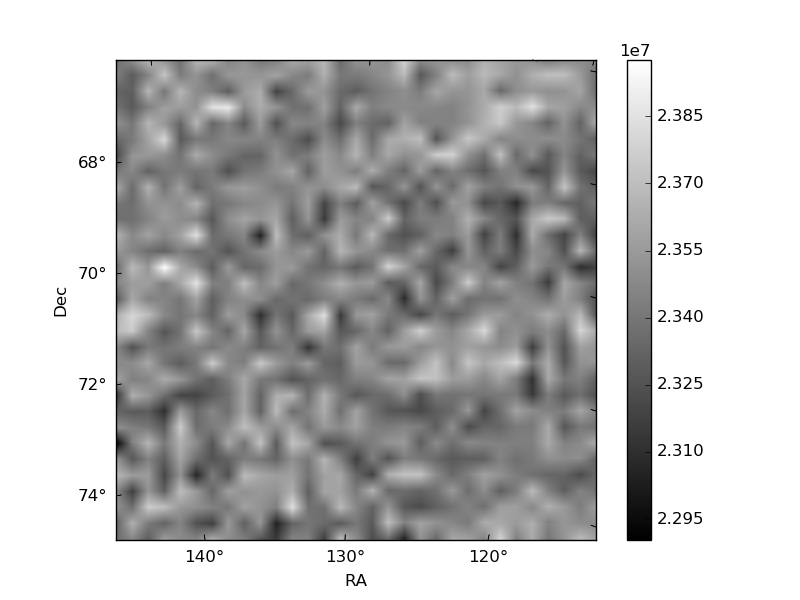
| Plot type | Count rate plots | Images |
|---|---|---|
| Comparison with Poisson distribution Blue bars denote a histogram of data divided into 1 sec bins. Red curve is a Poisson curve with rate = median count rate of data. |
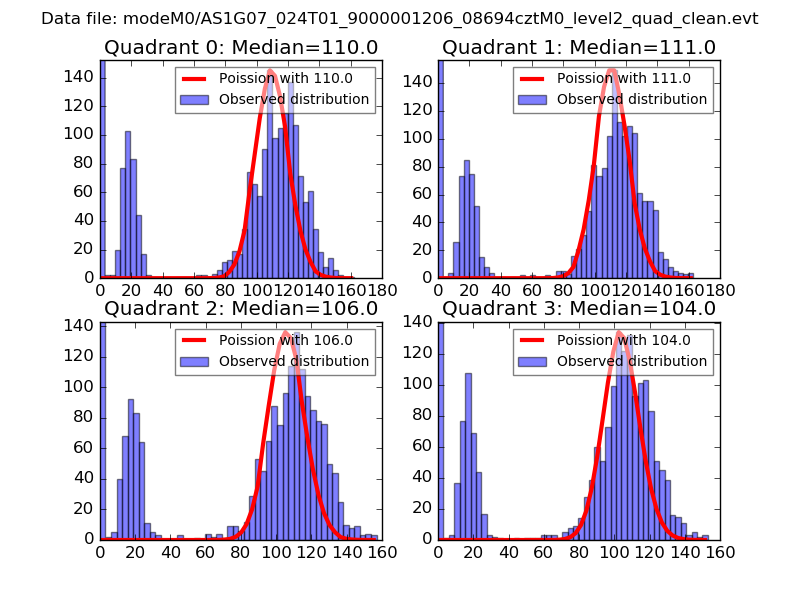 |
 |
| Quadrant-wise count rates Data is divided into 100 sec bins |
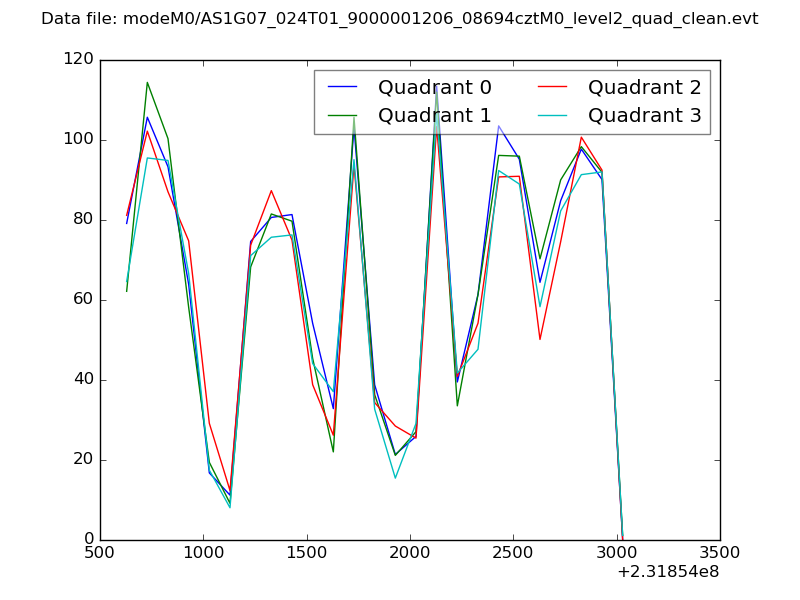 |
|
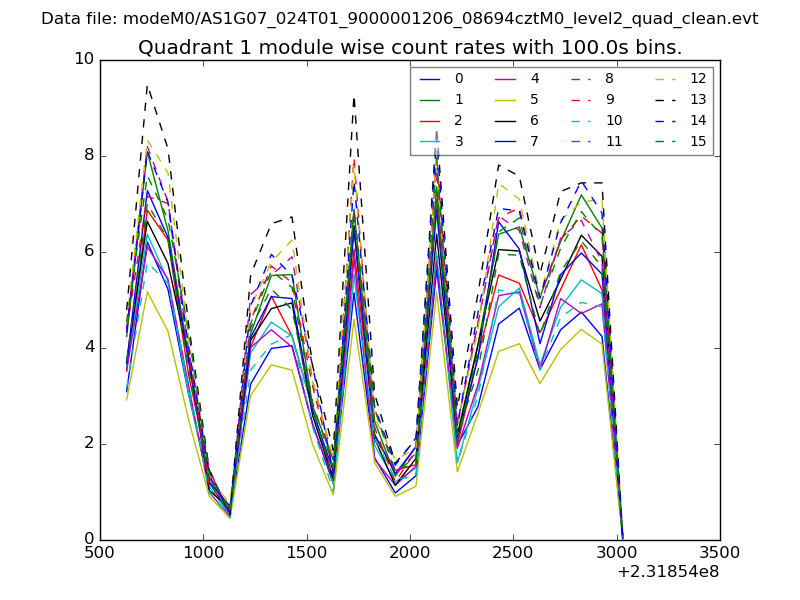
| Module-wise count rates for Quadrant A Data is divided into 100 sec bins |
 |
 |
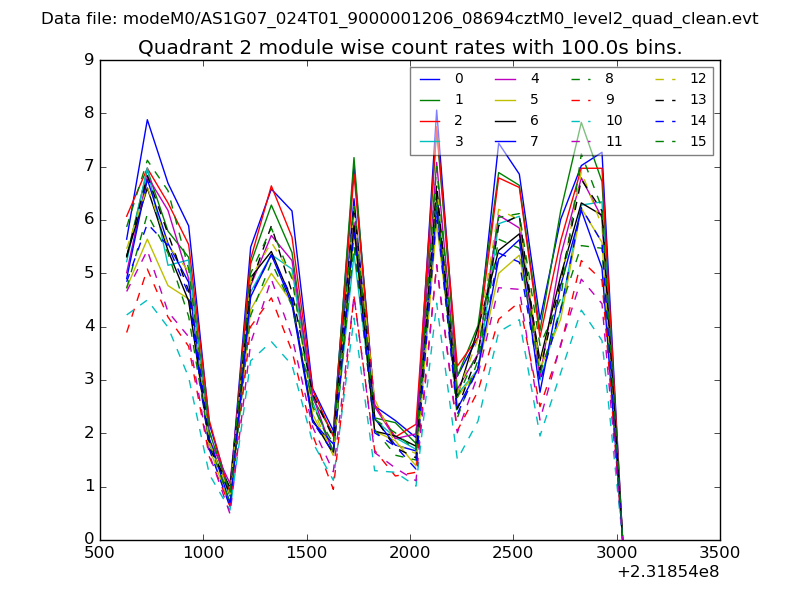
| Module-wise count rates for Quadrant B Data is divided into 100 sec bins |
 |
 |
| Module-wise count rates for Quadrant C Data is divided into 100 sec bins |
 |
 |
| Module-wise count rates for Quadrant D Data is divided into 100 sec bins |
 |
 |
| Parameter | Plot |
|---|---|
| CZT HV Monitor | 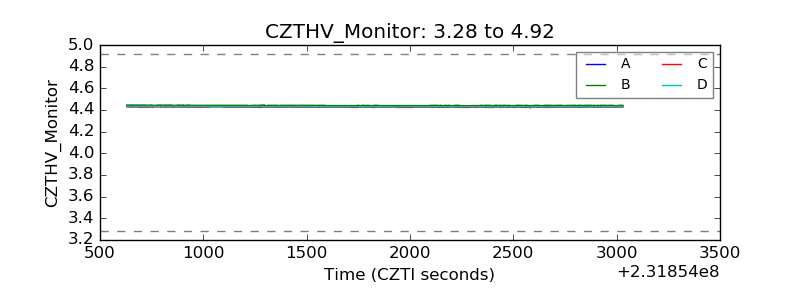 |
| D_VDD | 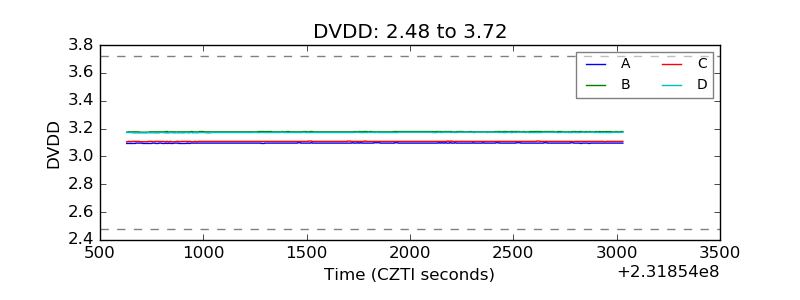 |
| Temperature 1 |  |
| Veto HV Monitor | 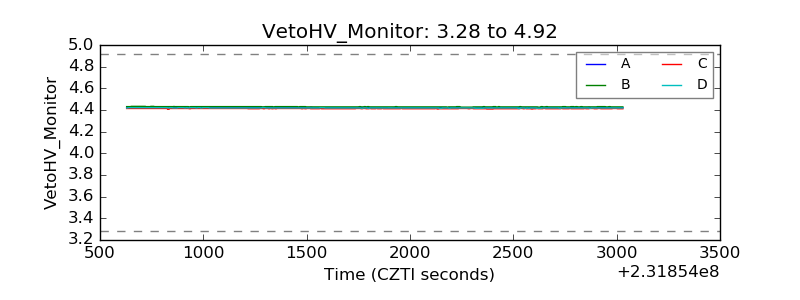 |
| Veto LLD | 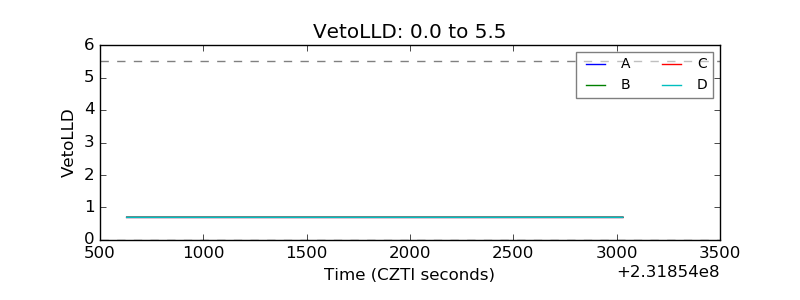 |
| Alpha Counter | 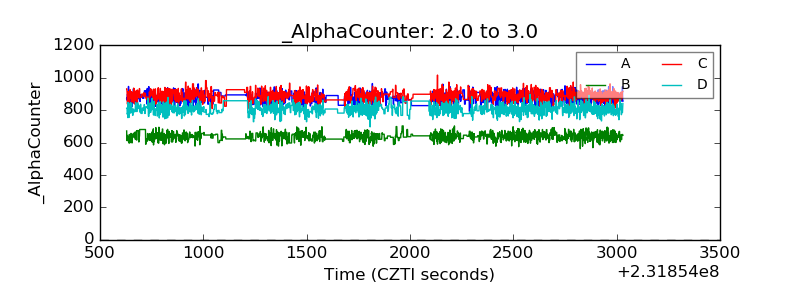 |
| _CPM_Rate | 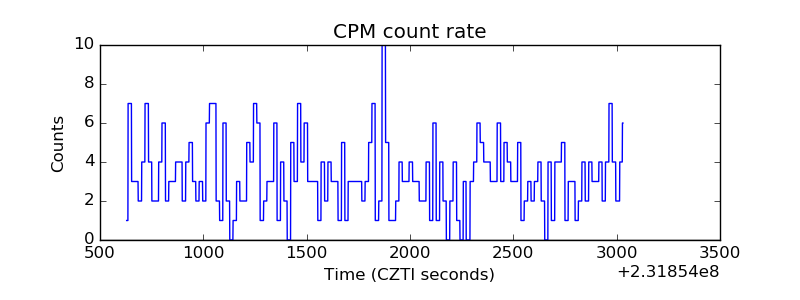 |
| CZT Counter | 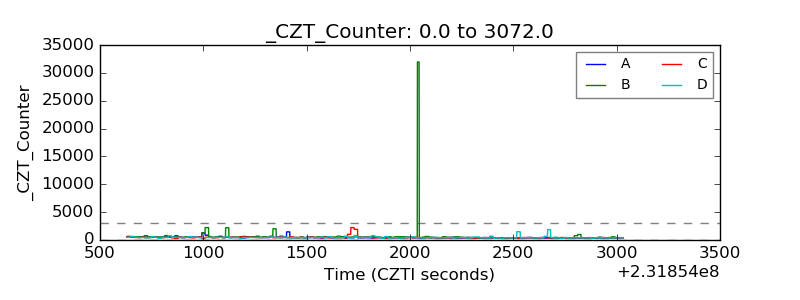 |
| +2.5 Volts monitor |  |
| +5 Volts monitor |  |
| _ROLL_ROT |  |
| _Roll_DEC | 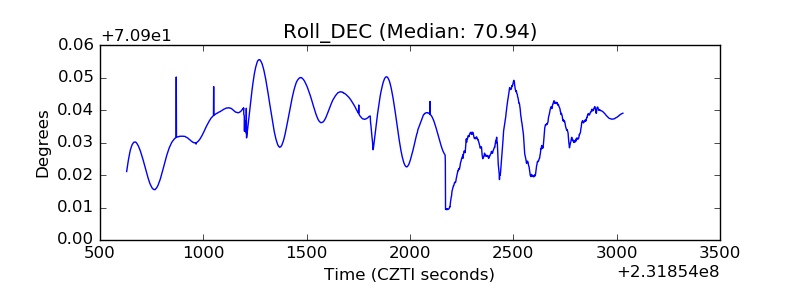 |
| _Roll_RA | 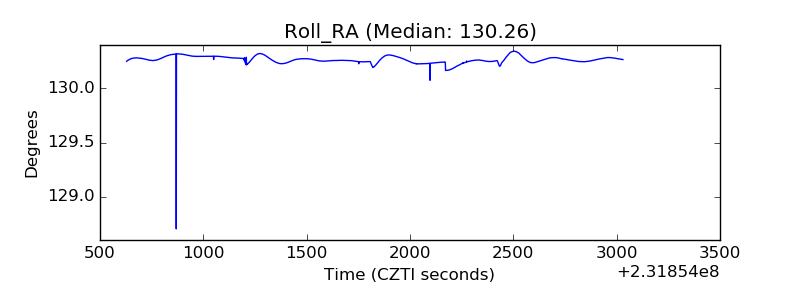 |
| Veto Counter |  |