| Param | Original file | Final file |
|---|---|---|
| Filename | modeM0/AS1G07_024T01_9000001206_08696cztM0_level2.evt | modeM0/AS1G07_024T01_9000001206_08696cztM0_level2_quad_clean.evt |
| Size (bytes) | 98,962,560 | 27,944,640 |
| Size | 94.4 MB | 26.7 MB |
| Events in quadrant A | 670,140 | 186,077 |
| Events in quadrant B | 794,485 | 187,132 |
| Events in quadrant C | 719,728 | 178,555 |
| Events in quadrant D | 700,670 | 175,755 |
| Mode M0 | |||
|---|---|---|---|
| Quadrant | BADHDUFLAG | Total packets | Discarded packets |
| A | 0 | 3314 | 47 |
| B | 0 | 3500 | 61 |
| C | 0 | 3493 | 75 |
| D | 0 | 3410 | 61 |
| Mode SS | |||
|---|---|---|---|
| Quadrant | BADHDUFLAG | Total packets | Discarded packets |
| A | 0 | 32 | 0 |
| B | 0 | 32 | 0 |
| C | 0 | 32 | 0 |
| D | 0 | 32 | 0 |
| Quadrant | Total seconds | Saturated seconds | Saturation percentage |
|---|---|---|---|
| A | 1607 | 9 | 0.560050% |
| B | 1605 | 10 | 0.623053% |
| C | 1603 | 26 | 1.621959% |
| D | 1603 | 6 | 0.374298% |
Noise dominated data is calculated using 1-second bins in cleaned event files. If a bin has >2000 counts, and if more than 50% of those come from <1% of pixels, then it is considered to be noise-dominated and hence unusable.
| Quadrant | # 1 sec bins | Bins with >0 counts | Bins with >2000 counts | High rate bins dominated by noise | Noise dominated (total time) | Noise dominated (detector-on time) | Marked lightcurve |
|---|---|---|---|---|---|---|---|
| A | 1630 | 1629 | 5 | 5 | 0.31% | 0.31% | 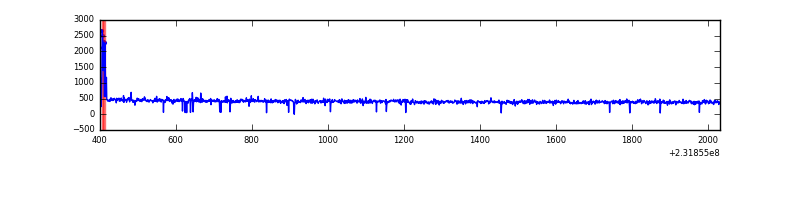 |
| B | 1630 | 1628 | 8 | 8 | 0.49% | 0.49% | 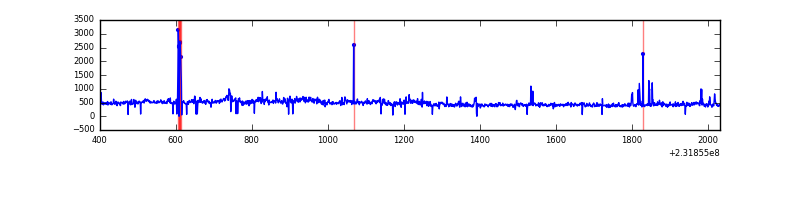 |
| C | 1630 | 1627 | 22 | 22 | 1.35% | 1.35% | 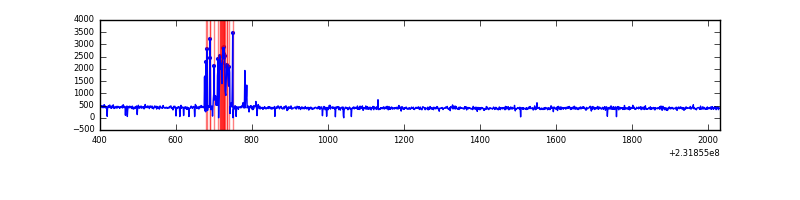 |
| D | 1629 | 1628 | 4 | 4 | 0.25% | 0.25% | 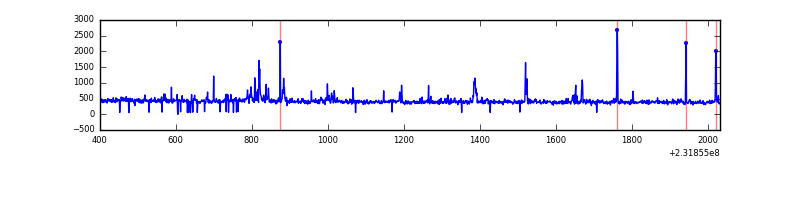 |
Top three noisy pixels from each quadrant. If the there are fewer than three noisy pixels in the level2.evt file, extra rows are filled as -1
| Pixel properties | Quadrant properties | ||||||
|---|---|---|---|---|---|---|---|
| Quadrant | DetID | PixID | Counts | Sigma | Mean | Median | Sigma |
| A | 15 | 174 | 18597 | 510.94 | 168 | 164 | 36.1 |
| A | 0 | 226 | 1644 | 41.02 | 168 | 164 | 36.1 |
| A | 12 | 194 | 1588 | 39.47 | 168 | 164 | 36.1 |
| B | 0 | 219 | 59712 | 1796.67 | 168 | 164 | 33.1 |
| B | 10 | 16 | 22508 | 674.16 | 168 | 164 | 33.1 |
| B | 0 | 214 | 15736 | 469.83 | 168 | 164 | 33.1 |
| C | 14 | 234 | 77749 | 1977.06 | 164 | 164 | 39.2 |
| C | 13 | 61 | 1328 | 29.66 | 164 | 164 | 39.2 |
| C | 8 | 222 | 1309 | 29.18 | 164 | 164 | 39.2 |
| D | 2 | 152 | 30470 | 731.2 | 166 | 161 | 41.5 |
| D | 2 | 14 | 18938 | 452.99 | 166 | 161 | 41.5 |
| D | 9 | 64 | 12332 | 293.62 | 166 | 161 | 41.5 |
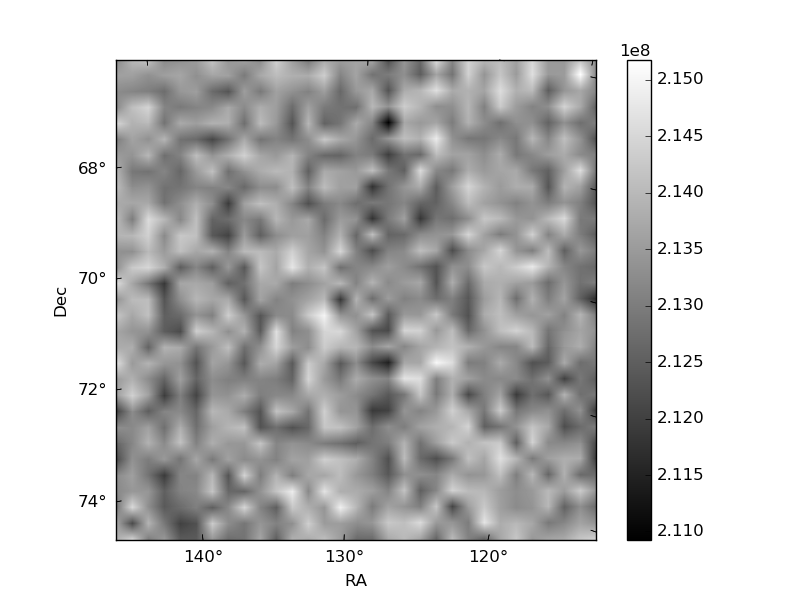
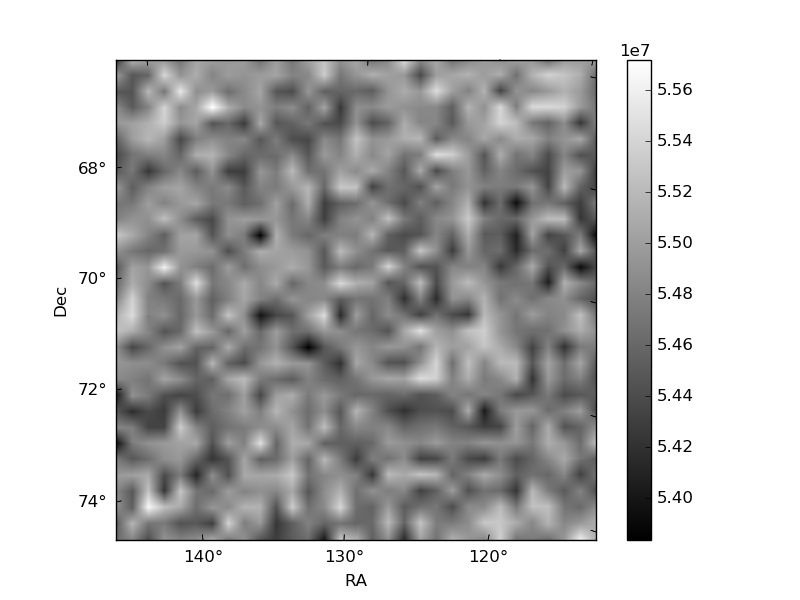
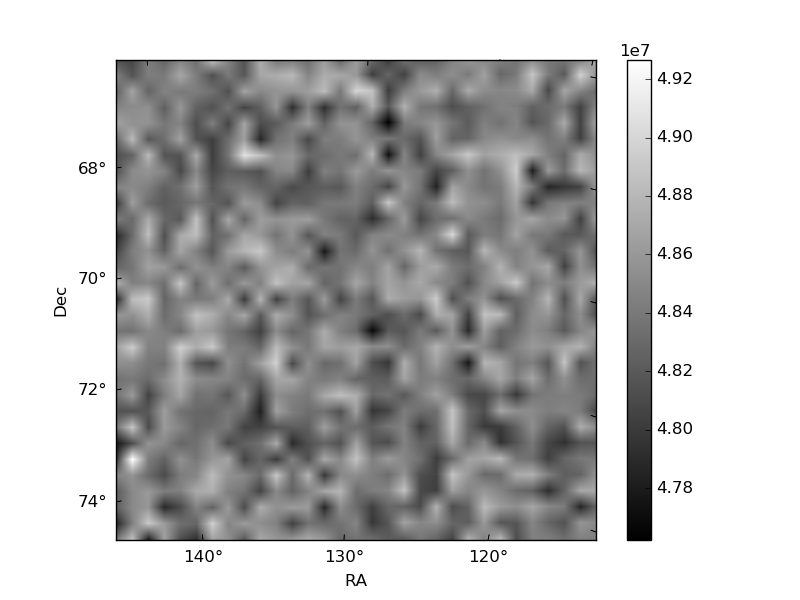
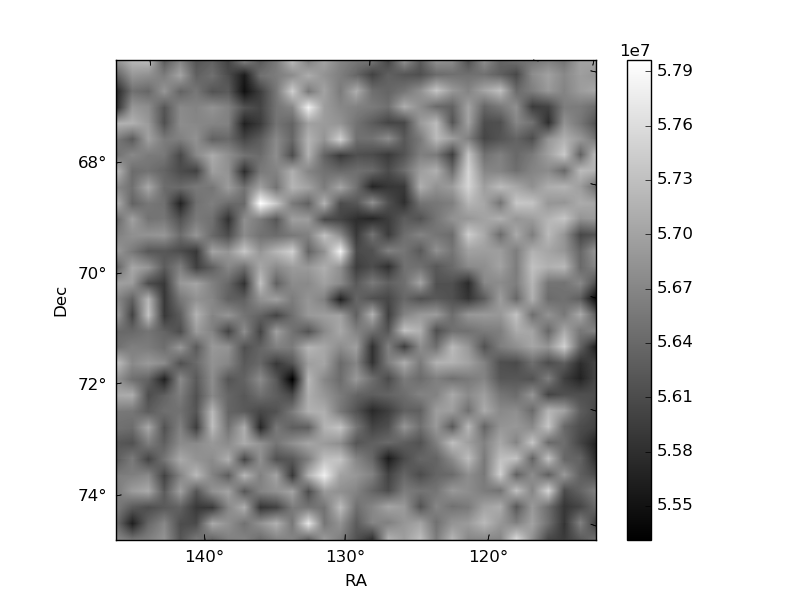
Histogram calculated using DETX and DETY for each event in the final _common_clean file
| Quadrant A | 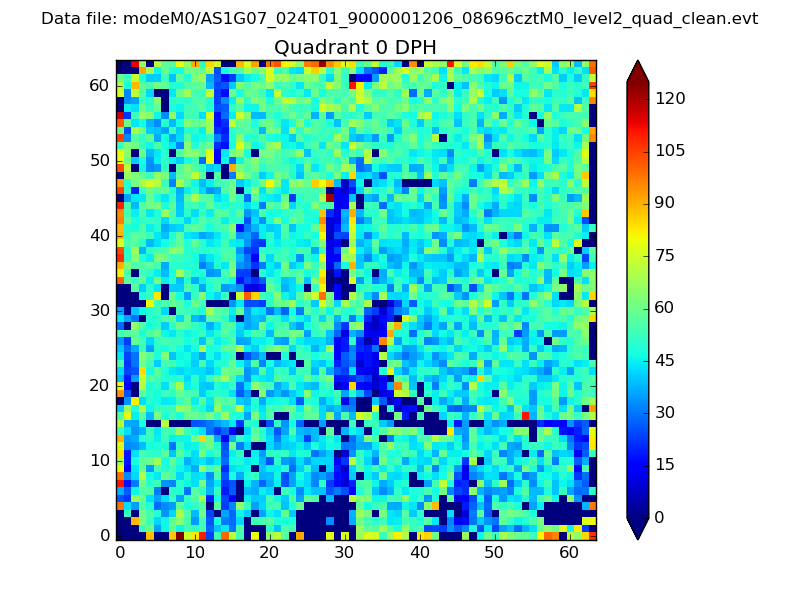 |
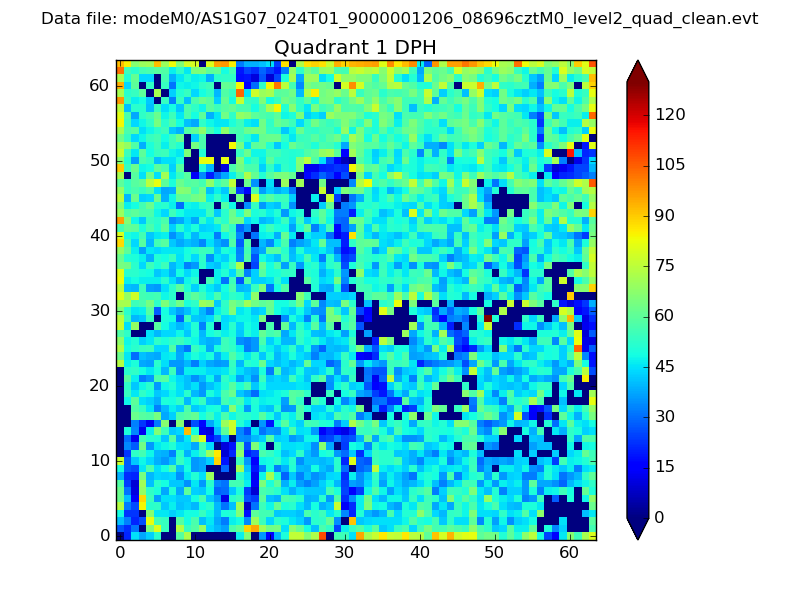 |
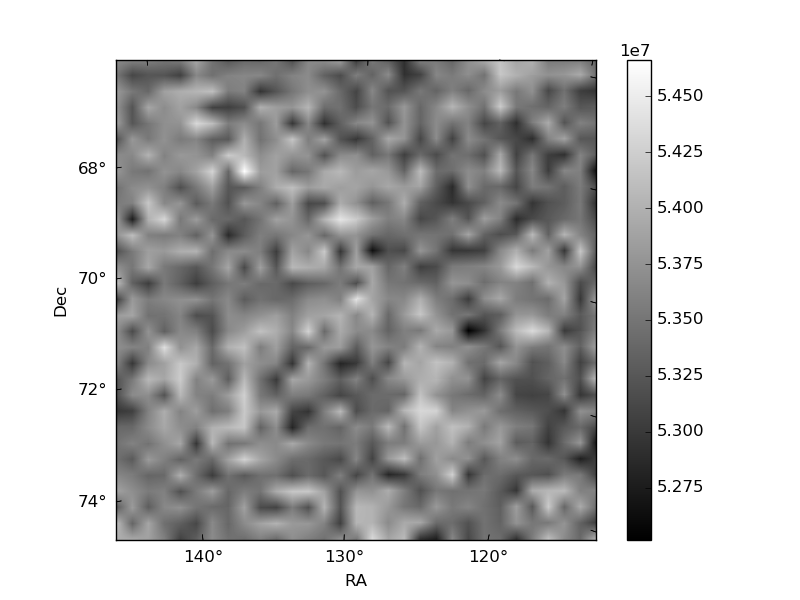
Quadrant B |
|---|---|---|---|
| Quadrant D | 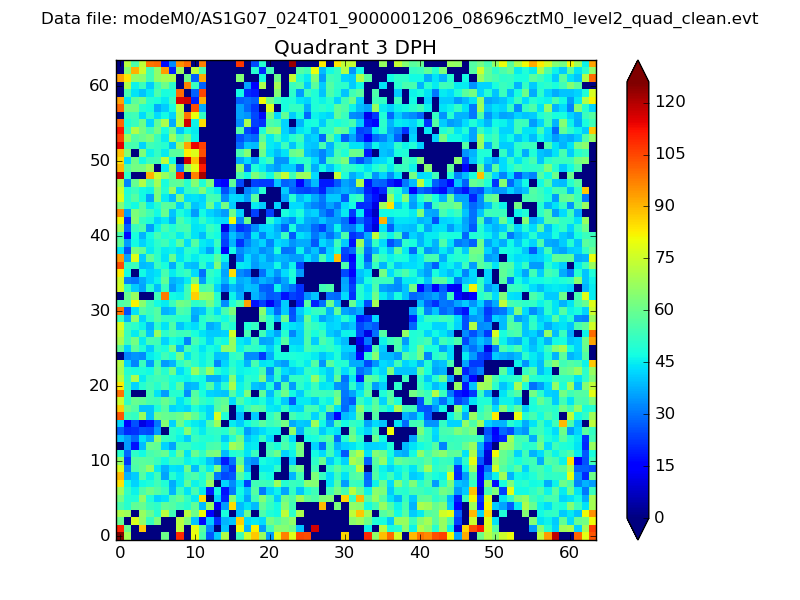 |
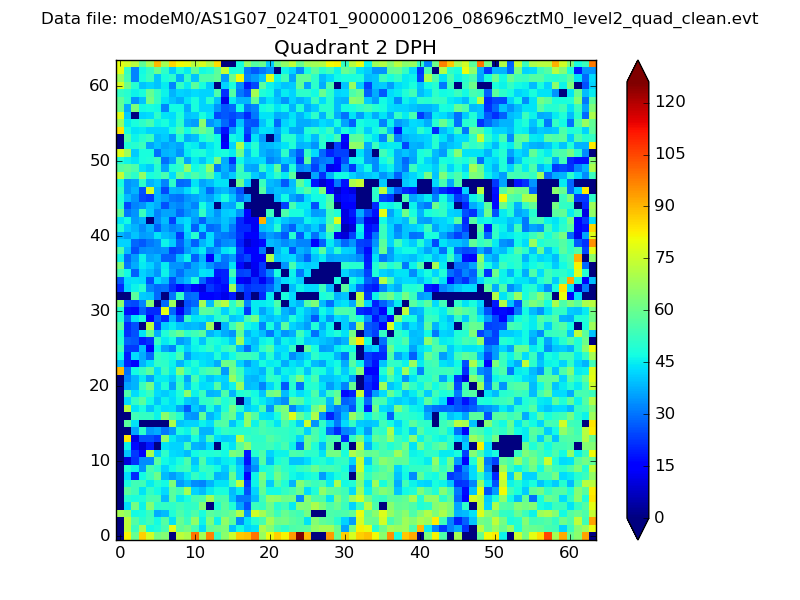 |
Quadrant C |
| Plot type | Count rate plots | Images |
|---|---|---|
| Comparison with Poisson distribution Blue bars denote a histogram of data divided into 1 sec bins. Red curve is a Poisson curve with rate = median count rate of data. |
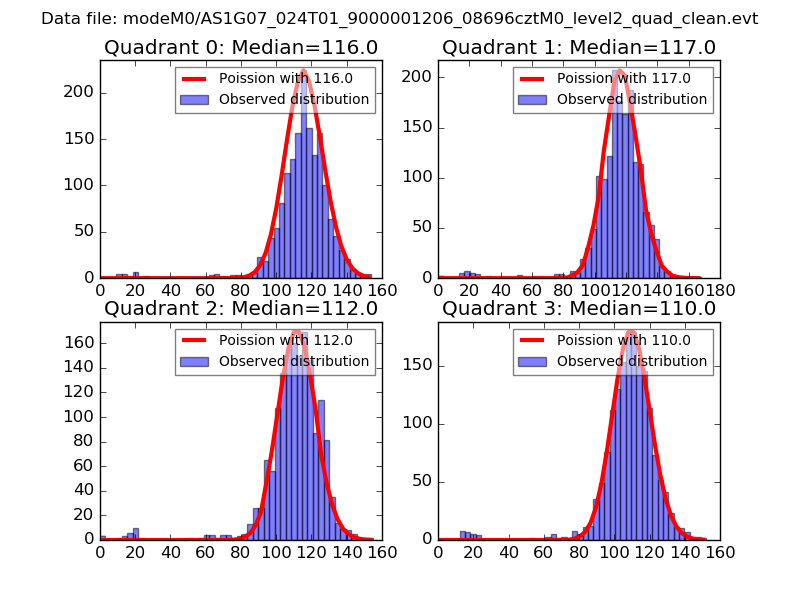 |
 |
| Quadrant-wise count rates Data is divided into 100 sec bins |
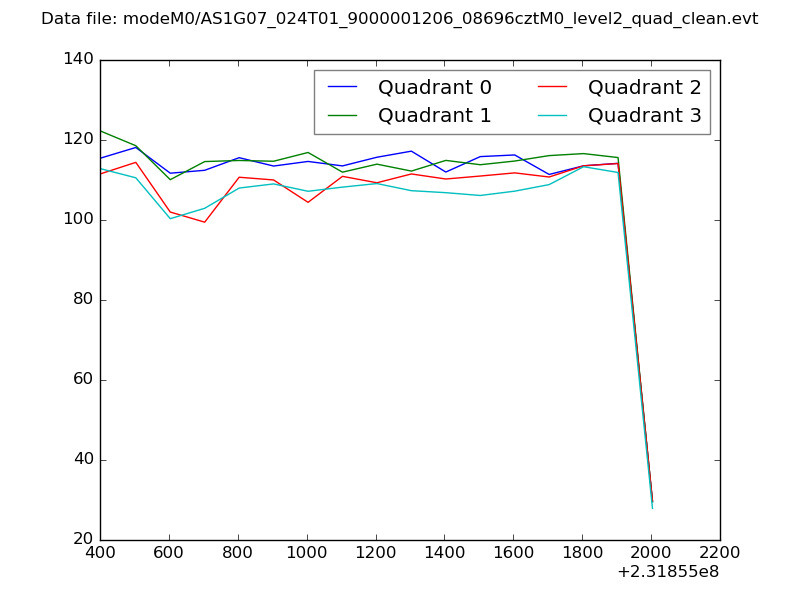 |
|
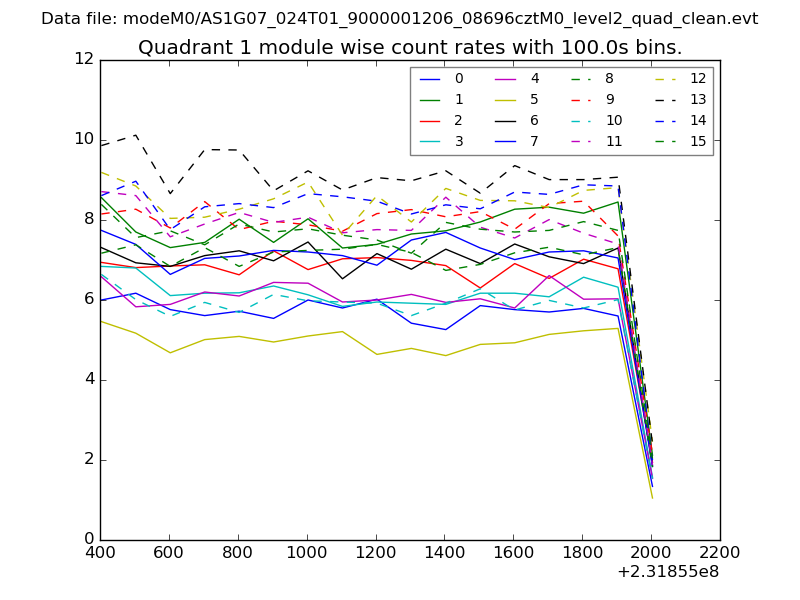
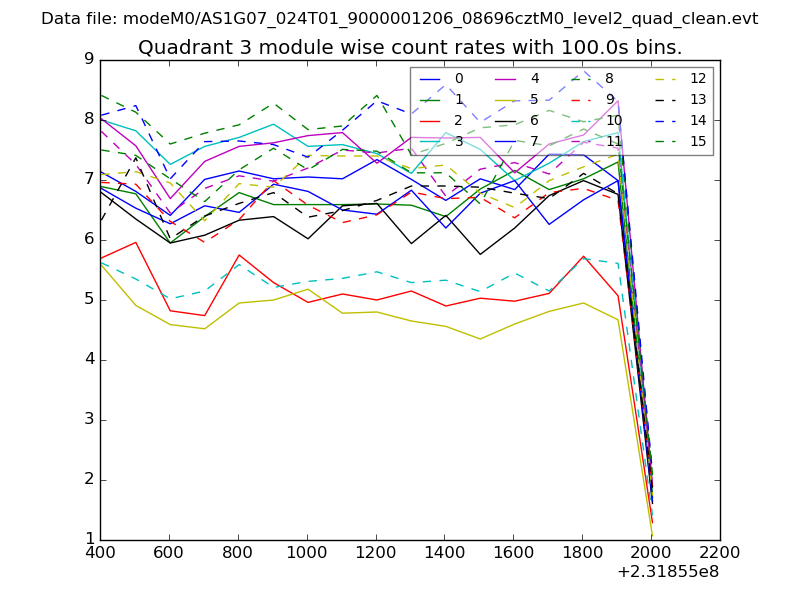
| Module-wise count rates for Quadrant A Data is divided into 100 sec bins |
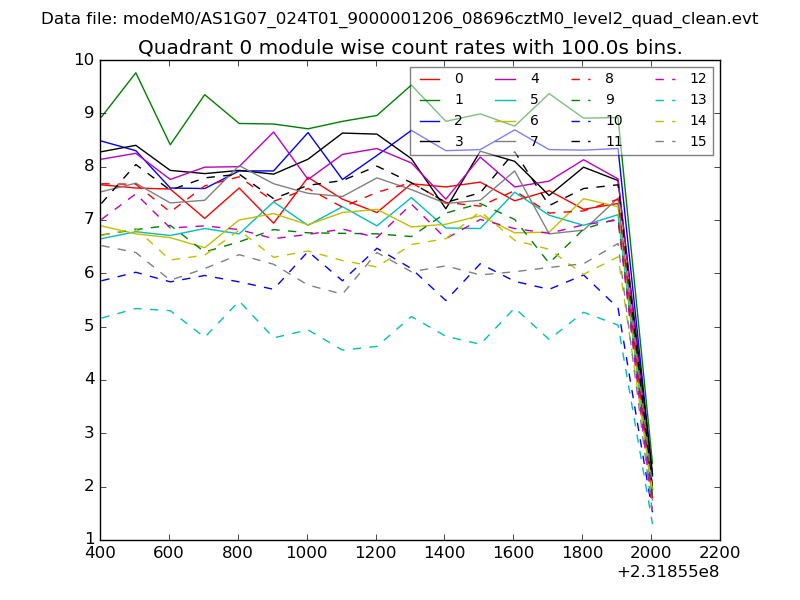 |
 |
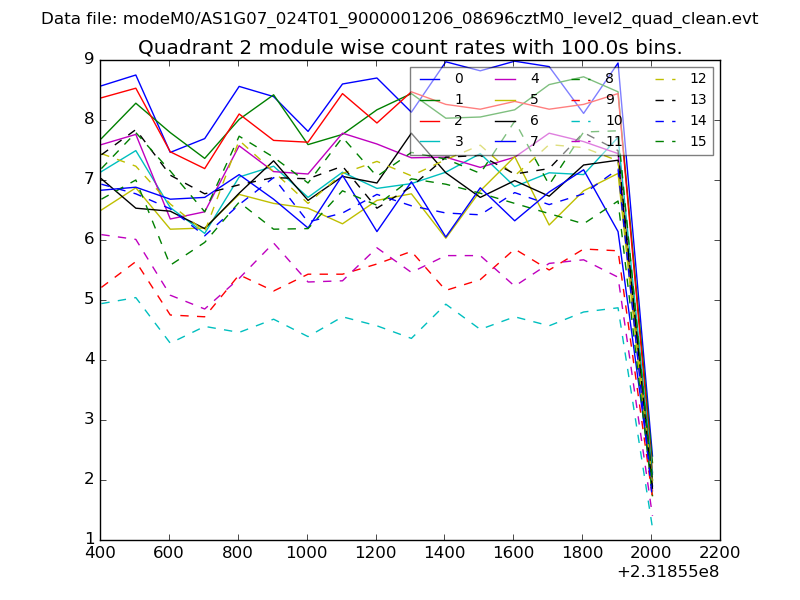
| Module-wise count rates for Quadrant B Data is divided into 100 sec bins |
 |
 |
| Module-wise count rates for Quadrant C Data is divided into 100 sec bins |
 |
 |
| Module-wise count rates for Quadrant D Data is divided into 100 sec bins |
 |
 |
| Parameter | Plot |
|---|---|
| CZT HV Monitor | 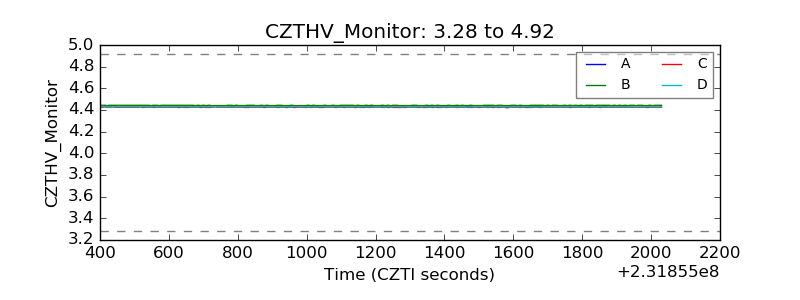 |
| D_VDD | 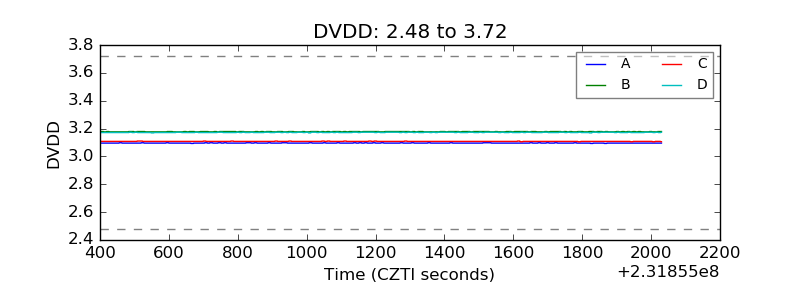 |
| Temperature 1 | 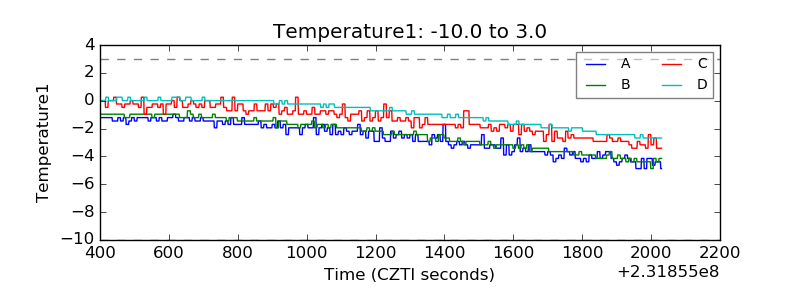 |
| Veto HV Monitor | 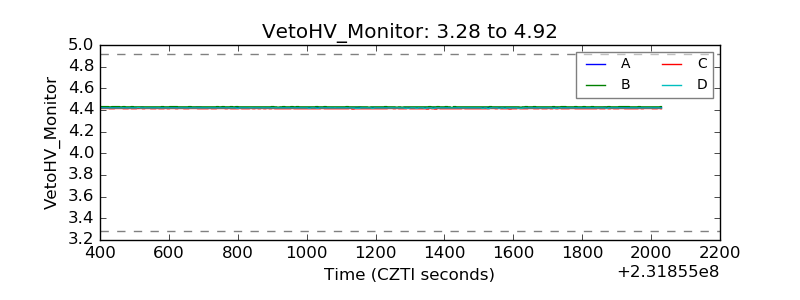 |
| Veto LLD | 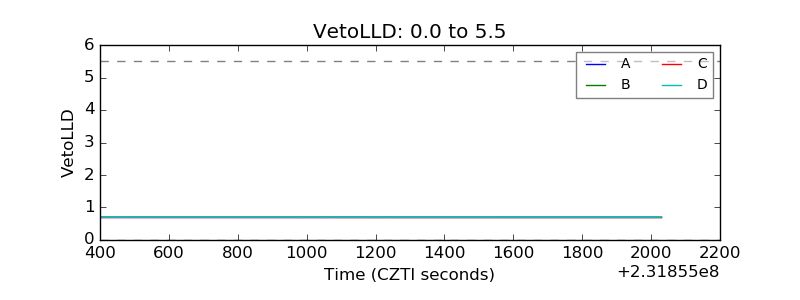 |
| Alpha Counter | 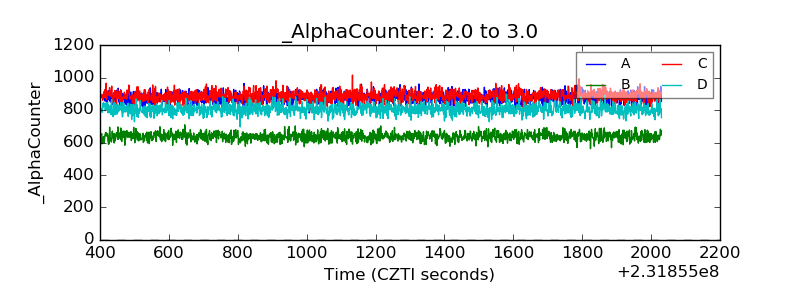 |
| _CPM_Rate | 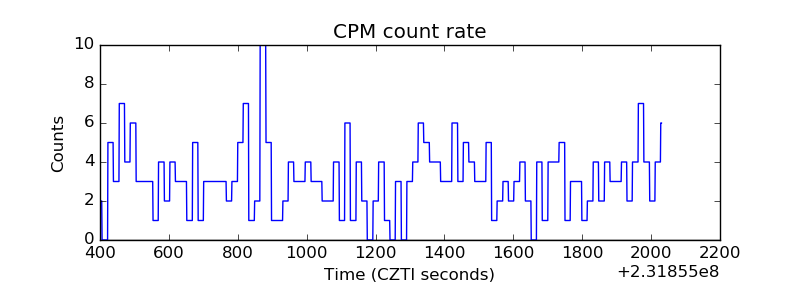 |
| CZT Counter | 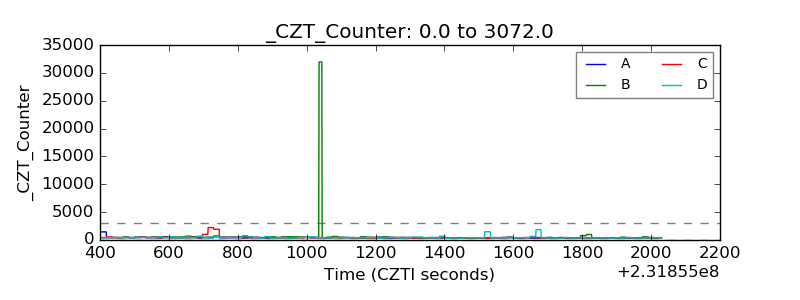 |
| +2.5 Volts monitor |  |
| +5 Volts monitor |  |
| _ROLL_ROT | 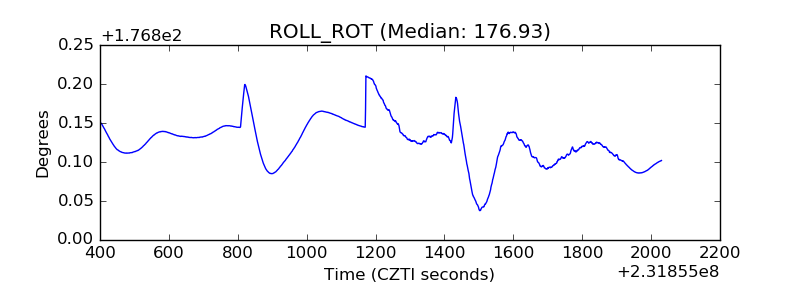 |
| _Roll_DEC | 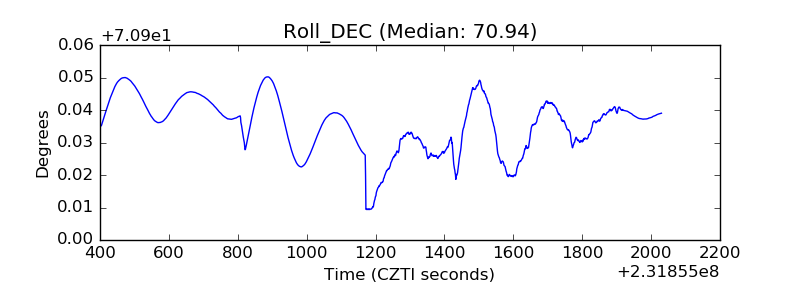 |
| _Roll_RA | 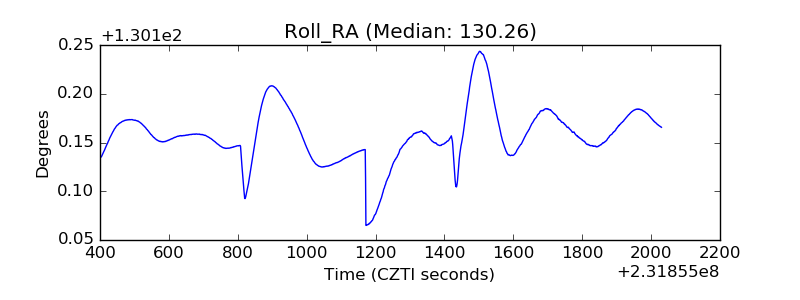 |
| Veto Counter | 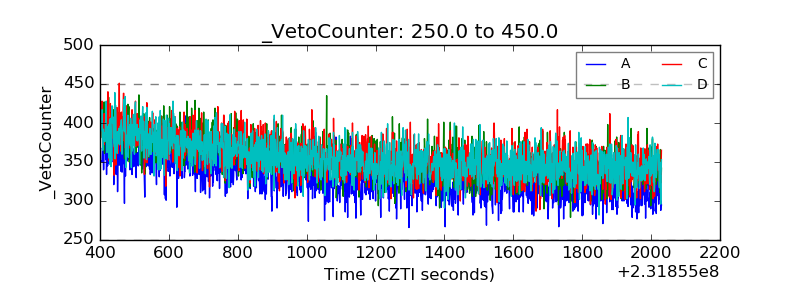 |