| Param | Original file | Final file |
|---|---|---|
| Filename | modeM0/AS1A03_052T01_9000001208cztM0_level2.fits | modeM0/AS1A03_052T01_9000001208cztM0_level2_quad_clean.evt |
| Size (bytes) | 562,239,360 | 546,125,760 |
| Size | 536.2 MB | 520.8 MB |
| Events in quadrant A | 3,373,482 | 3,184,877 |
| Events in quadrant B | 3,266,980 | 3,250,115 |
| Events in quadrant C | 3,388,871 | 3,159,067 |
| Events in quadrant D | 2,895,401 | 2,845,213 |
| Mode M9 | |||
|---|---|---|---|
| Quadrant | BADHDUFLAG | Total packets | Discarded packets |
| A | 0 | 96 | 0 |
| B | 0 | 97 | 0 |
| C | 0 | 97 | 0 |
| D | 0 | 98 | 0 |
| Mode SS | |||
|---|---|---|---|
| Quadrant | BADHDUFLAG | Total packets | Discarded packets |
| A | 0 | 1222 | 0 |
| B | 0 | 1224 | 0 |
| C | 0 | 1221 | 0 |
| D | 0 | 1229 | 0 |
| Mode M0 | |||
|---|---|---|---|
| Quadrant | BADHDUFLAG | Total packets | Discarded packets |
| A | 0 | 125234 | 0 |
| B | 0 | 128101 | 0 |
| C | 0 | 123352 | 0 |
| D | 0 | 139734 | 0 |
| Quadrant | Total seconds | Saturated seconds | Saturation percentage |
|---|---|---|---|
| A | 59726 | 875 | 1.465024% |
| B | 59700 | 1235 | 2.068677% |
| C | 59853 | 545 | 0.910564% |
| D | 59662 | 1619 | 2.713620% |
Noise dominated data is calculated using 1-second bins in cleaned event files. If a bin has >2000 counts, and if more than 50% of those come from <1% of pixels, then it is considered to be noise-dominated and hence unusable.
| Quadrant | # 1 sec bins | Bins with >0 counts | Bins with >2000 counts | High rate bins dominated by noise | Noise dominated (total time) | Noise dominated (detector-on time) | Marked lightcurve |
|---|---|---|---|---|---|---|---|
| A | 74209 | 61100 | 0 | 0 | 0.00% | 0.00% | 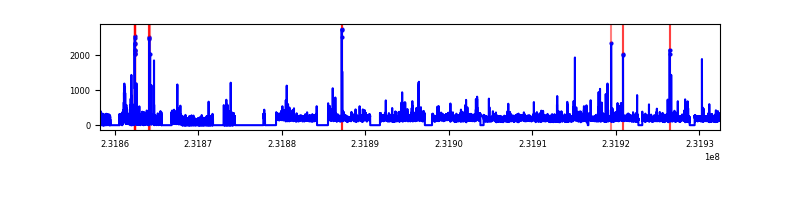 |
| B | 74209 | 61001 | 0 | 0 | 0.00% | 0.00% | 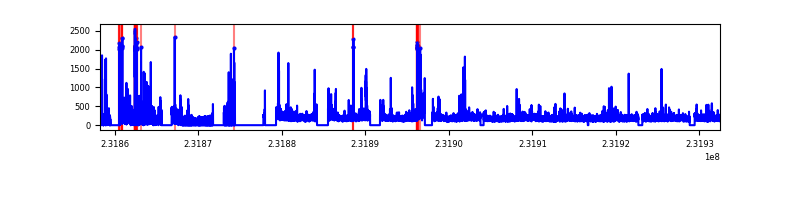 |
| C | 74209 | 61164 | 0 | 0 | 0.00% | 0.00% | 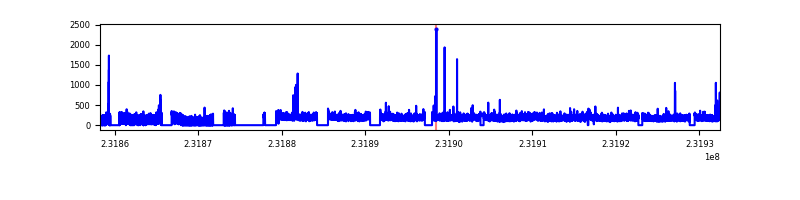 |
| D | 74206 | 60988 | 0 | 0 | 0.00% | 0.00% | 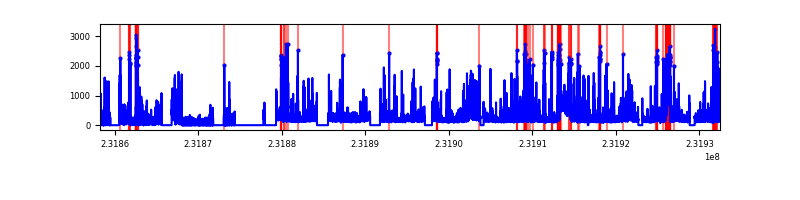 |
Top three noisy pixels from each quadrant. If the there are fewer than three noisy pixels in the level2.evt file, extra rows are filled as -1
| Pixel properties | Quadrant properties | ||||||
|---|---|---|---|---|---|---|---|
| Quadrant | DetID | PixID | Counts | Sigma | Mean | Median | Sigma |
| A | 0 | 29 | 3260 | 10.9 | 875 | 813 | 224.4 |
| A | 7 | 110 | 2757 | 8.66 | 875 | 813 | 224.4 |
| A | 0 | 30 | 2607 | 7.99 | 875 | 813 | 224.4 |
| B | 2 | 9 | 2808 | 11.48 | 862 | 817 | 173.4 |
| B | 2 | 8 | 2212 | 8.04 | 862 | 817 | 173.4 |
| B | 3 | 17 | 2210 | 8.03 | 862 | 817 | 173.4 |
| C | 1 | 80 | 2508 | 7.12 | 894 | 830 | 235.8 |
| C | 1 | 81 | 2498 | 7.07 | 894 | 830 | 235.8 |
| C | 12 | 241 | 2417 | 6.73 | 894 | 830 | 235.8 |
| D | 6 | 231 | 2154 | 6.33 | 825 | 750 | 221.7 |
| D | 3 | 14 | 2123 | 6.19 | 825 | 750 | 221.7 |
| D | 11 | 82 | 2034 | 5.79 | 825 | 750 | 221.7 |
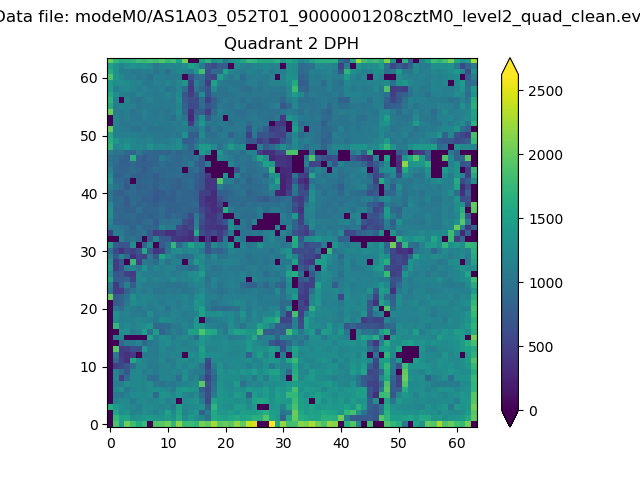
Histogram calculated using DETX and DETY for each event in the final _common_clean file
| Quadrant A | 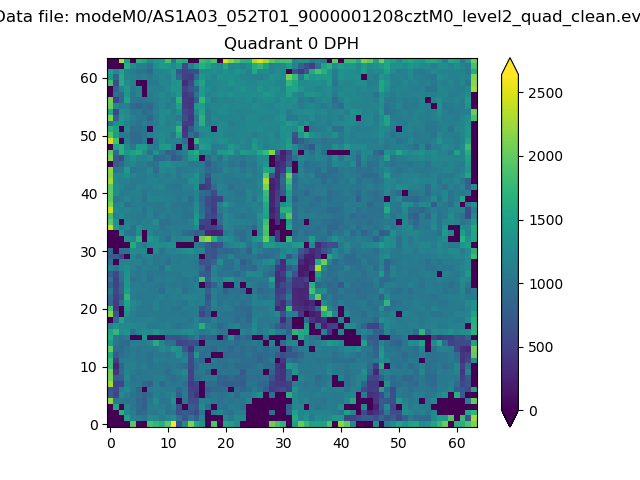 |
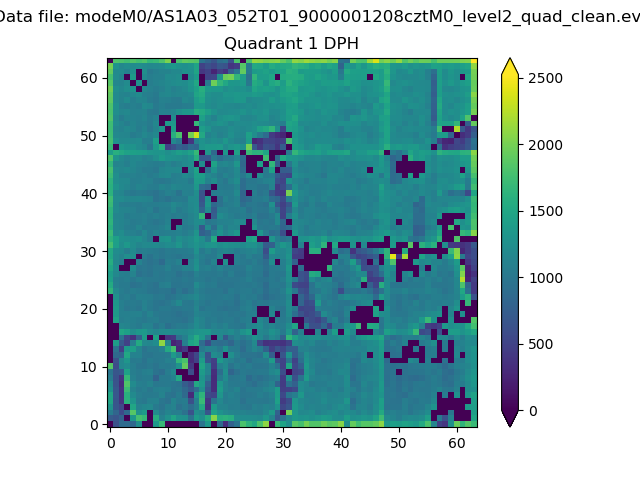 |
Quadrant B |
|---|---|---|---|
| Quadrant D | 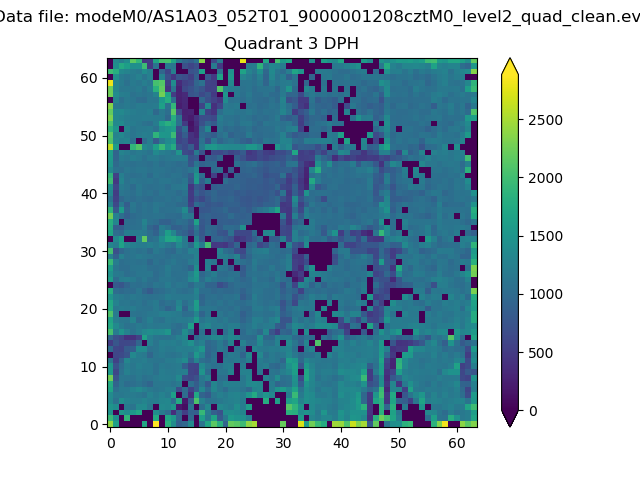 |
 |
Quadrant C |
| Plot type | Count rate plots | Images |
|---|---|---|
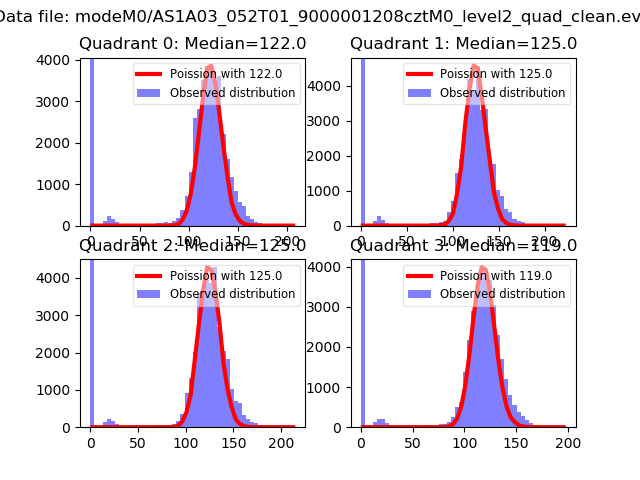
| Comparison with Poisson distribution Blue bars denote a histogram of data divided into 1 sec bins. Red curve is a Poisson curve with rate = median count rate of data. |
 |
 |
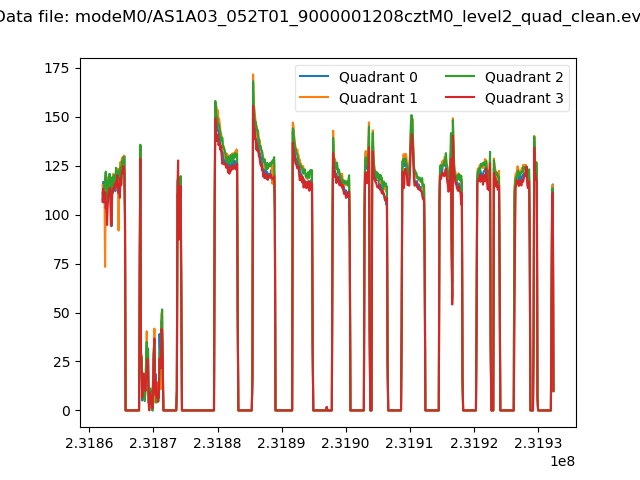
| Quadrant-wise count rates Data is divided into 100 sec bins |
 |
|
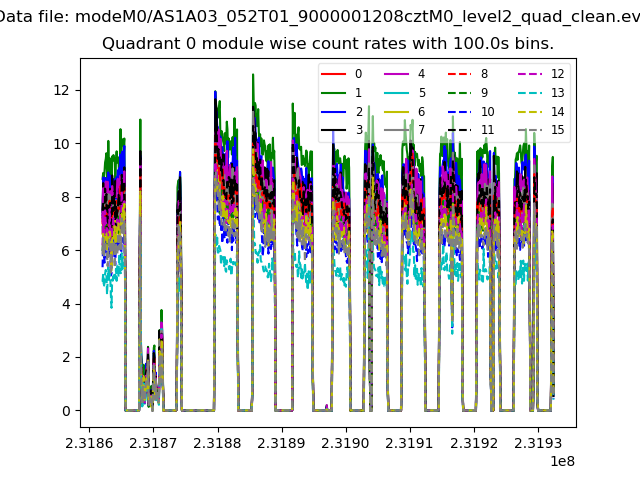
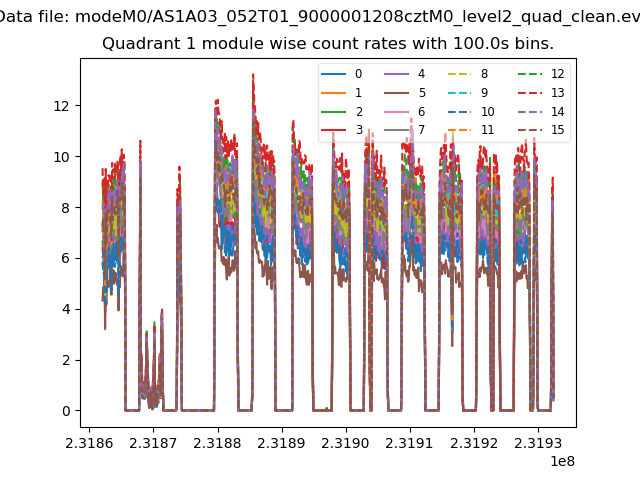
| Module-wise count rates for Quadrant A Data is divided into 100 sec bins |
 |
 |
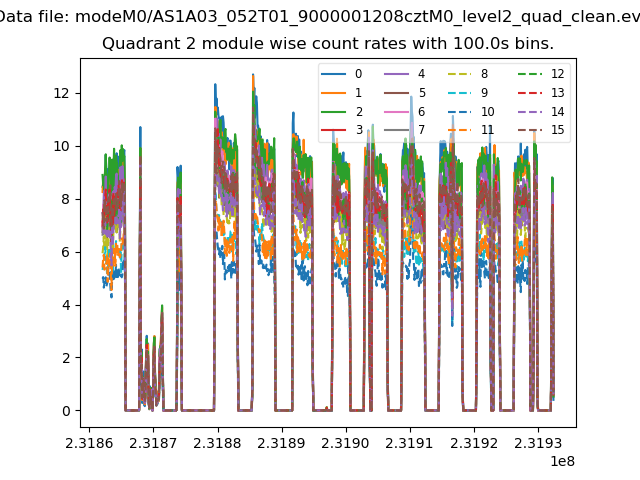
| Module-wise count rates for Quadrant B Data is divided into 100 sec bins |
 |
 |
| Module-wise count rates for Quadrant C Data is divided into 100 sec bins |
 |
 |
| Module-wise count rates for Quadrant D Data is divided into 100 sec bins |
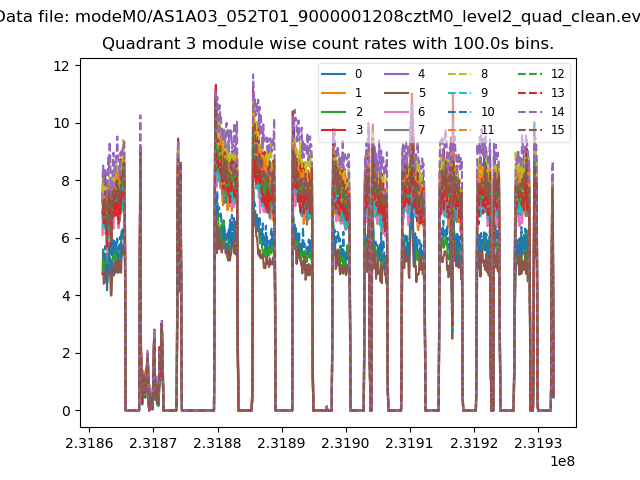 |
 |
| Parameter | Plot |
|---|---|
| CZT HV Monitor | 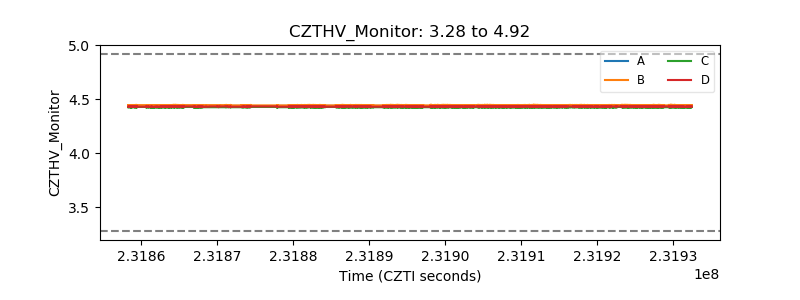 |
| D_VDD | 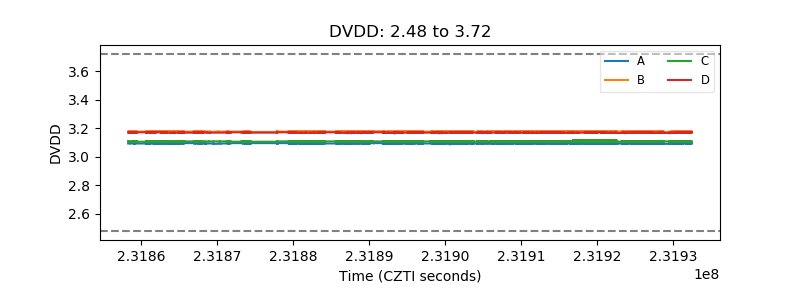 |
| Temperature 1 | 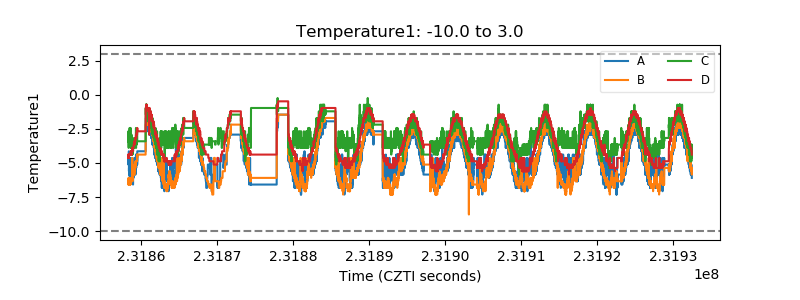 |
| Veto HV Monitor | 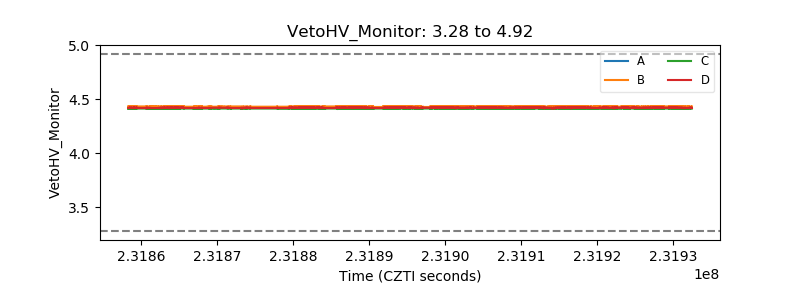 |
| Veto LLD | 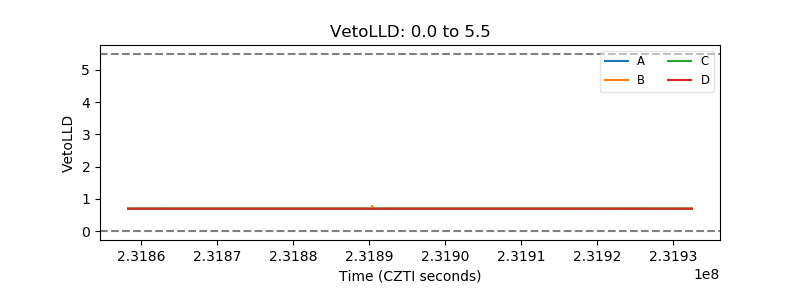 |
| Alpha Counter |  |
| _CPM_Rate | 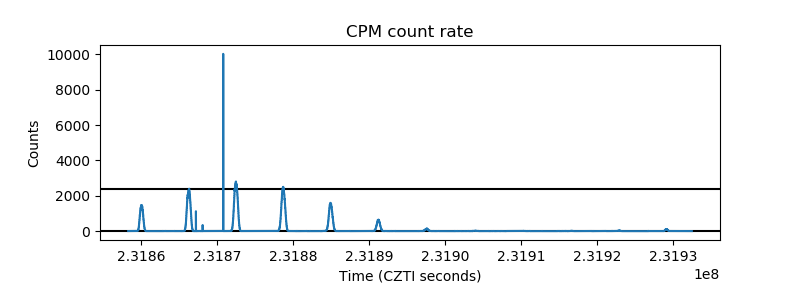 |
| CZT Counter | 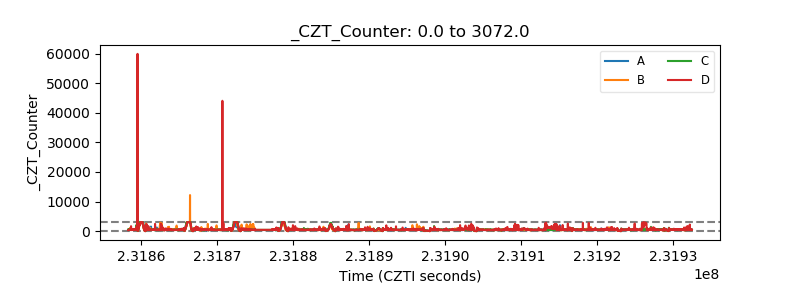 |
| +2.5 Volts monitor | 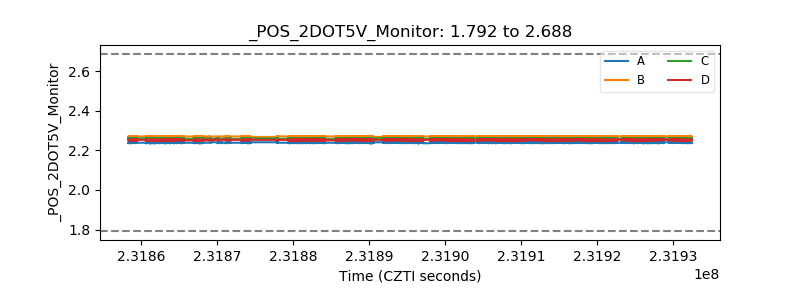 |
| +5 Volts monitor | 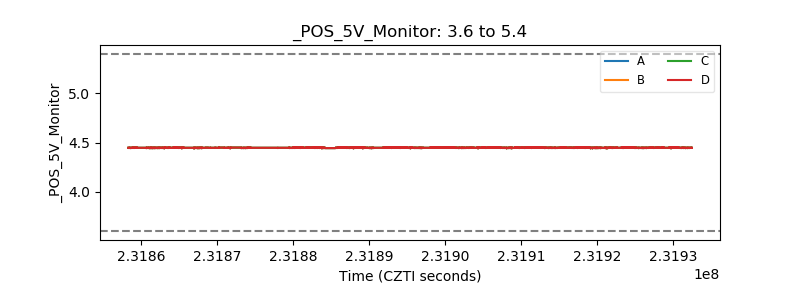 |
| _ROLL_ROT | 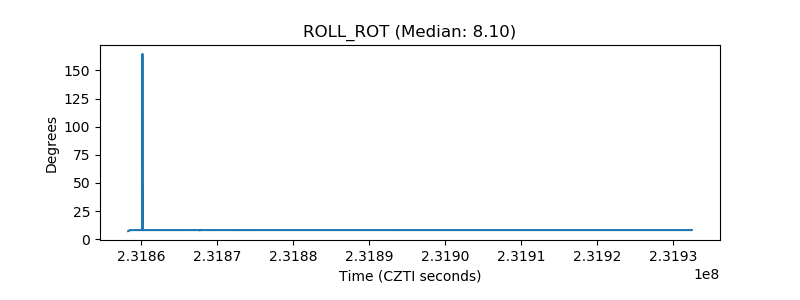 |
| _Roll_DEC | 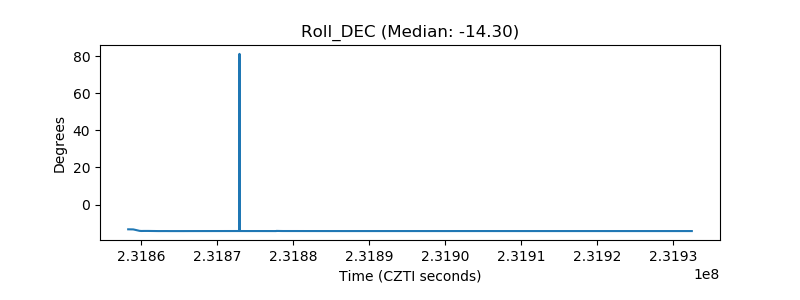 |
| _Roll_RA | 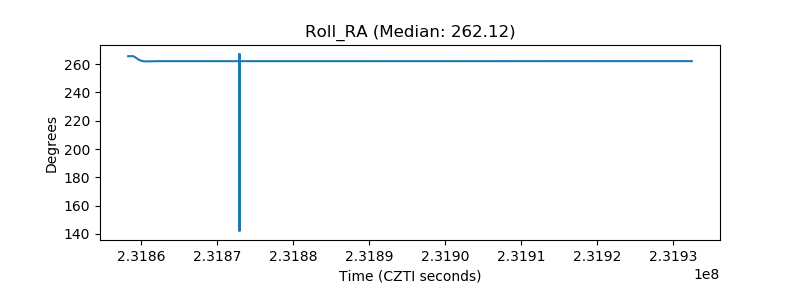 |
| Veto Counter | 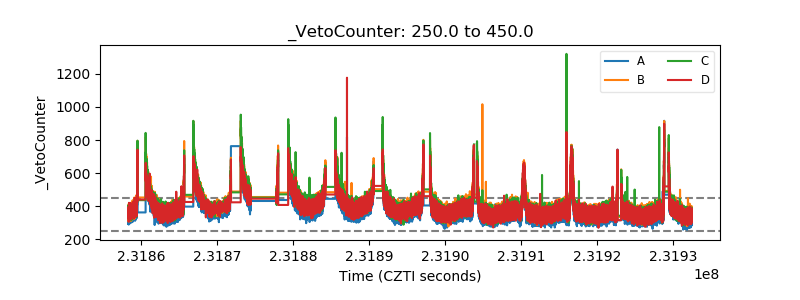 |