| Param | Original file | Final file |
|---|---|---|
| Filename | modeM0/AS1A03_052T01_9000001208_08696cztM0_level2.evt | modeM0/AS1A03_052T01_9000001208_08696cztM0_level2_quad_clean.evt |
| Size (bytes) | 499,138,560 | 88,375,680 |
| Size | 476.0 MB | 84.3 MB |
| Events in quadrant A | 3,585,954 | 551,620 |
| Events in quadrant B | 4,008,145 | 550,445 |
| Events in quadrant C | 3,344,751 | 557,502 |
| Events in quadrant D | 3,701,834 | 529,425 |
| Mode M9 | |||
|---|---|---|---|
| Quadrant | BADHDUFLAG | Total packets | Discarded packets |
| A | 0 | 23 | 1 |
| B | 0 | 23 | 1 |
| C | 0 | 23 | 1 |
| D | 0 | 23 | 1 |
| Mode SS | |||
|---|---|---|---|
| Quadrant | BADHDUFLAG | Total packets | Discarded packets |
| A | 0 | 154 | 12 |
| B | 0 | 154 | 8 |
| C | 0 | 154 | 10 |
| D | 0 | 154 | 4 |
| Mode M0 | |||
|---|---|---|---|
| Quadrant | BADHDUFLAG | Total packets | Discarded packets |
| A | 0 | 16607 | 1367 |
| B | 0 | 17930 | 1504 |
| C | 0 | 15686 | 1124 |
| D | 0 | 17170 | 1394 |
| Quadrant | Total seconds | Saturated seconds | Saturation percentage |
|---|---|---|---|
| A | 6962 | 94 | 1.350187% |
| B | 6959 | 249 | 3.578100% |
| C | 7025 | 42 | 0.597865% |
| D | 6975 | 109 | 1.562724% |
Noise dominated data is calculated using 1-second bins in cleaned event files. If a bin has >2000 counts, and if more than 50% of those come from <1% of pixels, then it is considered to be noise-dominated and hence unusable.
| Quadrant | # 1 sec bins | Bins with >0 counts | Bins with >2000 counts | High rate bins dominated by noise | Noise dominated (total time) | Noise dominated (detector-on time) | Marked lightcurve |
|---|---|---|---|---|---|---|---|
| A | 9801 | 7395 | 19 | 19 | 0.19% | 0.26% | 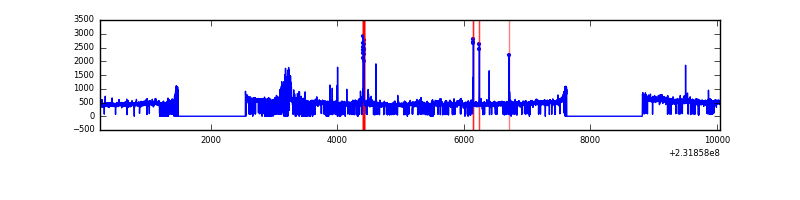 |
| B | 9801 | 7383 | 153 | 153 | 1.56% | 2.07% | 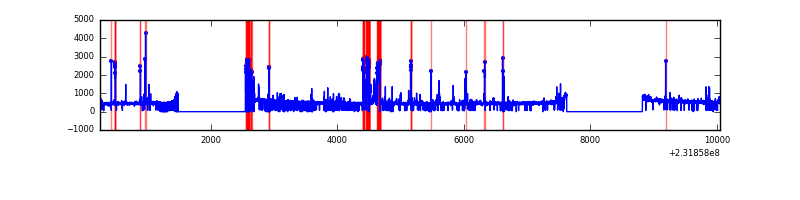 |
| C | 9801 | 7407 | 2 | 2 | 0.02% | 0.03% | 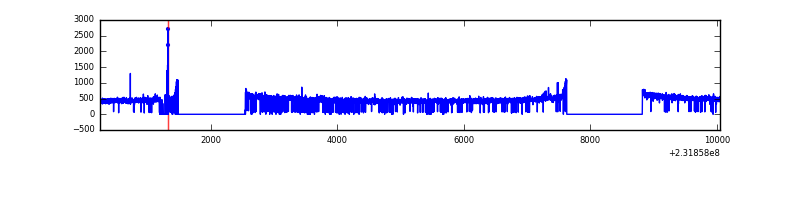 |
| D | 9801 | 7390 | 61 | 61 | 0.62% | 0.83% | 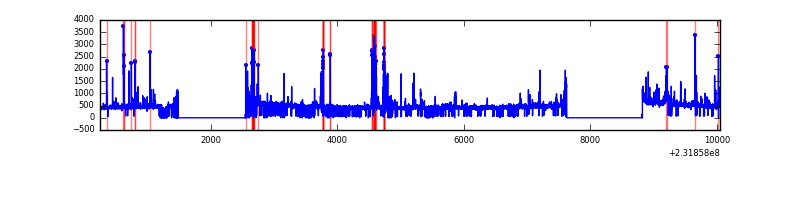 |
Top three noisy pixels from each quadrant. If the there are fewer than three noisy pixels in the level2.evt file, extra rows are filled as -1
| Pixel properties | Quadrant properties | ||||||
|---|---|---|---|---|---|---|---|
| Quadrant | DetID | PixID | Counts | Sigma | Mean | Median | Sigma |
| A | 0 | 254 | 147240 | 838.53 | 856 | 837 | 174.6 |
| A | 13 | 251 | 111231 | 632.29 | 856 | 837 | 174.6 |
| A | 5 | 16 | 22384 | 123.41 | 856 | 837 | 174.6 |
| B | 10 | 16 | 593823 | 3675.05 | 851 | 833 | 161.4 |
| B | 0 | 230 | 33272 | 201.04 | 851 | 833 | 161.4 |
| B | 15 | 85 | 24559 | 147.04 | 851 | 833 | 161.4 |
| C | 14 | 64 | 17538 | 84.26 | 849 | 856 | 198.0 |
| C | 14 | 234 | 9422 | 43.27 | 849 | 856 | 198.0 |
| C | 13 | 61 | 6373 | 27.87 | 849 | 856 | 198.0 |
| D | 1 | 52 | 171591 | 842.95 | 836 | 814 | 202.6 |
| D | 2 | 152 | 121984 | 598.09 | 836 | 814 | 202.6 |
| D | 12 | 233 | 112035 | 548.98 | 836 | 814 | 202.6 |
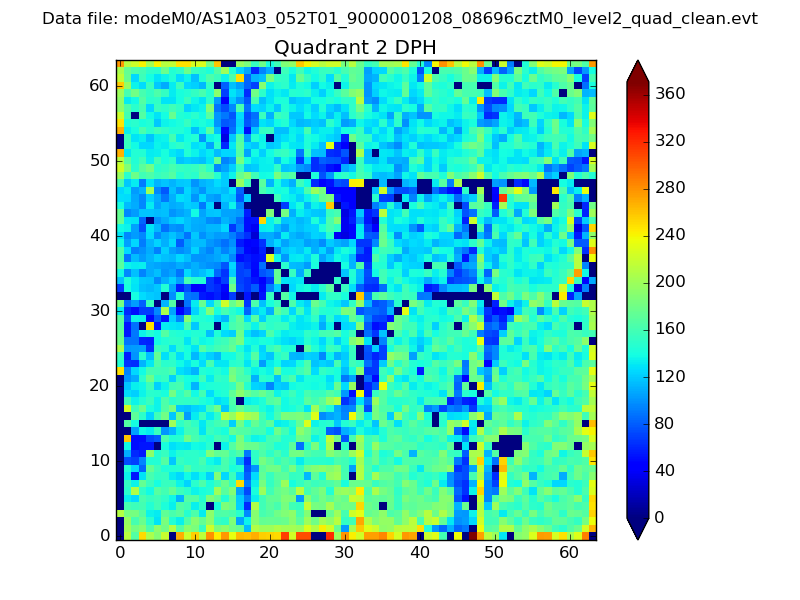
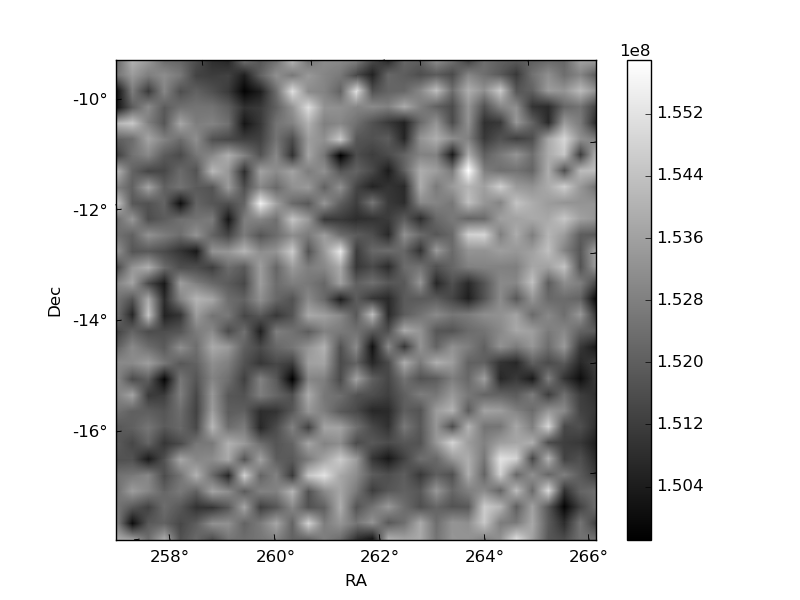
Histogram calculated using DETX and DETY for each event in the final _common_clean file
| Quadrant A | 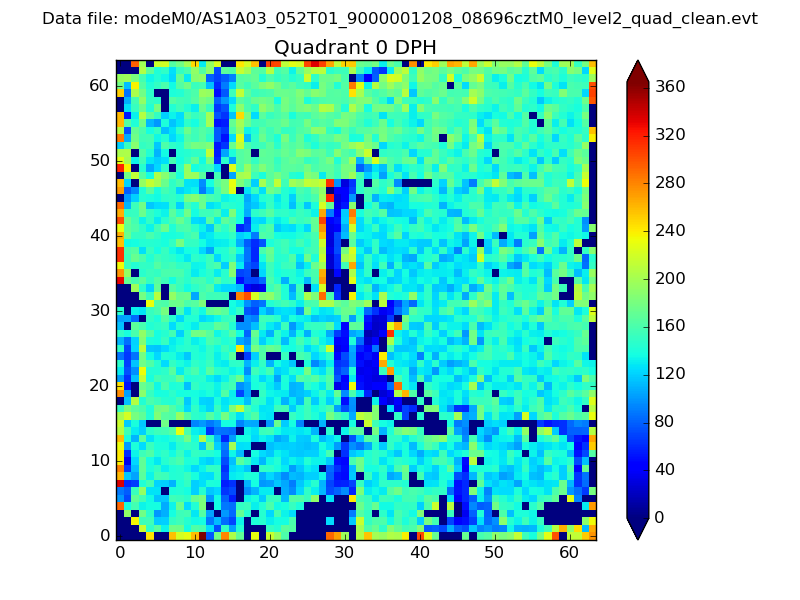 |
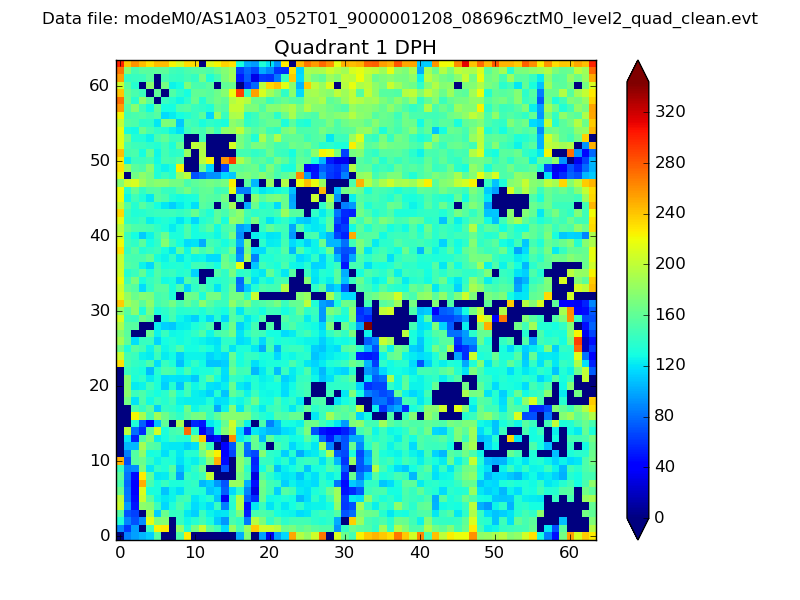 |
Quadrant B |
|---|---|---|---|
| Quadrant D | 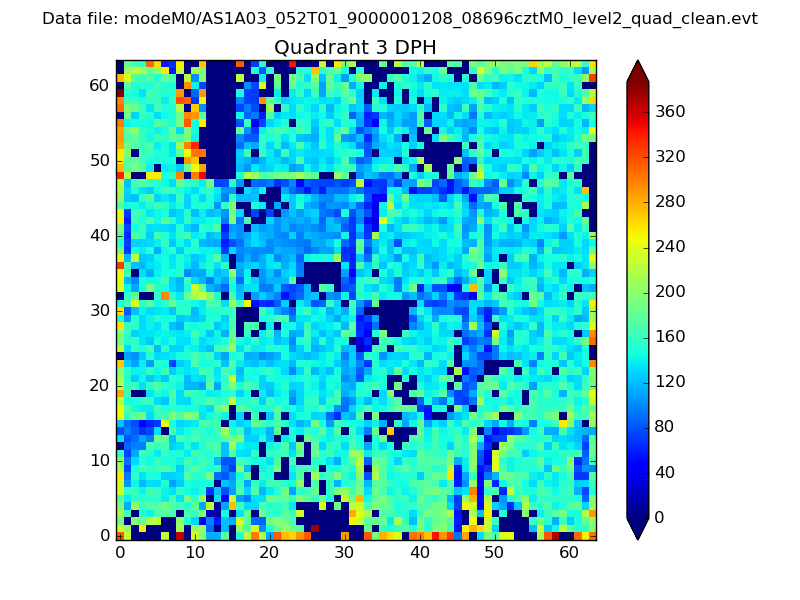 |
 |
Quadrant C |
| Plot type | Count rate plots | Images |
|---|---|---|
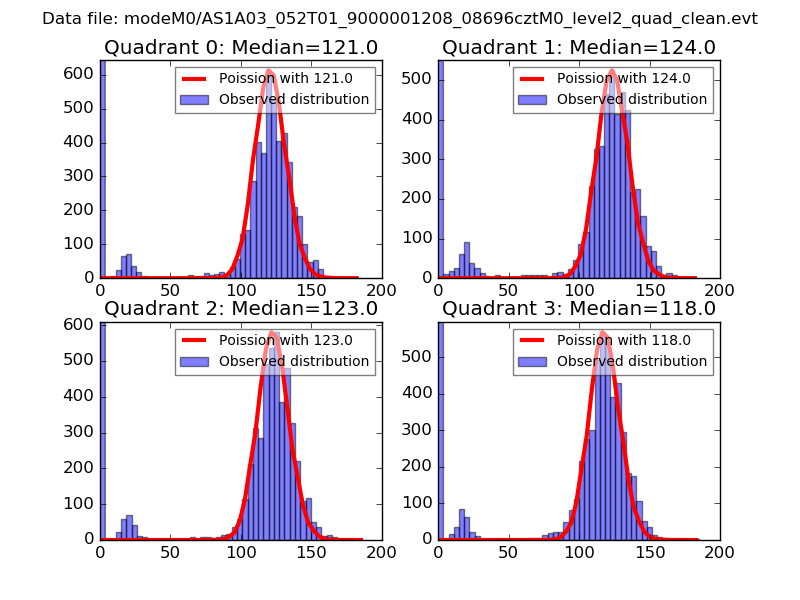
| Comparison with Poisson distribution Blue bars denote a histogram of data divided into 1 sec bins. Red curve is a Poisson curve with rate = median count rate of data. |
 |
 |
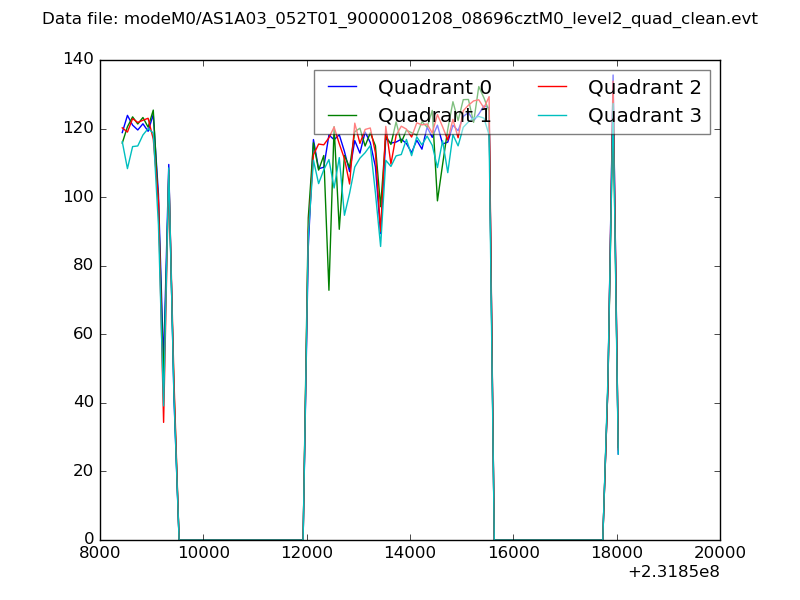
| Quadrant-wise count rates Data is divided into 100 sec bins |
 |
|
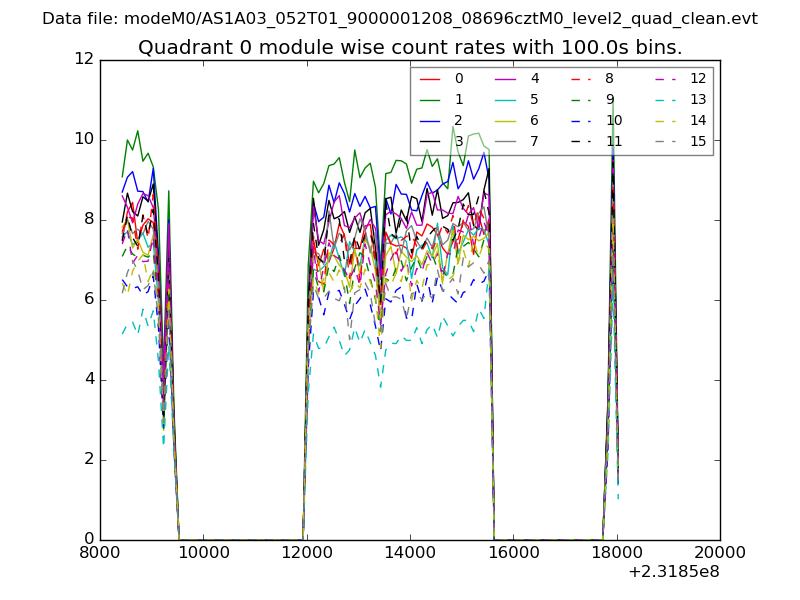
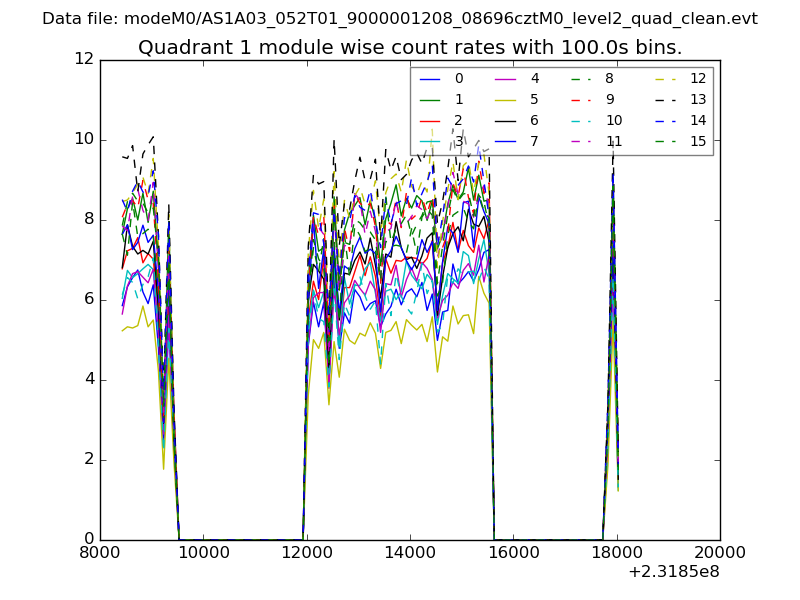
| Module-wise count rates for Quadrant A Data is divided into 100 sec bins |
 |
 |
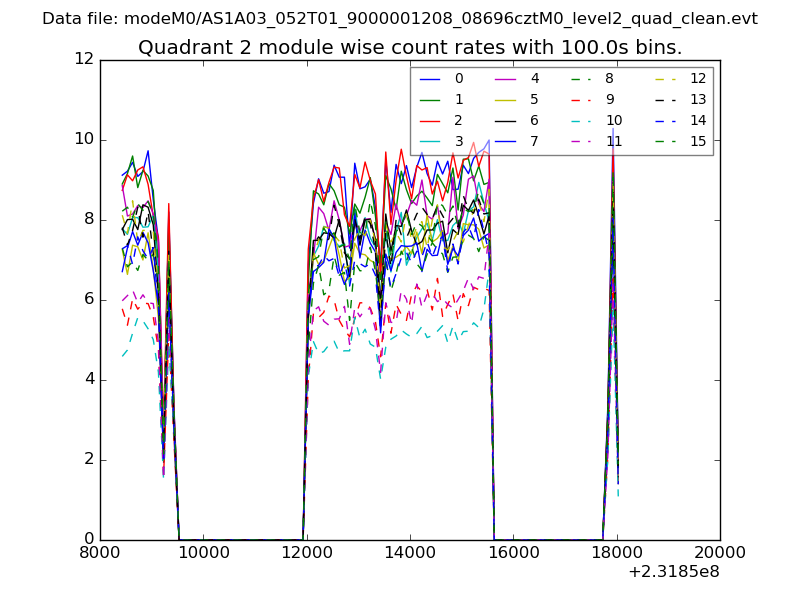
| Module-wise count rates for Quadrant B Data is divided into 100 sec bins |
 |
 |
| Module-wise count rates for Quadrant C Data is divided into 100 sec bins |
 |
 |
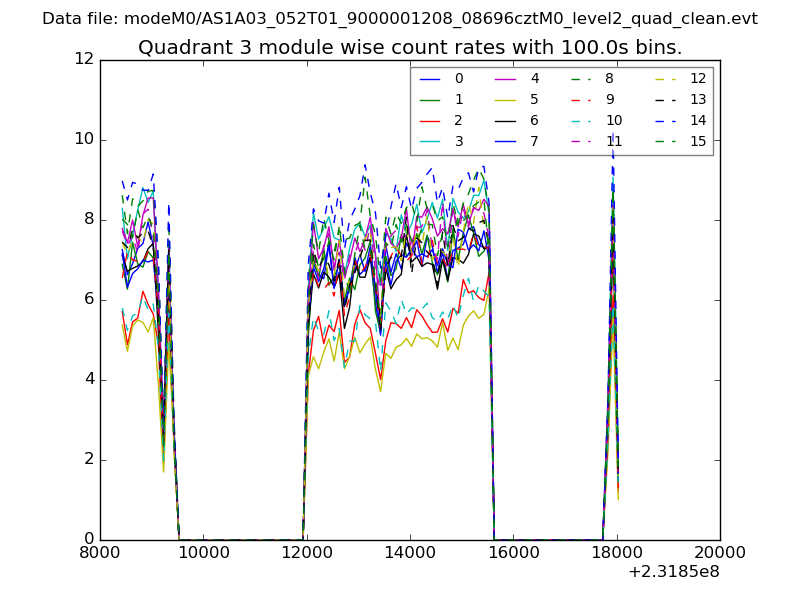
| Module-wise count rates for Quadrant D Data is divided into 100 sec bins |
 |
 |
| Parameter | Plot |
|---|---|
| CZT HV Monitor | 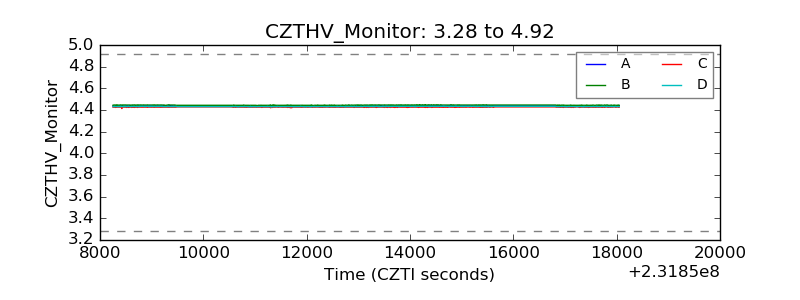 |
| D_VDD | 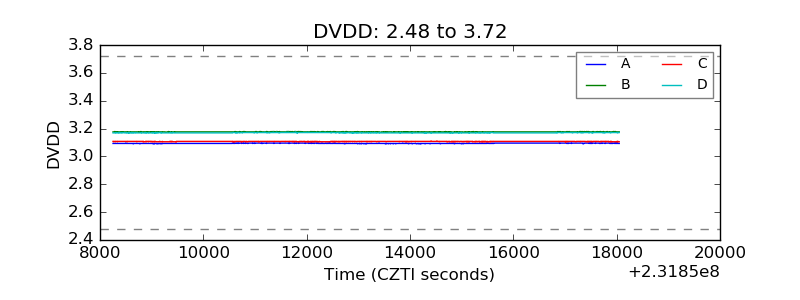 |
| Temperature 1 | 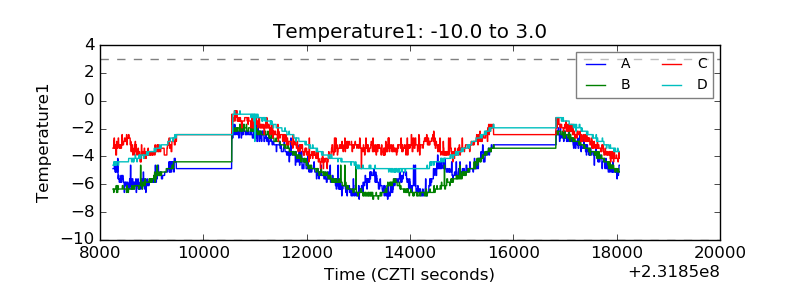 |
| Veto HV Monitor |  |
| Veto LLD | 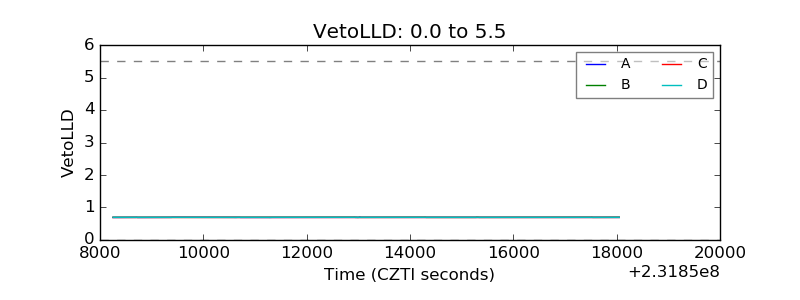 |
| Alpha Counter | 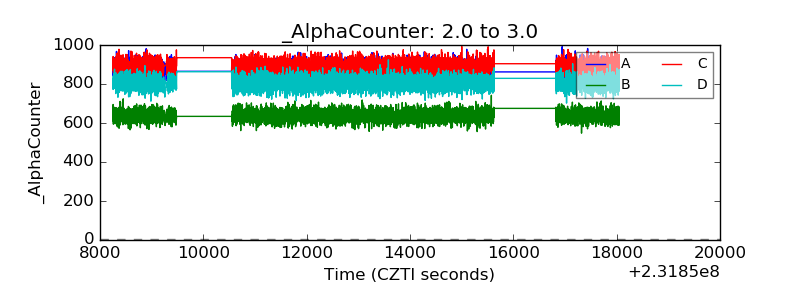 |
| _CPM_Rate | 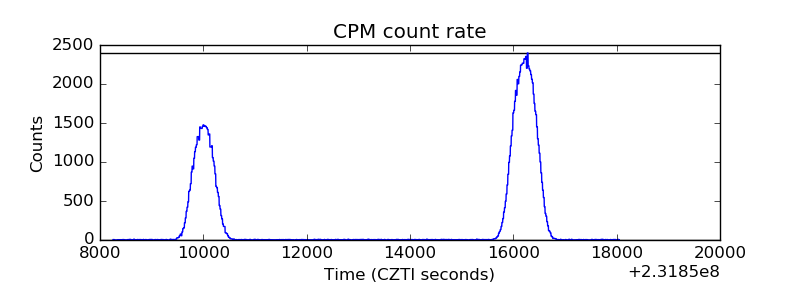 |
| CZT Counter | 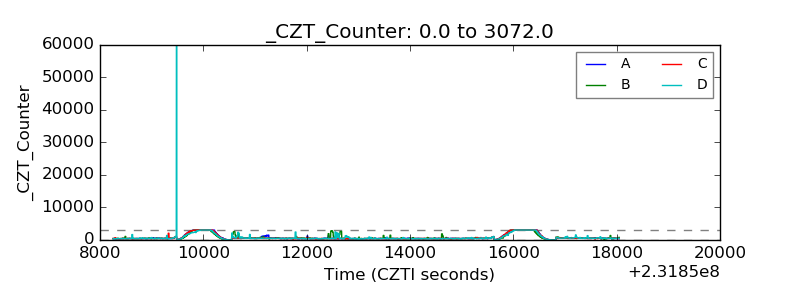 |
| +2.5 Volts monitor |  |
| +5 Volts monitor |  |
| _ROLL_ROT | 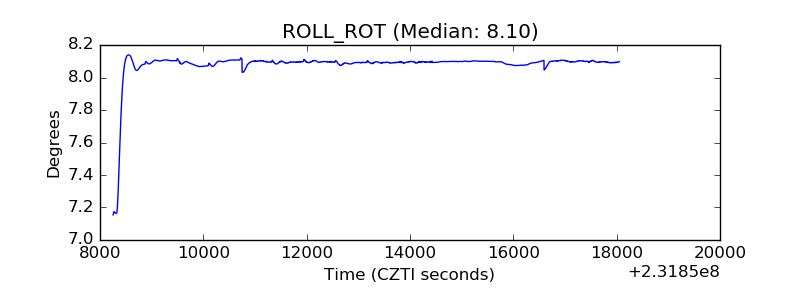 |
| _Roll_DEC | 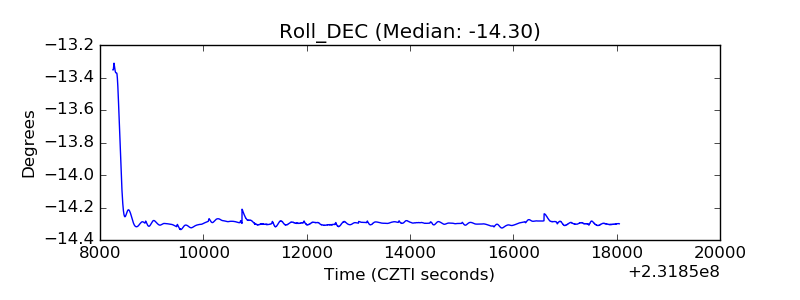 |
| _Roll_RA |  |
| Veto Counter | 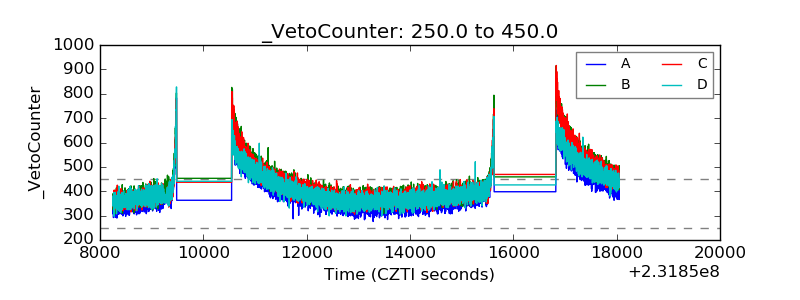 |