| Param | Original file | Final file |
|---|---|---|
| Filename | modeM0/AS1A03_052T01_9000001208_08697cztM0_level2.evt | modeM0/AS1A03_052T01_9000001208_08697cztM0_level2_quad_clean.evt |
| Size (bytes) | 112,844,160 | 21,559,680 |
| Size | 107.6 MB | 20.6 MB |
| Events in quadrant A | 802,778 | 134,440 |
| Events in quadrant B | 927,759 | 133,377 |
| Events in quadrant C | 799,252 | 138,927 |
| Events in quadrant D | 778,415 | 130,682 |
| Mode M9 | |||
|---|---|---|---|
| Quadrant | BADHDUFLAG | Total packets | Discarded packets |
| A | 0 | 17 | 2 |
| B | 0 | 17 | 4 |
| C | 0 | 17 | 4 |
| D | 0 | 18 | 3 |
| Mode SS | |||
|---|---|---|---|
| Quadrant | BADHDUFLAG | Total packets | Discarded packets |
| A | 0 | 126 | 84 |
| B | 0 | 128 | 94 |
| C | 0 | 126 | 93 |
| D | 0 | 124 | 79 |
| Mode M0 | |||
|---|---|---|---|
| Quadrant | BADHDUFLAG | Total packets | Discarded packets |
| A | 0 | 13296 | 9983 |
| B | 0 | 14454 | 10743 |
| C | 0 | 12972 | 9670 |
| D | 0 | 13946 | 10707 |
| Quadrant | Total seconds | Saturated seconds | Saturation percentage |
|---|---|---|---|
| A | 1529 | 12 | 0.784827% |
| B | 1494 | 47 | 3.145917% |
| C | 1562 | 7 | 0.448143% |
| D | 1498 | 6 | 0.400534% |
Noise dominated data is calculated using 1-second bins in cleaned event files. If a bin has >2000 counts, and if more than 50% of those come from <1% of pixels, then it is considered to be noise-dominated and hence unusable.
| Quadrant | # 1 sec bins | Bins with >0 counts | Bins with >2000 counts | High rate bins dominated by noise | Noise dominated (total time) | Noise dominated (detector-on time) | Marked lightcurve |
|---|---|---|---|---|---|---|---|
| A | 7392 | 2288 | 0 | 0 | 0.00% | 0.00% | 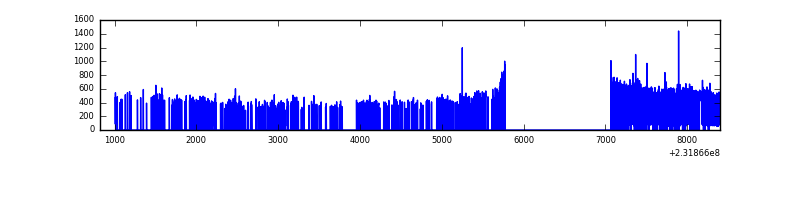 |
| B | 7437 | 2255 | 22 | 22 | 0.30% | 0.98% | 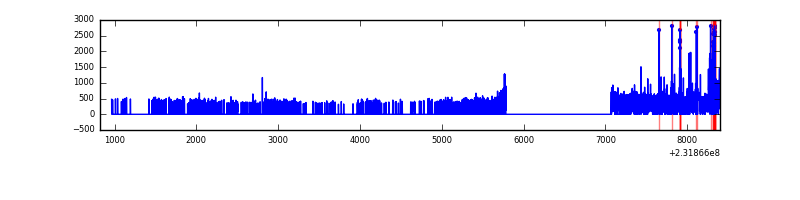 |
| C | 7579 | 2319 | 0 | 0 | 0.00% | 0.00% | 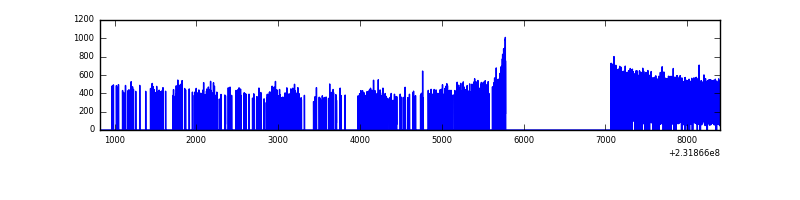 |
| D | 7543 | 2222 | 1 | 1 | 0.01% | 0.05% | 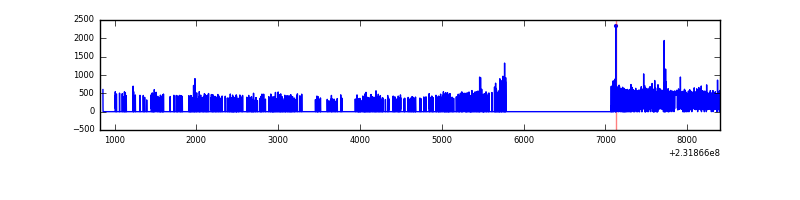 |
Top three noisy pixels from each quadrant. If the there are fewer than three noisy pixels in the level2.evt file, extra rows are filled as -1
| Pixel properties | Quadrant properties | ||||||
|---|---|---|---|---|---|---|---|
| Quadrant | DetID | PixID | Counts | Sigma | Mean | Median | Sigma |
| A | 13 | 251 | 22636 | 526.24 | 202 | 198 | 42.6 |
| A | 0 | 226 | 1864 | 39.07 | 202 | 198 | 42.6 |
| A | 12 | 194 | 1716 | 35.6 | 202 | 198 | 42.6 |
| B | 10 | 16 | 138076 | 3512.46 | 197 | 193 | 39.3 |
| B | 0 | 230 | 10022 | 250.39 | 197 | 193 | 39.3 |
| B | 4 | 48 | 7162 | 177.53 | 197 | 193 | 39.3 |
| C | 13 | 61 | 1482 | 25.78 | 204 | 205 | 49.5 |
| C | 8 | 222 | 940 | 14.84 | 204 | 205 | 49.5 |
| C | 12 | 4 | 781 | 11.63 | 204 | 205 | 49.5 |
| D | 1 | 52 | 13896 | 278.35 | 194 | 188 | 49.2 |
| D | 13 | 238 | 7097 | 140.29 | 194 | 188 | 49.2 |
| D | 13 | 105 | 6349 | 125.1 | 194 | 188 | 49.2 |
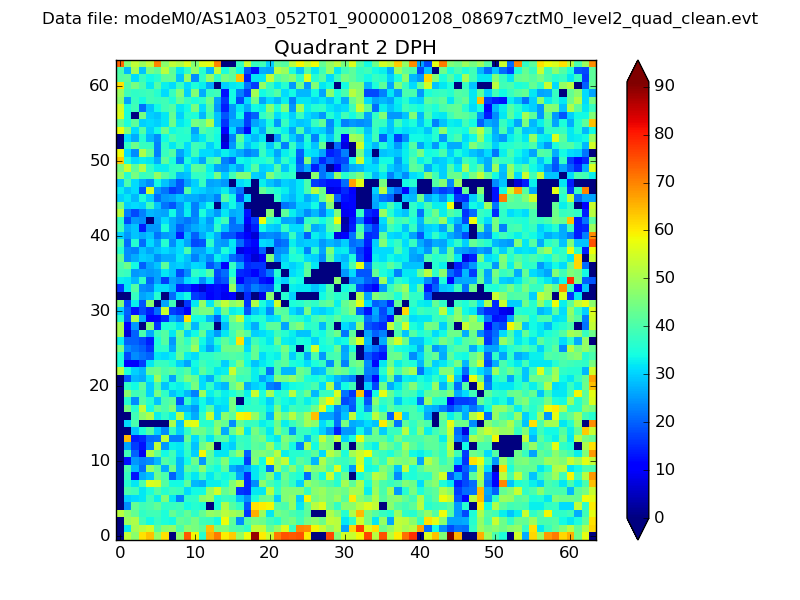
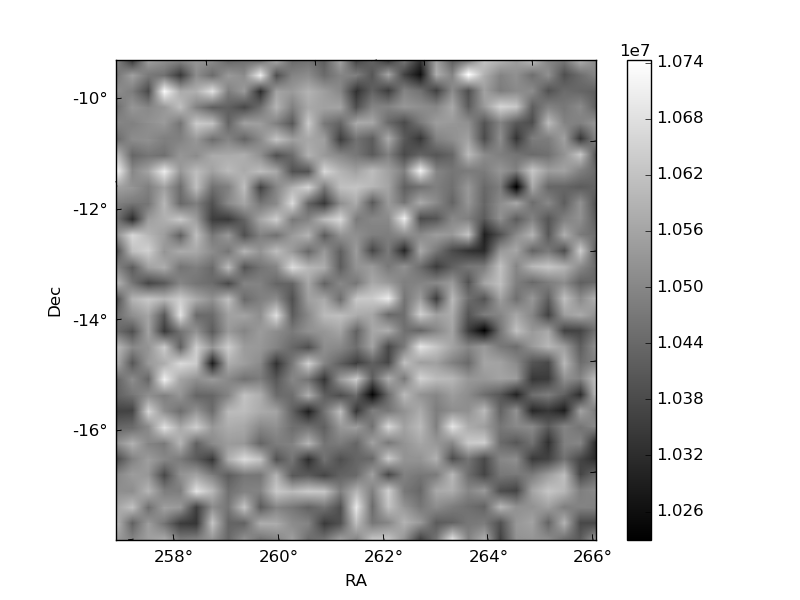
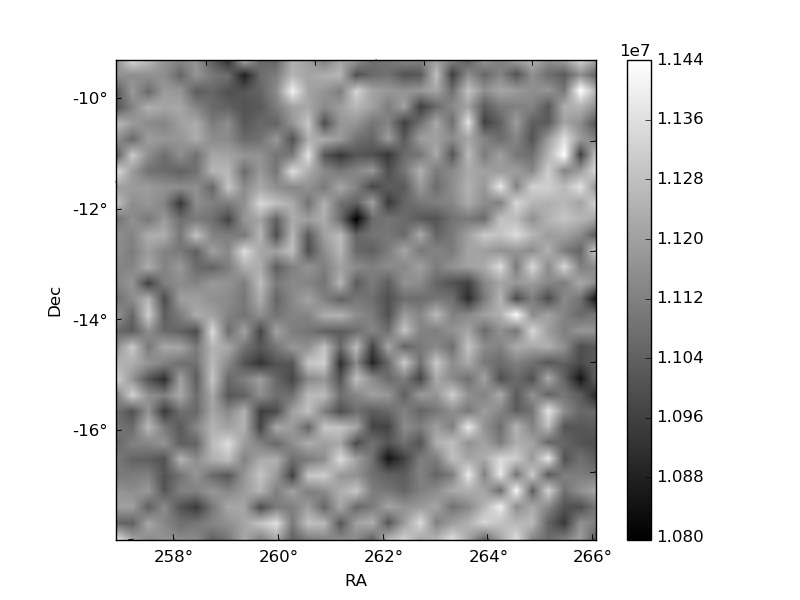
Histogram calculated using DETX and DETY for each event in the final _common_clean file
| Quadrant A | 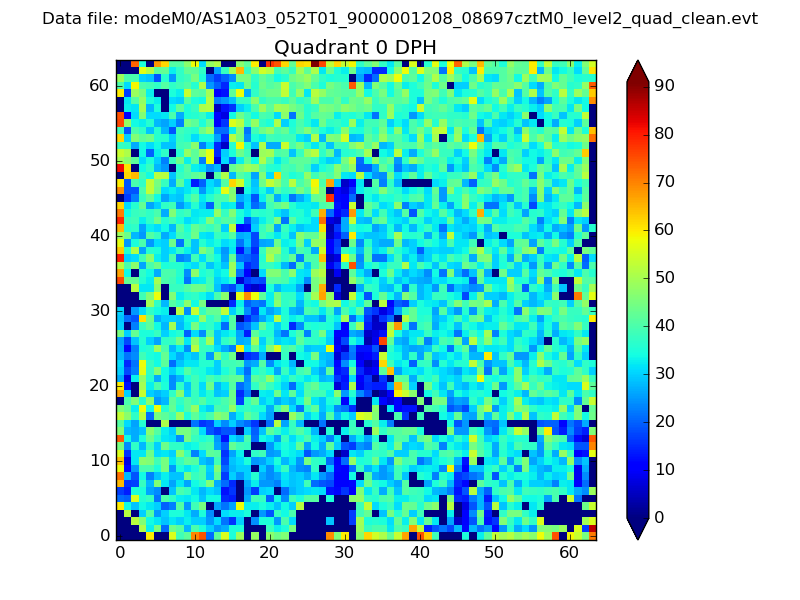 |
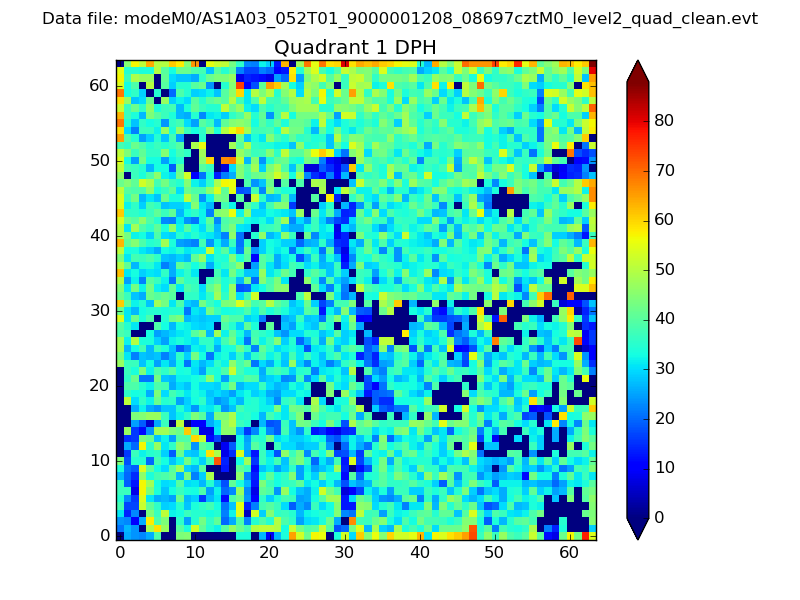 |
Quadrant B |
|---|---|---|---|
| Quadrant D | 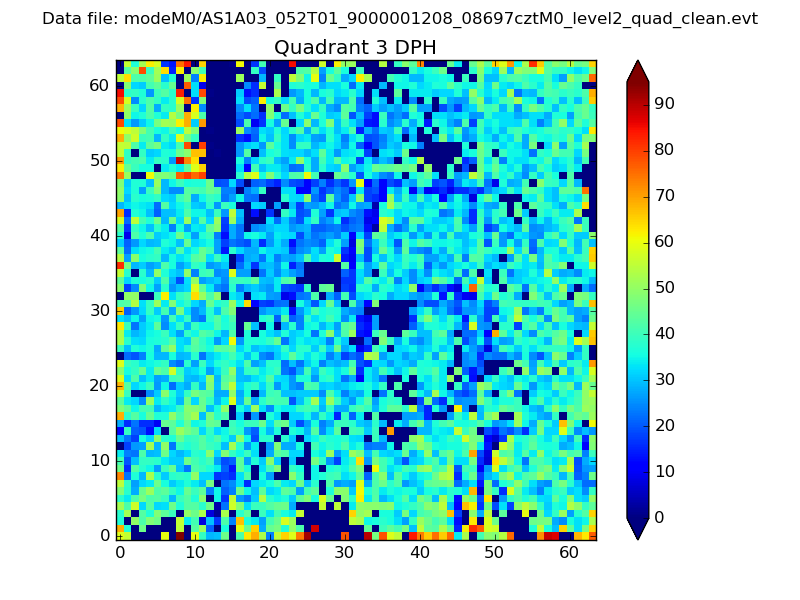 |
 |
Quadrant C |
| Plot type | Count rate plots | Images |
|---|---|---|
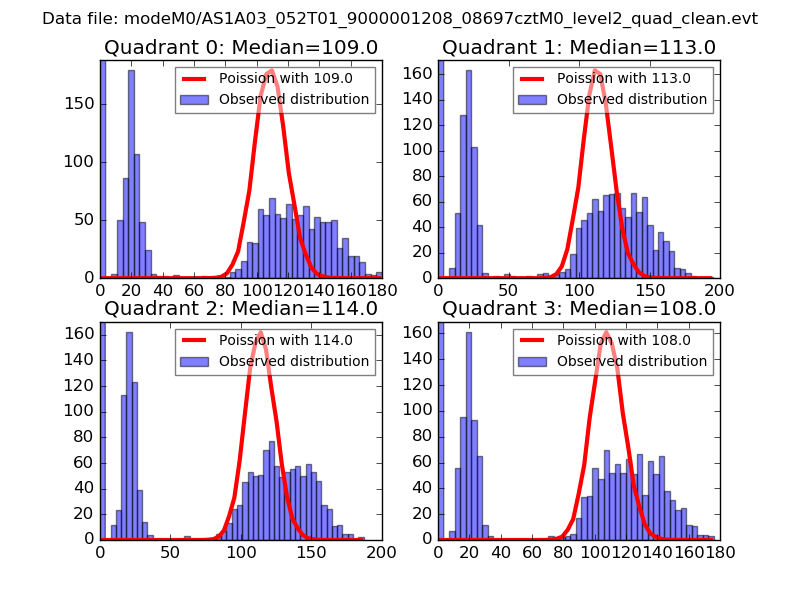
| Comparison with Poisson distribution Blue bars denote a histogram of data divided into 1 sec bins. Red curve is a Poisson curve with rate = median count rate of data. |
 |
 |
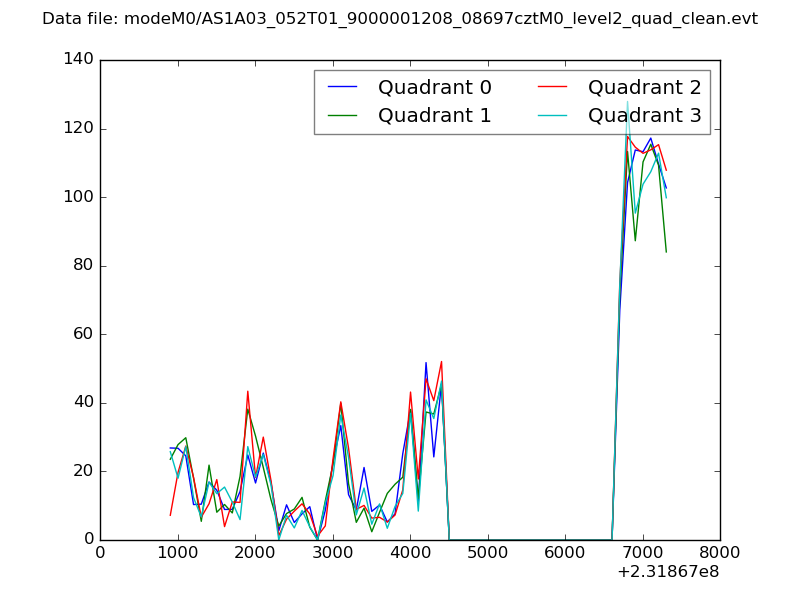
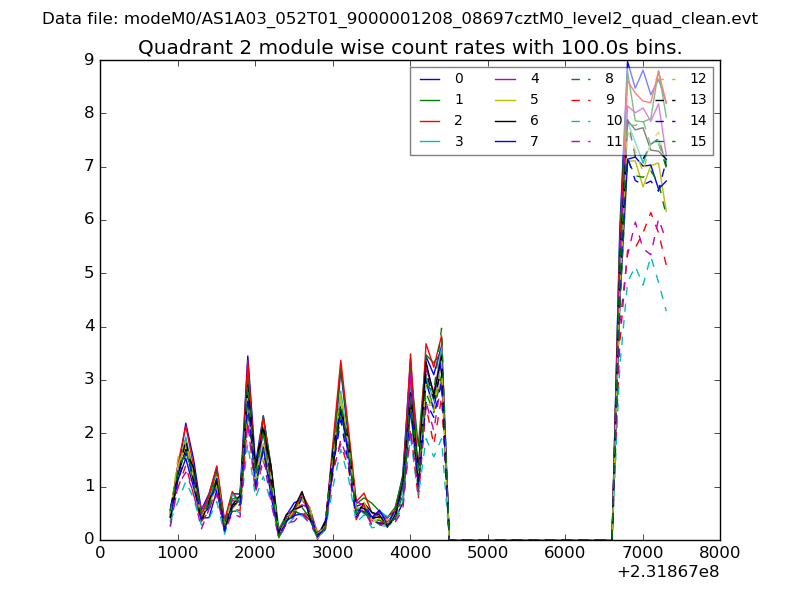
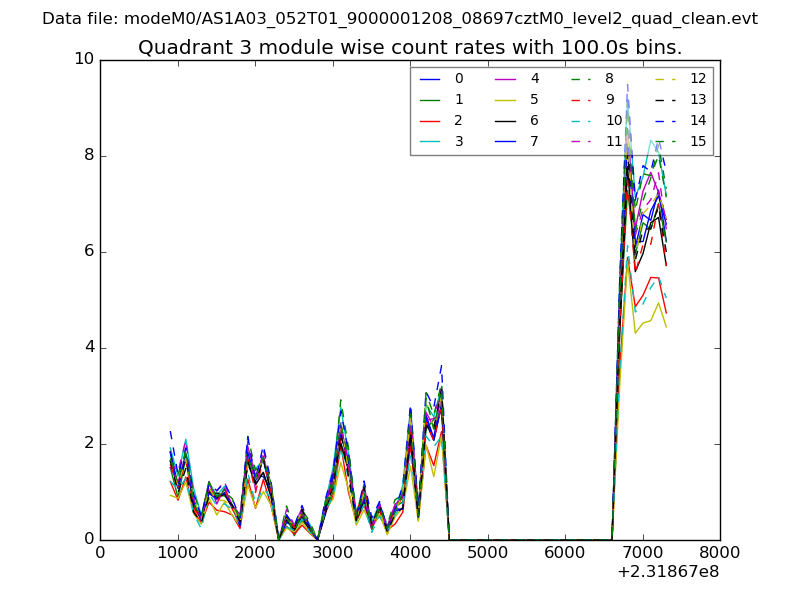
| Quadrant-wise count rates Data is divided into 100 sec bins |
 |
|
| Module-wise count rates for Quadrant A Data is divided into 100 sec bins |
 |
 |
| Module-wise count rates for Quadrant B Data is divided into 100 sec bins |
 |
 |
| Module-wise count rates for Quadrant C Data is divided into 100 sec bins |
 |
 |
| Module-wise count rates for Quadrant D Data is divided into 100 sec bins |
 |
 |
| Parameter | Plot |
|---|---|
| CZT HV Monitor | 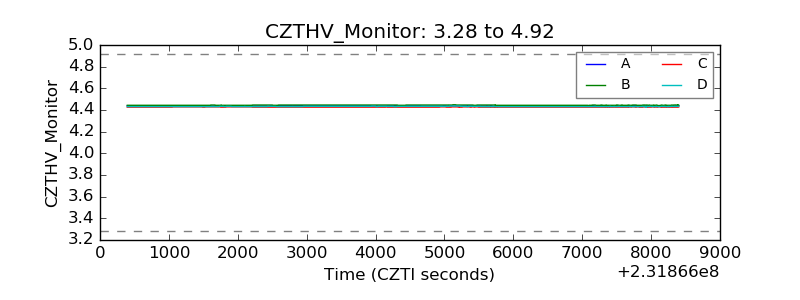 |
| D_VDD | 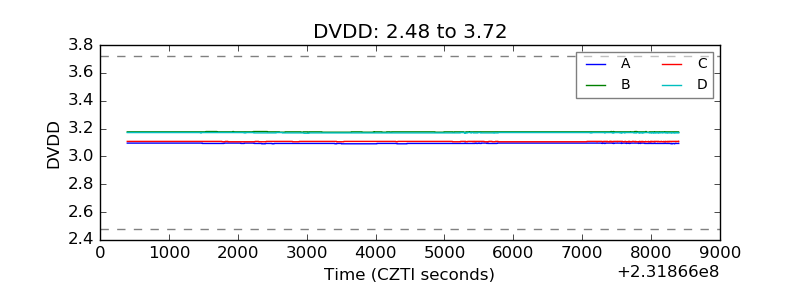 |
| Temperature 1 | 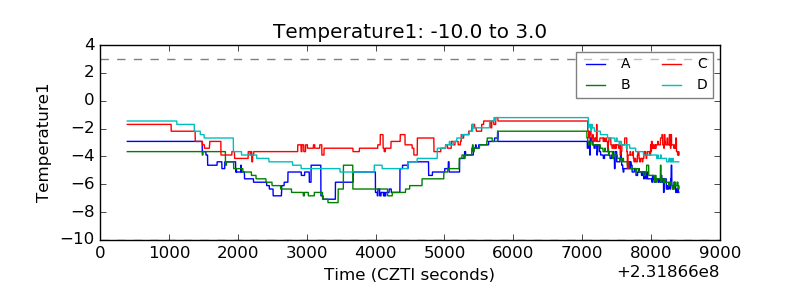 |
| Veto HV Monitor |  |
| Veto LLD | 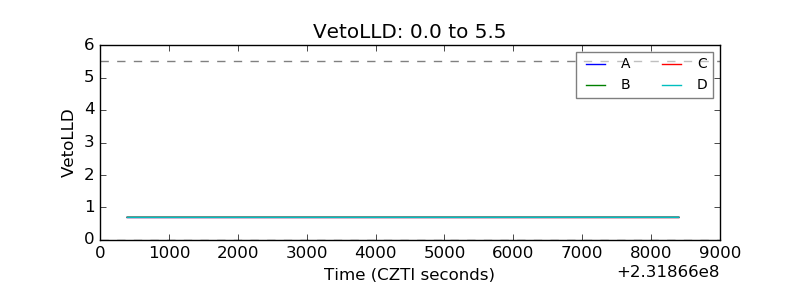 |
| Alpha Counter | 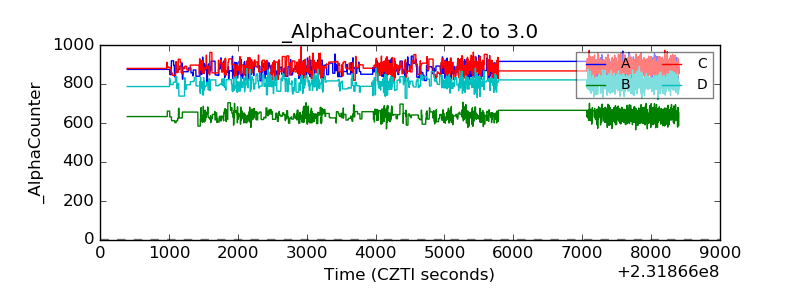 |
| _CPM_Rate | 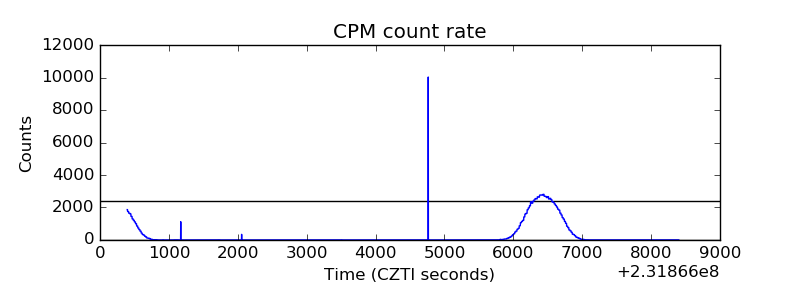 |
| CZT Counter | 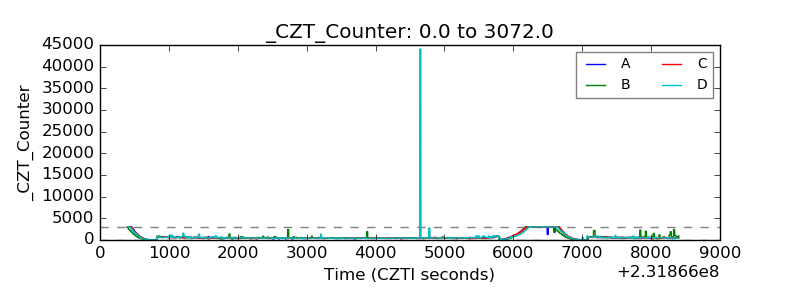 |
| +2.5 Volts monitor |  |
| +5 Volts monitor |  |
| _ROLL_ROT | 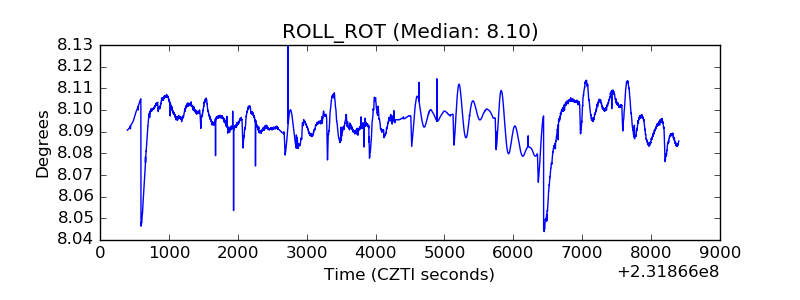 |
| _Roll_DEC | 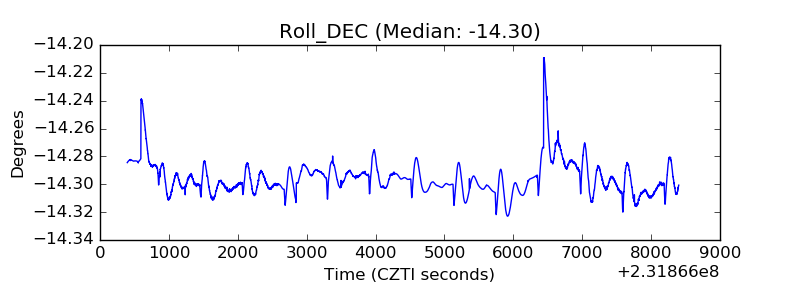 |
| _Roll_RA | 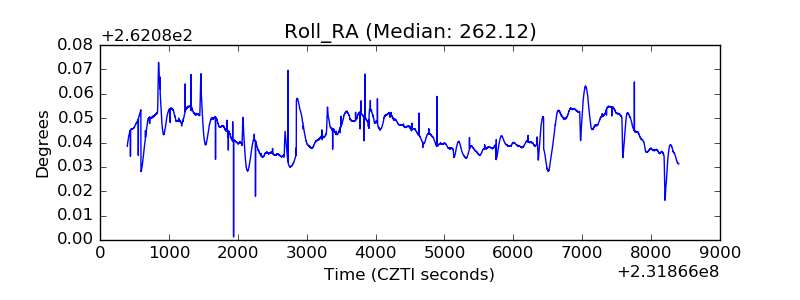 |
| Veto Counter | 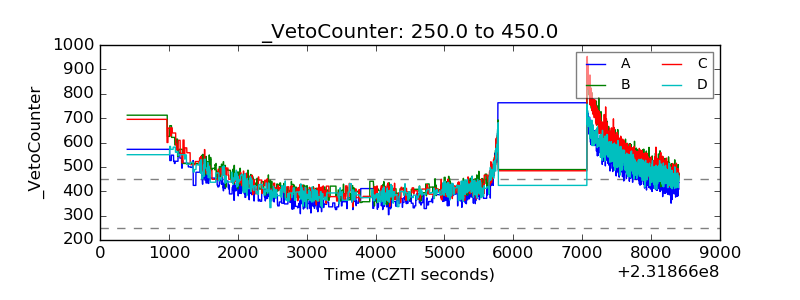 |