| Param | Original file | Final file |
|---|---|---|
| Filename | modeM0/AS1A03_052T01_9000001208_08698cztM0_level2.evt | modeM0/AS1A03_052T01_9000001208_08698cztM0_level2_quad_clean.evt |
| Size (bytes) | 372,162,240 | 80,994,240 |
| Size | 354.9 MB | 77.2 MB |
| Events in quadrant A | 2,636,635 | 522,805 |
| Events in quadrant B | 2,814,377 | 530,010 |
| Events in quadrant C | 2,582,774 | 536,757 |
| Events in quadrant D | 2,882,611 | 498,856 |
| Mode M9 | |||
|---|---|---|---|
| Quadrant | BADHDUFLAG | Total packets | Discarded packets |
| A | 0 | 24 | 1 |
| B | 0 | 24 | 1 |
| C | 0 | 24 | 1 |
| D | 0 | 25 | 1 |
| Mode SS | |||
|---|---|---|---|
| Quadrant | BADHDUFLAG | Total packets | Discarded packets |
| A | 0 | 124 | 18 |
| B | 0 | 124 | 16 |
| C | 0 | 124 | 12 |
| D | 0 | 124 | 14 |
| Mode M0 | |||
|---|---|---|---|
| Quadrant | BADHDUFLAG | Total packets | Discarded packets |
| A | 0 | 13073 | 1958 |
| B | 0 | 14409 | 2699 |
| C | 0 | 12779 | 1887 |
| D | 0 | 14130 | 2183 |
| Quadrant | Total seconds | Saturated seconds | Saturation percentage |
|---|---|---|---|
| A | 5212 | 59 | 1.132003% |
| B | 5133 | 104 | 2.026106% |
| C | 5215 | 34 | 0.651965% |
| D | 5148 | 73 | 1.418026% |
Noise dominated data is calculated using 1-second bins in cleaned event files. If a bin has >2000 counts, and if more than 50% of those come from <1% of pixels, then it is considered to be noise-dominated and hence unusable.
| Quadrant | # 1 sec bins | Bins with >0 counts | Bins with >2000 counts | High rate bins dominated by noise | Noise dominated (total time) | Noise dominated (detector-on time) | Marked lightcurve |
|---|---|---|---|---|---|---|---|
| A | 7447 | 5736 | 3 | 3 | 0.04% | 0.05% | 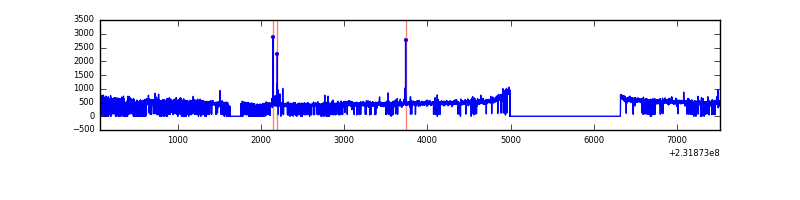 |
| B | 7447 | 5658 | 23 | 23 | 0.31% | 0.41% | 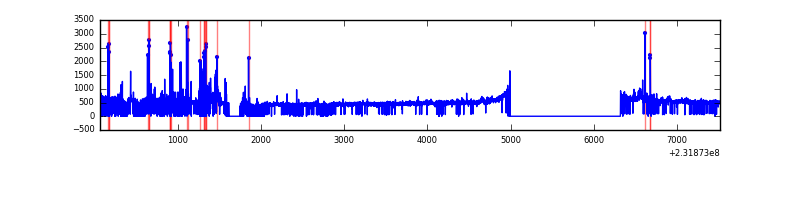 |
| C | 7445 | 5729 | 0 | 0 | 0.00% | 0.00% | 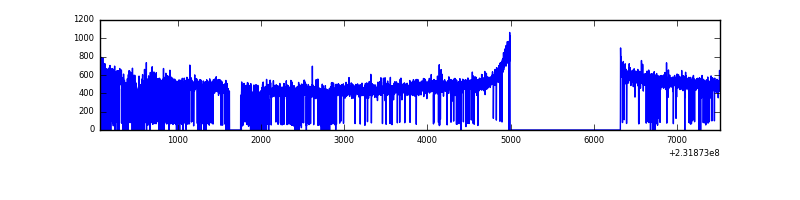 |
| D | 7447 | 5697 | 38 | 38 | 0.51% | 0.67% | 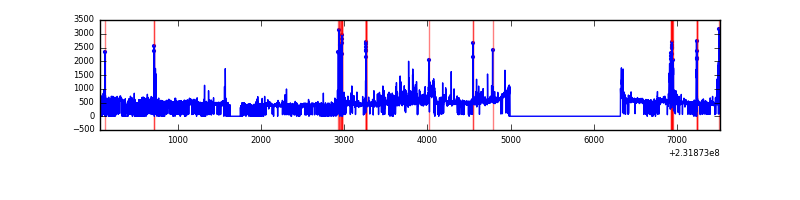 |
Top three noisy pixels from each quadrant. If the there are fewer than three noisy pixels in the level2.evt file, extra rows are filled as -1
| Pixel properties | Quadrant properties | ||||||
|---|---|---|---|---|---|---|---|
| Quadrant | DetID | PixID | Counts | Sigma | Mean | Median | Sigma |
| A | 13 | 251 | 49972 | 365.34 | 664 | 651 | 135.0 |
| A | 13 | 248 | 25148 | 181.46 | 664 | 651 | 135.0 |
| A | 0 | 226 | 6307 | 41.9 | 664 | 651 | 135.0 |
| B | 10 | 16 | 174004 | 1378.74 | 665 | 650 | 125.7 |
| B | 0 | 230 | 24081 | 186.35 | 665 | 650 | 125.7 |
| B | 4 | 173 | 14394 | 109.31 | 665 | 650 | 125.7 |
| C | 13 | 61 | 4909 | 27.63 | 661 | 666 | 153.6 |
| C | 8 | 222 | 3928 | 21.24 | 661 | 666 | 153.6 |
| C | 14 | 67 | 2047 | 8.99 | 661 | 666 | 153.6 |
| D | 2 | 152 | 200680 | 1160.55 | 640 | 626 | 172.4 |
| D | 1 | 52 | 112676 | 650.03 | 640 | 626 | 172.4 |
| D | 9 | 64 | 27440 | 155.55 | 640 | 626 | 172.4 |
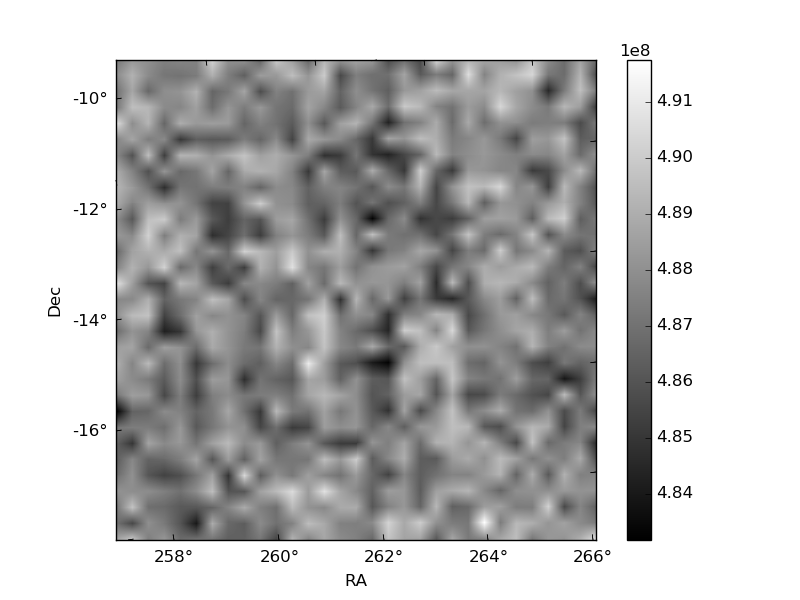
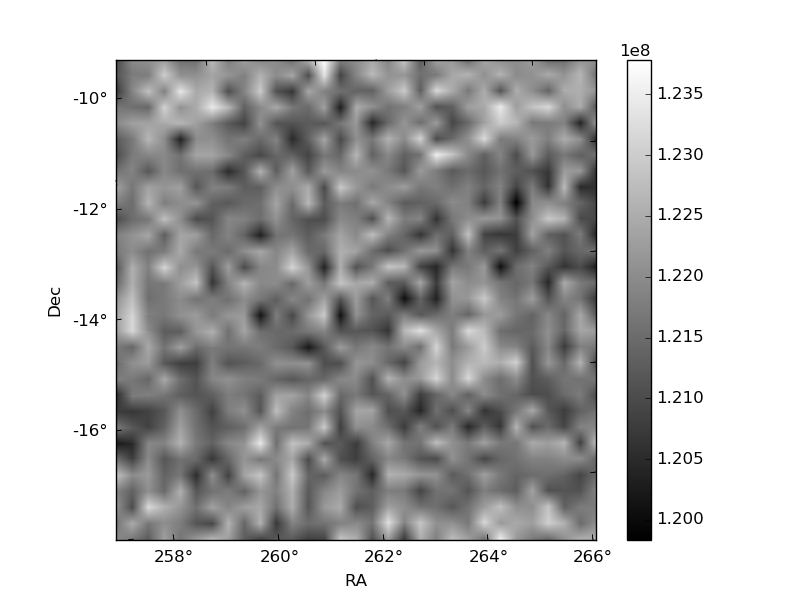
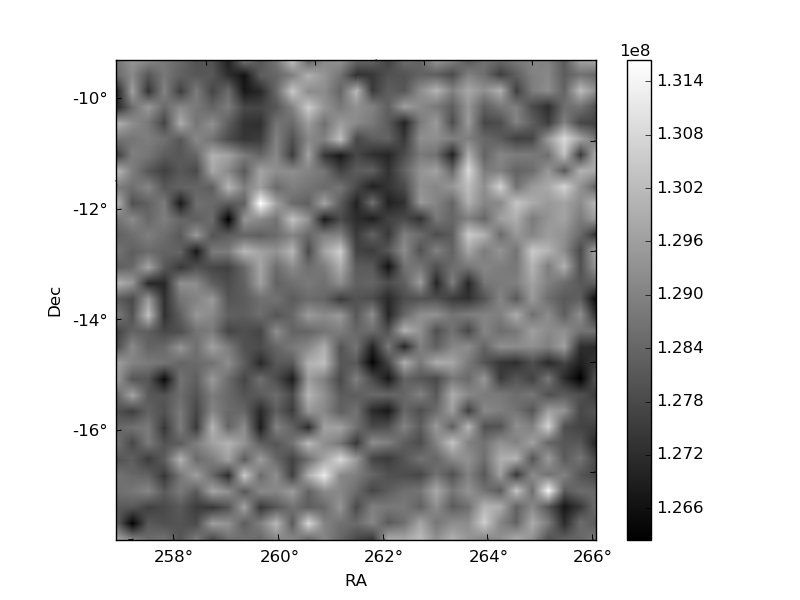
Histogram calculated using DETX and DETY for each event in the final _common_clean file
| Quadrant A | 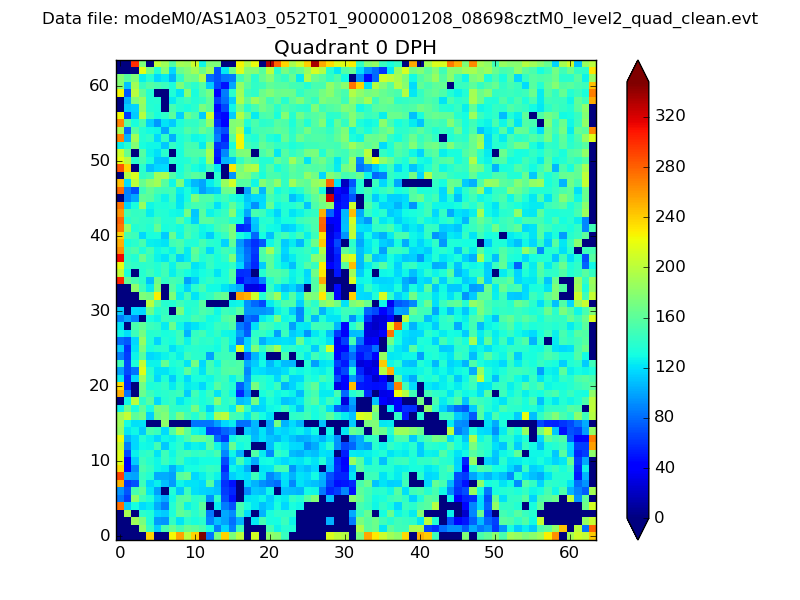 |
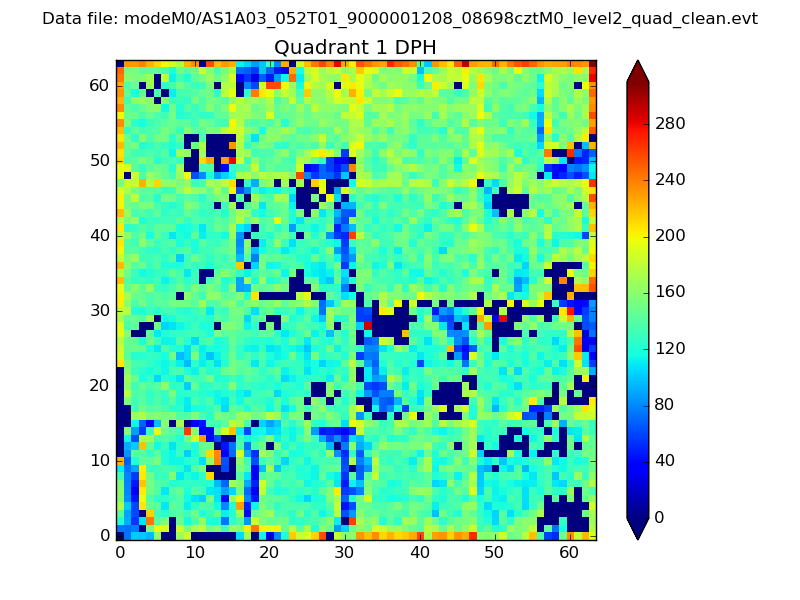 |
Quadrant B |
|---|---|---|---|
| Quadrant D | 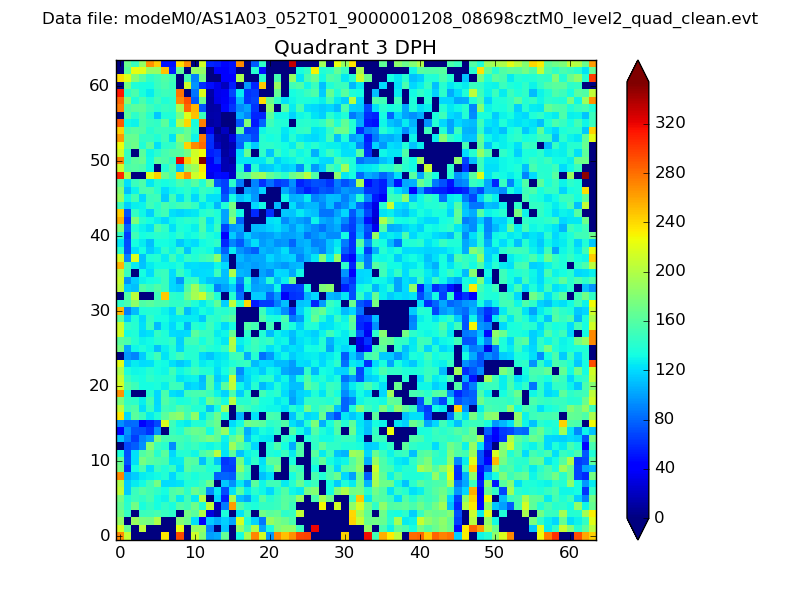 |
 |
Quadrant C |
| Plot type | Count rate plots | Images |
|---|---|---|
| Comparison with Poisson distribution Blue bars denote a histogram of data divided into 1 sec bins. Red curve is a Poisson curve with rate = median count rate of data. |
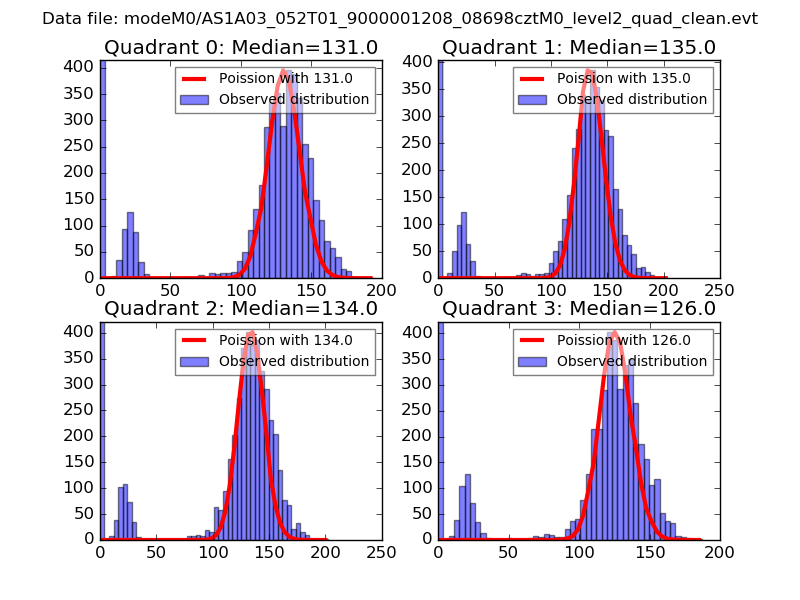 |
 |
| Quadrant-wise count rates Data is divided into 100 sec bins |
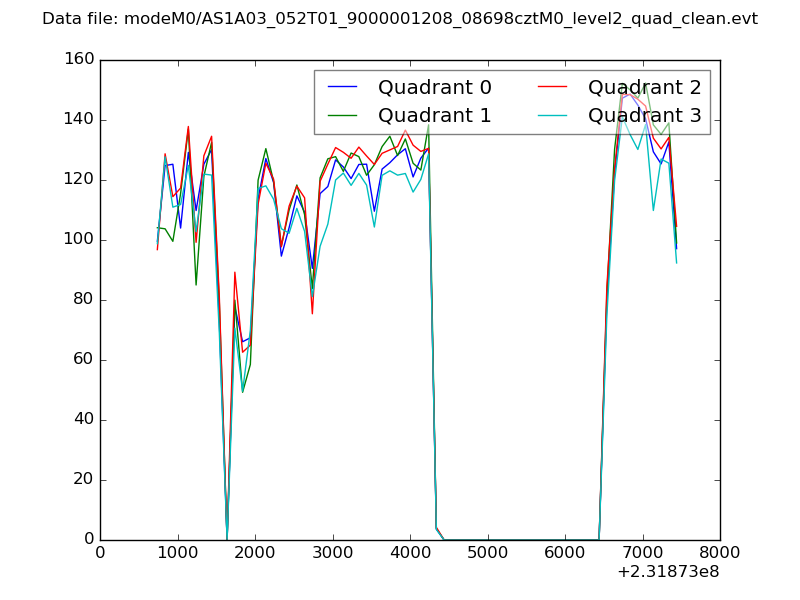 |
|
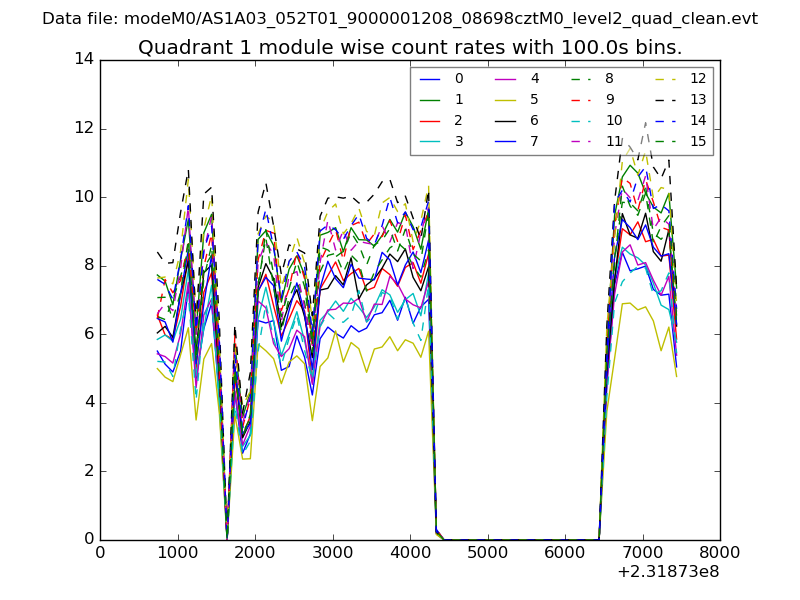
| Module-wise count rates for Quadrant A Data is divided into 100 sec bins |
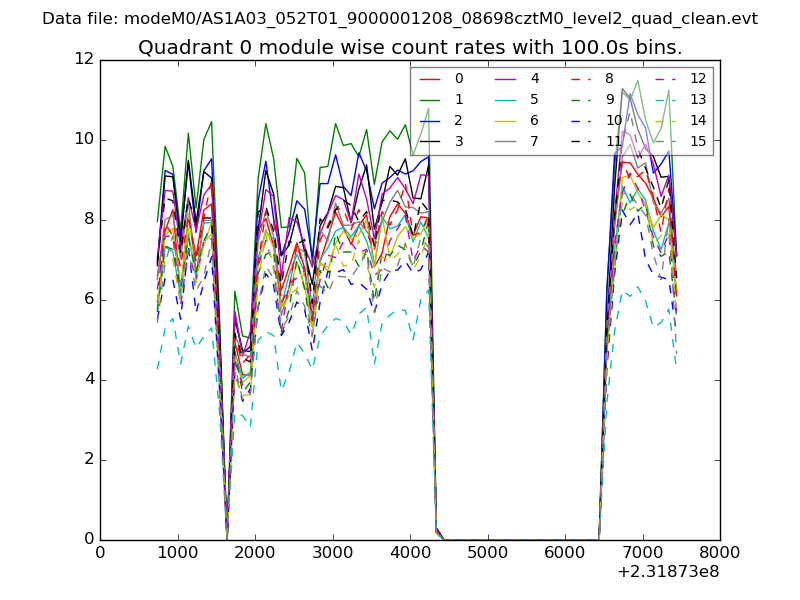 |
 |
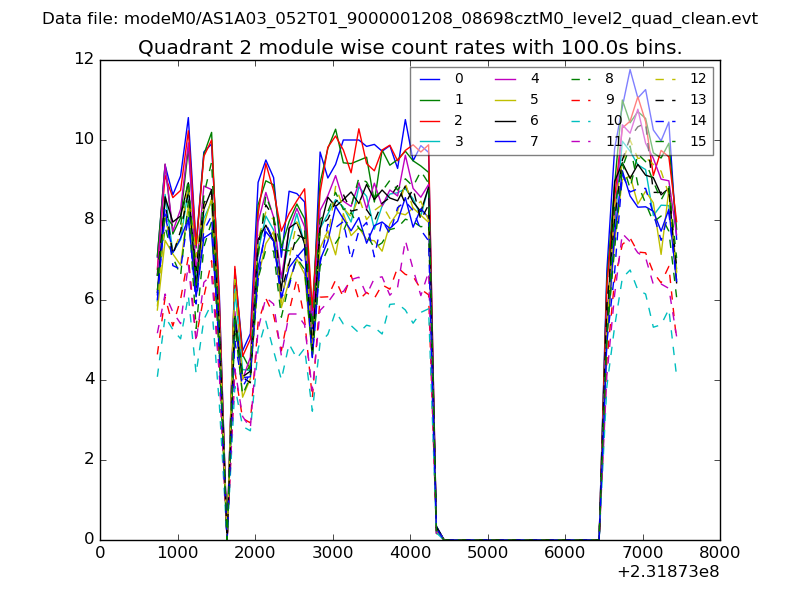
| Module-wise count rates for Quadrant B Data is divided into 100 sec bins |
 |
 |
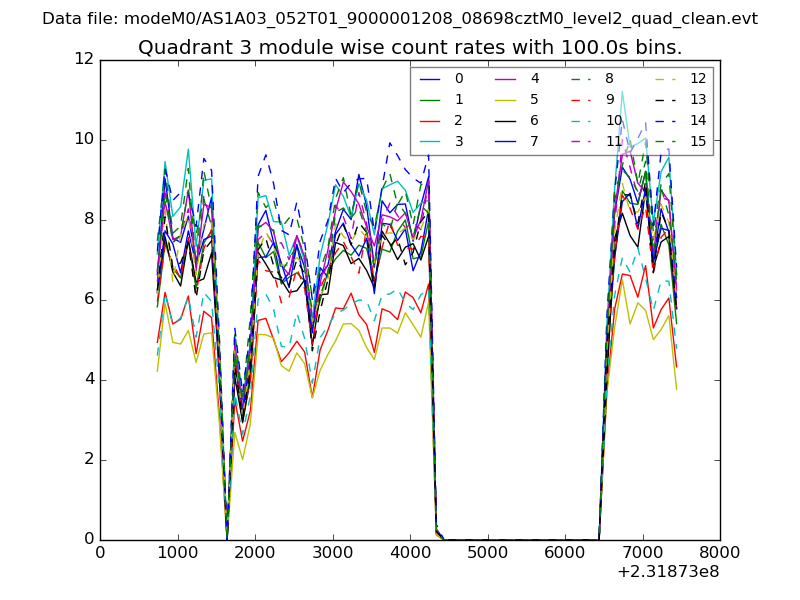
| Module-wise count rates for Quadrant C Data is divided into 100 sec bins |
 |
 |
| Module-wise count rates for Quadrant D Data is divided into 100 sec bins |
 |
 |
| Parameter | Plot |
|---|---|
| CZT HV Monitor | 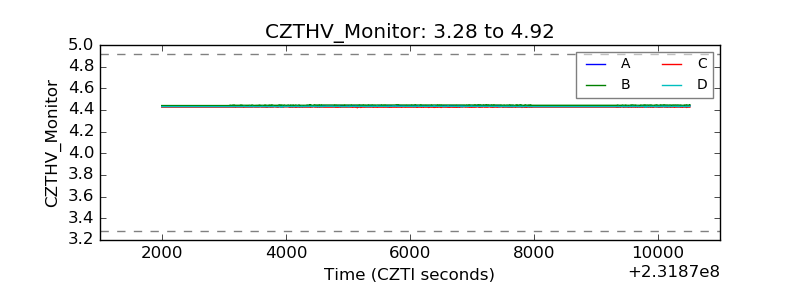 |
| D_VDD | 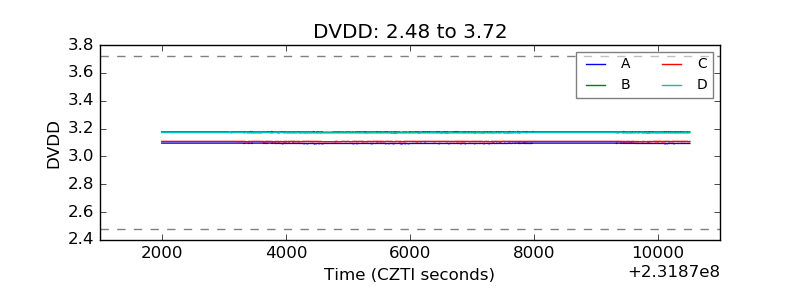 |
| Temperature 1 | 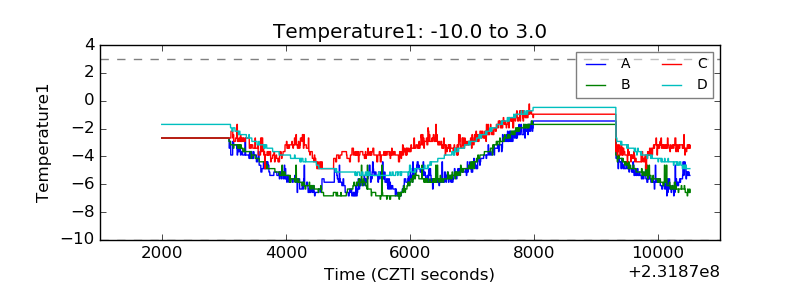 |
| Veto HV Monitor | 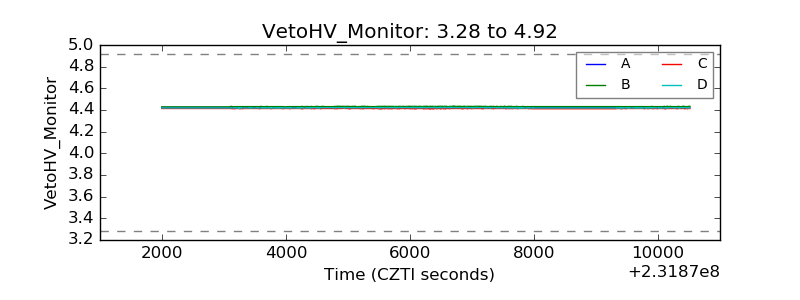 |
| Veto LLD | 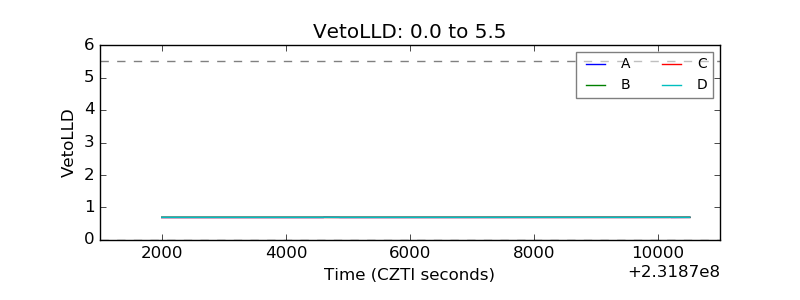 |
| Alpha Counter | 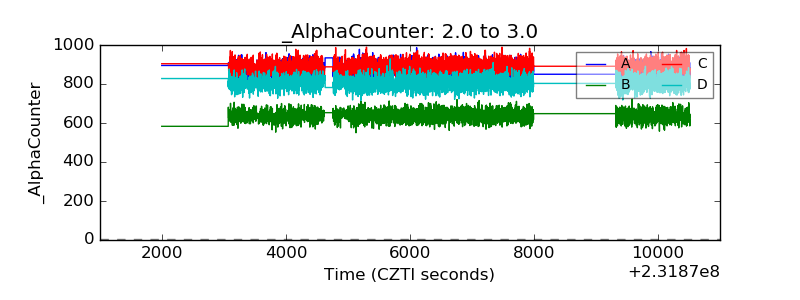 |
| _CPM_Rate | 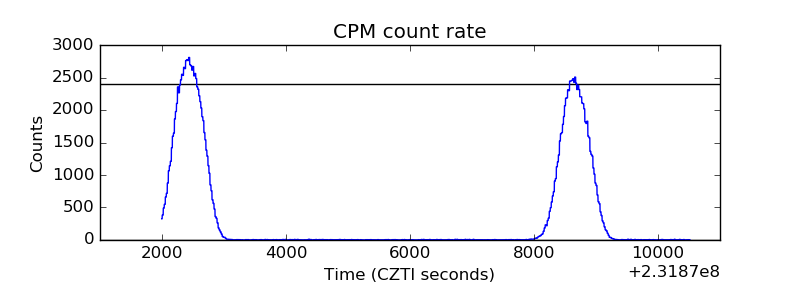 |
| CZT Counter |  |
| +2.5 Volts monitor |  |
| +5 Volts monitor |  |
| _ROLL_ROT | 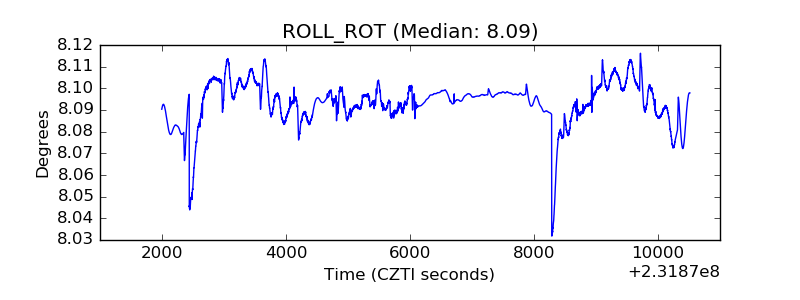 |
| _Roll_DEC | 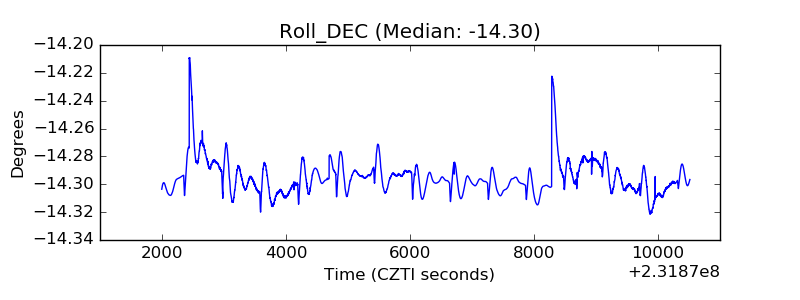 |
| _Roll_RA |  |
| Veto Counter | 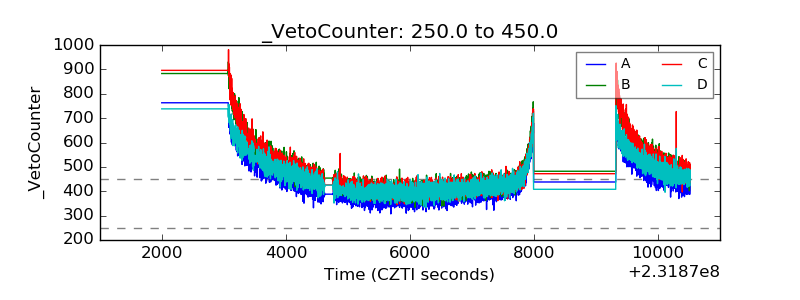 |