| Param | Original file | Final file |
|---|---|---|
| Filename | modeM0/AS1A03_052T01_9000001208_08699cztM0_level2.evt | modeM0/AS1A03_052T01_9000001208_08699cztM0_level2_quad_clean.evt |
| Size (bytes) | 438,168,960 | 100,540,800 |
| Size | 417.9 MB | 95.9 MB |
| Events in quadrant A | 3,123,012 | 642,755 |
| Events in quadrant B | 3,253,885 | 670,123 |
| Events in quadrant C | 3,142,549 | 664,948 |
| Events in quadrant D | 3,323,543 | 628,805 |
| Mode M9 | |||
|---|---|---|---|
| Quadrant | BADHDUFLAG | Total packets | Discarded packets |
| A | 0 | 27 | 0 |
| B | 0 | 27 | 0 |
| C | 0 | 27 | 0 |
| D | 0 | 27 | 0 |
| Mode SS | |||
|---|---|---|---|
| Quadrant | BADHDUFLAG | Total packets | Discarded packets |
| A | 0 | 128 | 0 |
| B | 0 | 128 | 0 |
| C | 0 | 128 | 0 |
| D | 0 | 128 | 0 |
| Mode M0 | |||
|---|---|---|---|
| Quadrant | BADHDUFLAG | Total packets | Discarded packets |
| A | 0 | 13353 | 3 |
| B | 0 | 13743 | 2 |
| C | 0 | 13282 | 4 |
| D | 0 | 14132 | 2 |
| Quadrant | Total seconds | Saturated seconds | Saturation percentage |
|---|---|---|---|
| A | 6286 | 75 | 1.193128% |
| B | 6286 | 120 | 1.909004% |
| C | 6285 | 45 | 0.715990% |
| D | 6286 | 78 | 1.240853% |
Noise dominated data is calculated using 1-second bins in cleaned event files. If a bin has >2000 counts, and if more than 50% of those come from <1% of pixels, then it is considered to be noise-dominated and hence unusable.
| Quadrant | # 1 sec bins | Bins with >0 counts | Bins with >2000 counts | High rate bins dominated by noise | Noise dominated (total time) | Noise dominated (detector-on time) | Marked lightcurve |
|---|---|---|---|---|---|---|---|
| A | 8931 | 6287 | 2 | 2 | 0.02% | 0.03% | 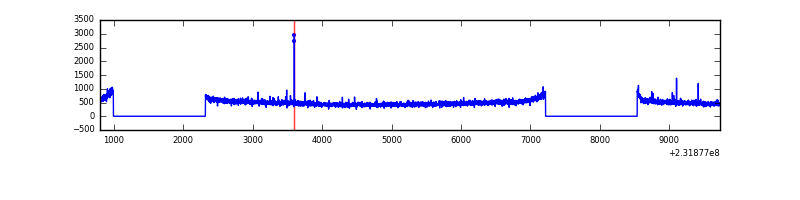 |
| B | 8931 | 6286 | 3 | 3 | 0.03% | 0.05% | 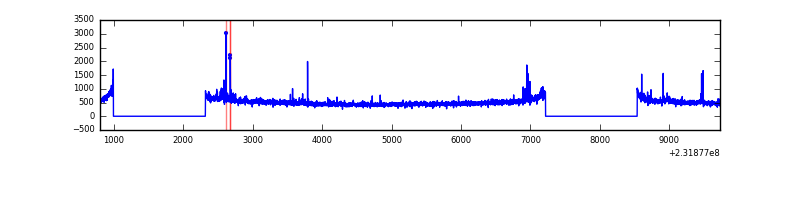 |
| C | 8931 | 6287 | 0 | 0 | 0.00% | 0.00% | 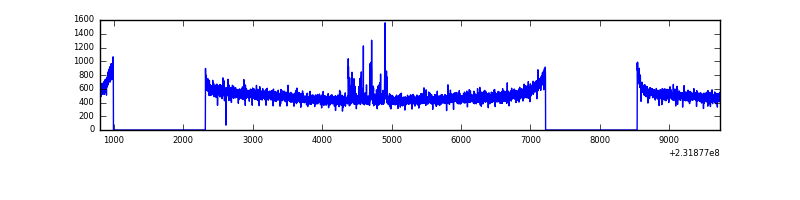 |
| D | 8931 | 6288 | 35 | 35 | 0.39% | 0.56% | 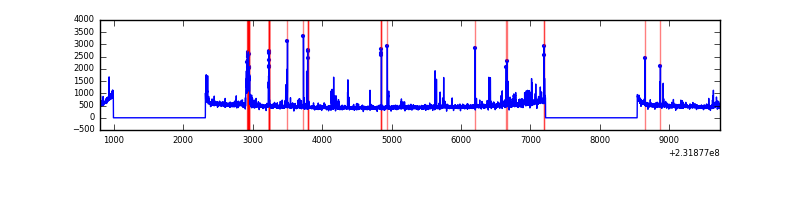 |
Top three noisy pixels from each quadrant. If the there are fewer than three noisy pixels in the level2.evt file, extra rows are filled as -1
| Pixel properties | Quadrant properties | ||||||
|---|---|---|---|---|---|---|---|
| Quadrant | DetID | PixID | Counts | Sigma | Mean | Median | Sigma |
| A | 13 | 251 | 40180 | 243.7 | 796 | 779 | 161.7 |
| A | 5 | 16 | 16497 | 97.22 | 796 | 779 | 161.7 |
| A | 0 | 226 | 7358 | 40.69 | 796 | 779 | 161.7 |
| B | 10 | 16 | 37593 | 240.32 | 812 | 794 | 153.1 |
| B | 4 | 173 | 18853 | 117.93 | 812 | 794 | 153.1 |
| B | 0 | 230 | 15831 | 98.2 | 812 | 794 | 153.1 |
| C | 14 | 234 | 46027 | 246.66 | 793 | 798 | 183.4 |
| C | 13 | 61 | 5999 | 28.36 | 793 | 798 | 183.4 |
| C | 8 | 222 | 4018 | 17.56 | 793 | 798 | 183.4 |
| D | 1 | 52 | 175816 | 842.18 | 777 | 761 | 207.9 |
| D | 2 | 152 | 44206 | 209.01 | 777 | 761 | 207.9 |
| D | 9 | 64 | 31813 | 149.39 | 777 | 761 | 207.9 |
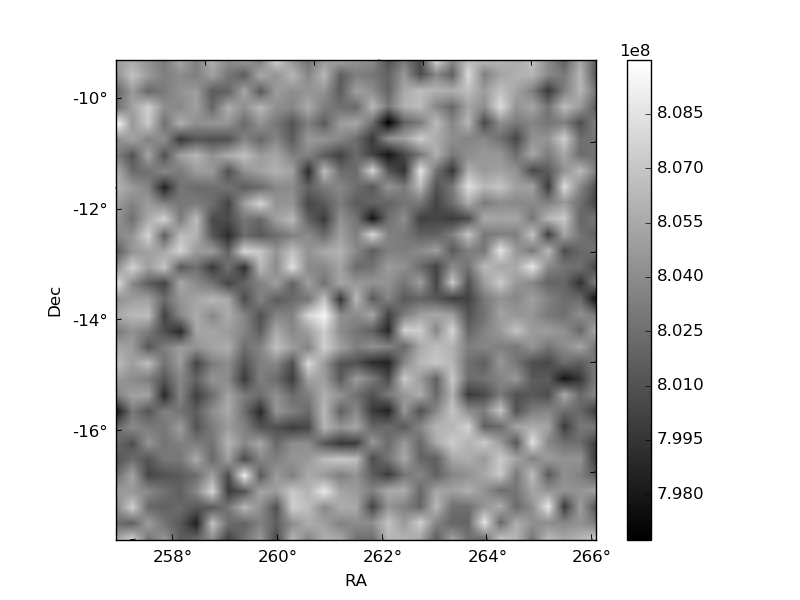
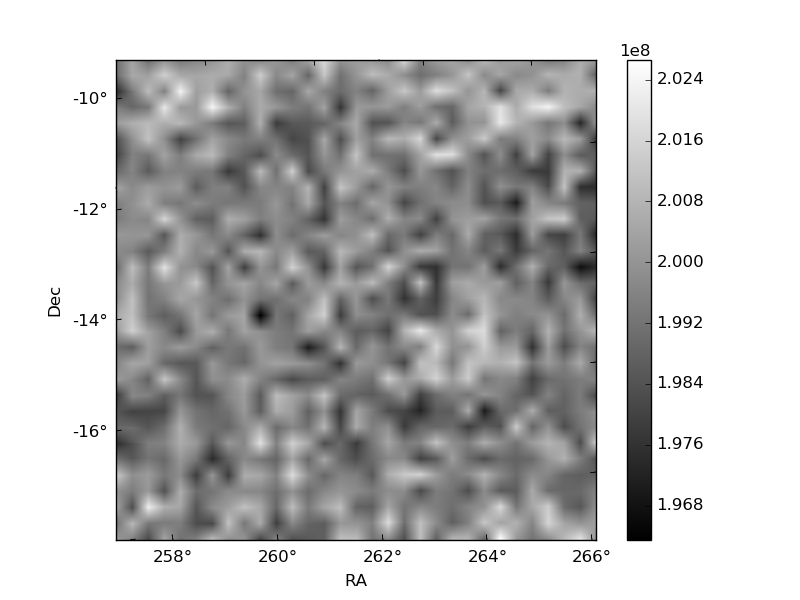
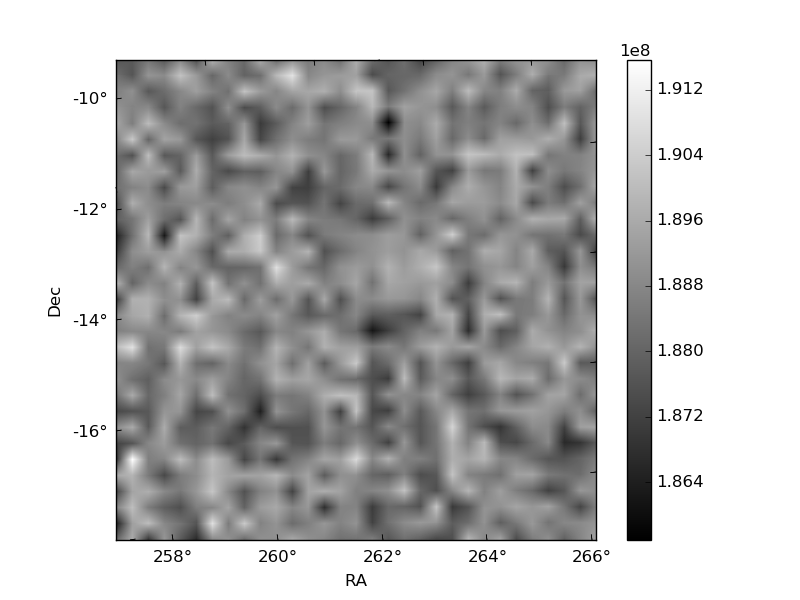
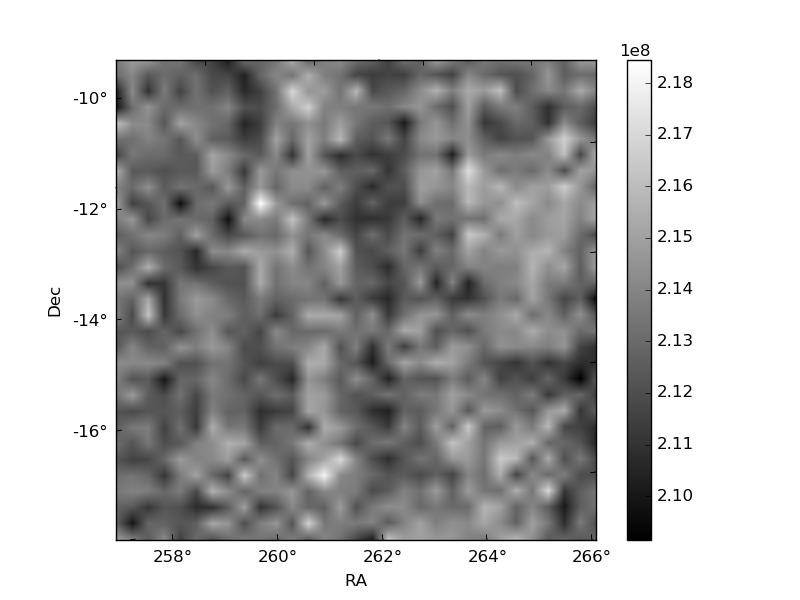
Histogram calculated using DETX and DETY for each event in the final _common_clean file
| Quadrant A | 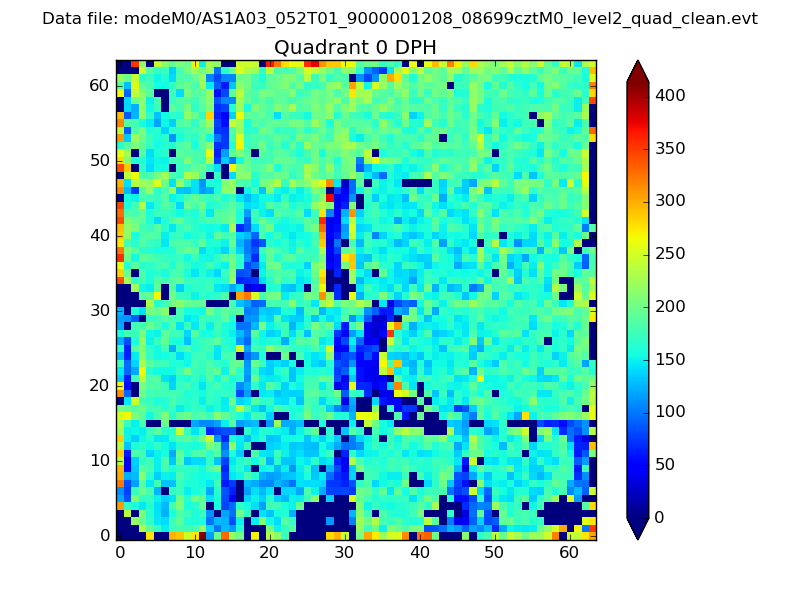 |
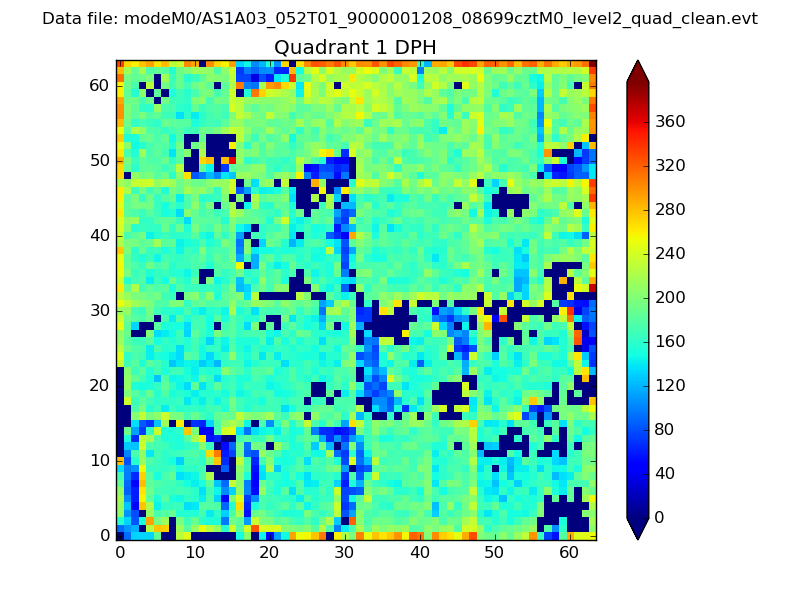 |
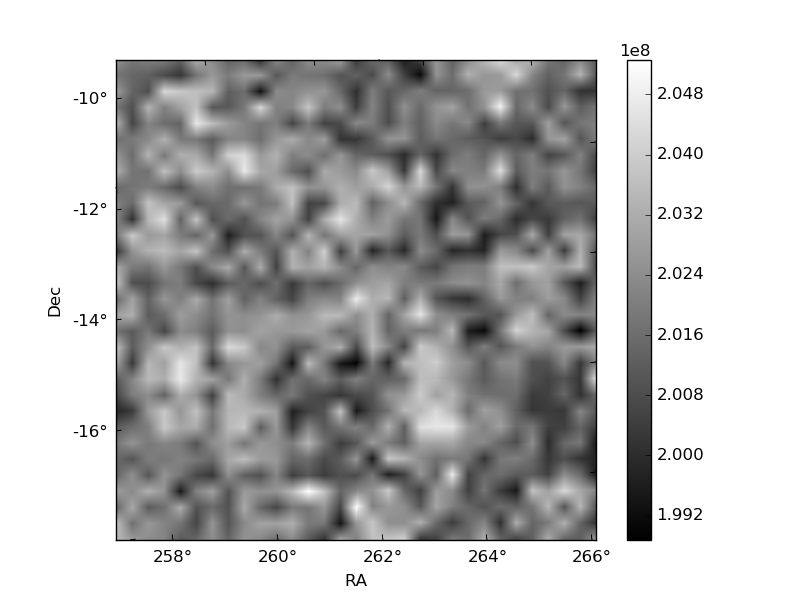
Quadrant B |
|---|---|---|---|
| Quadrant D | 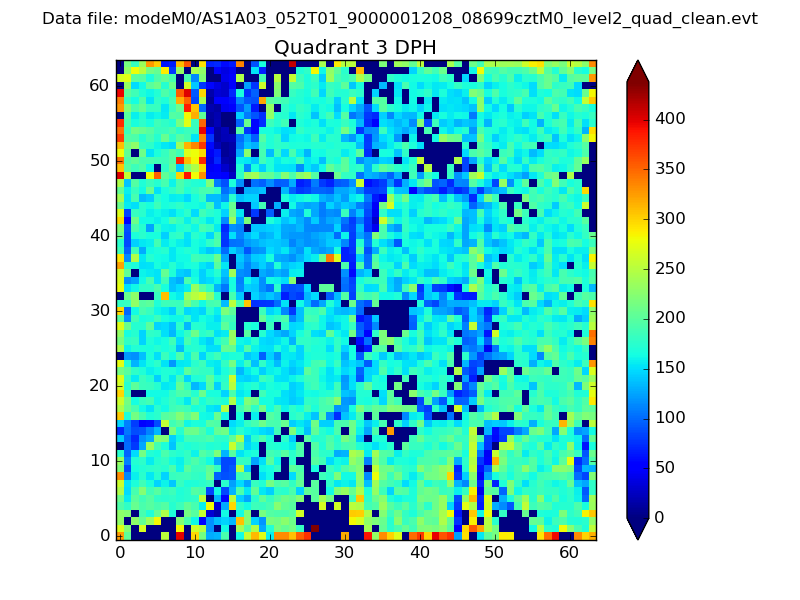 |
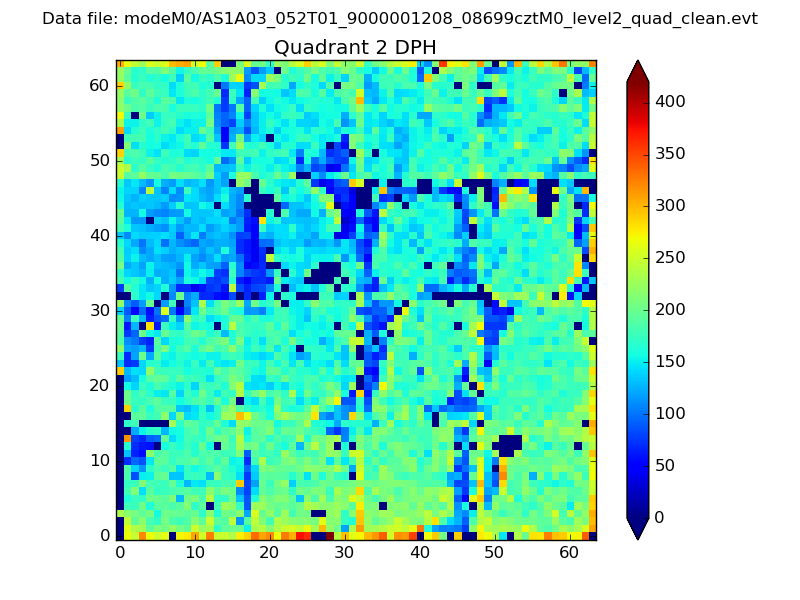 |
Quadrant C |
| Plot type | Count rate plots | Images |
|---|---|---|
| Comparison with Poisson distribution Blue bars denote a histogram of data divided into 1 sec bins. Red curve is a Poisson curve with rate = median count rate of data. |
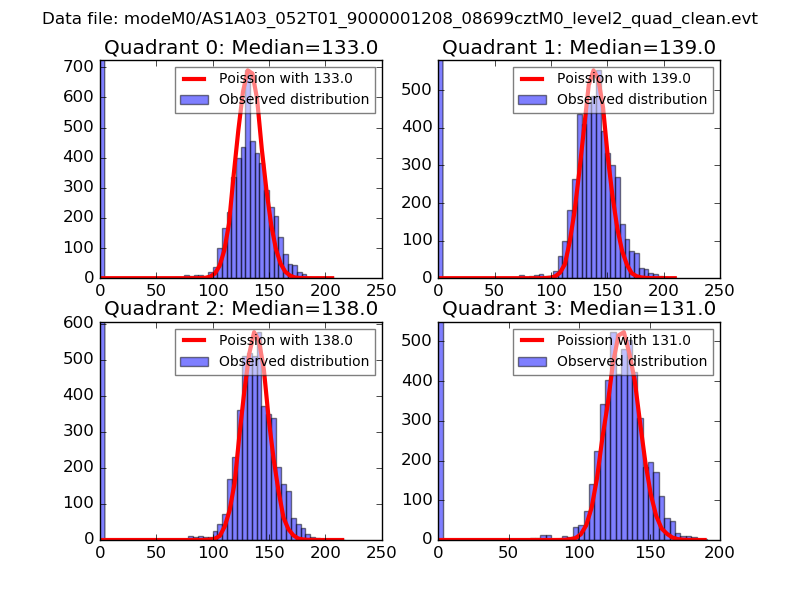 |
 |
| Quadrant-wise count rates Data is divided into 100 sec bins |
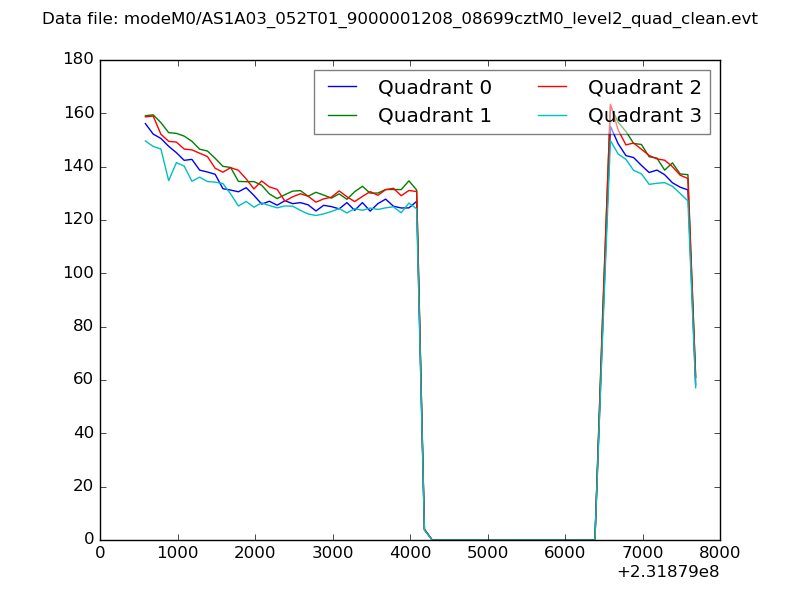 |
|
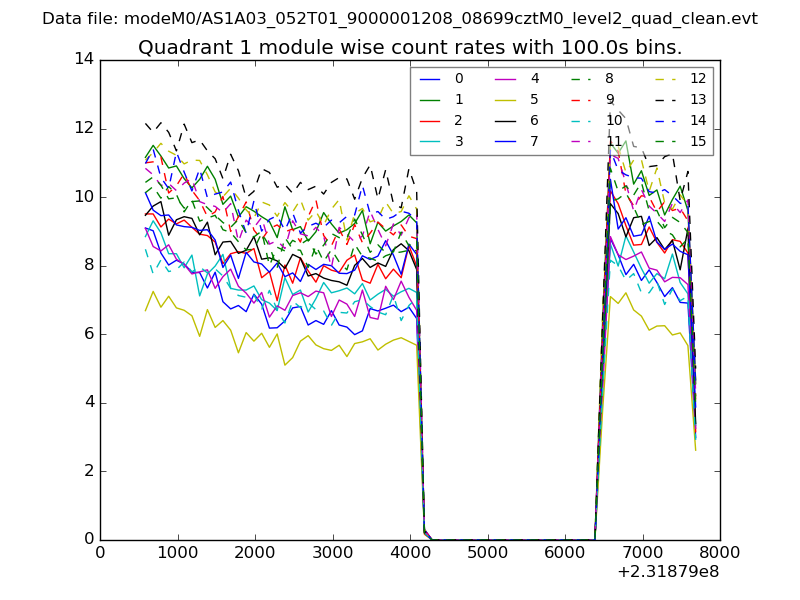
| Module-wise count rates for Quadrant A Data is divided into 100 sec bins |
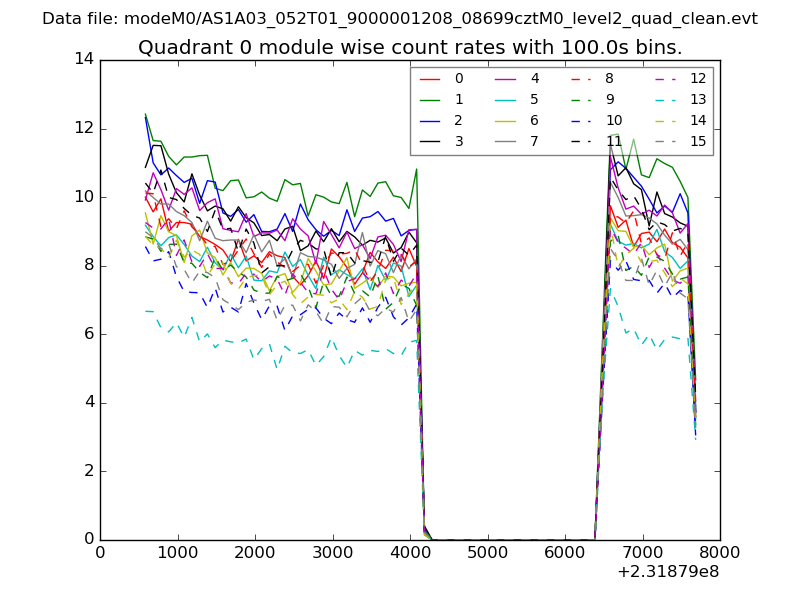 |
 |
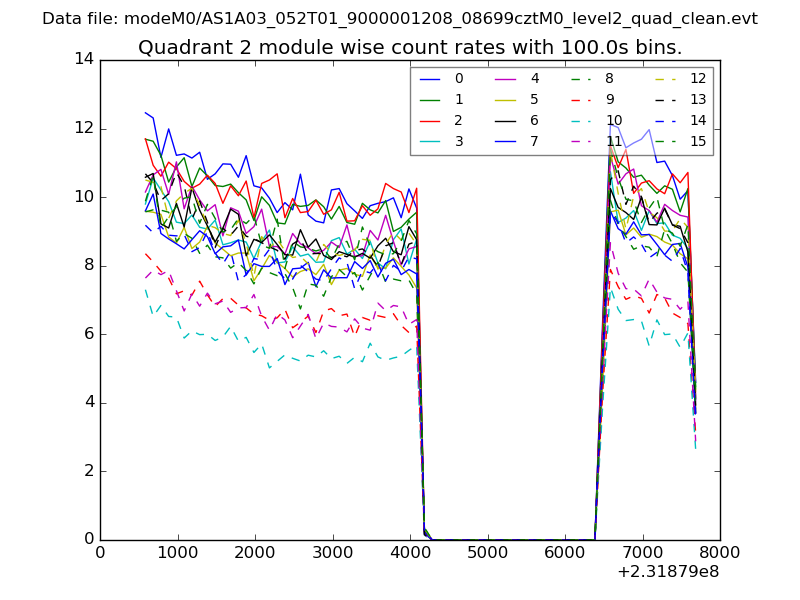
| Module-wise count rates for Quadrant B Data is divided into 100 sec bins |
 |
 |
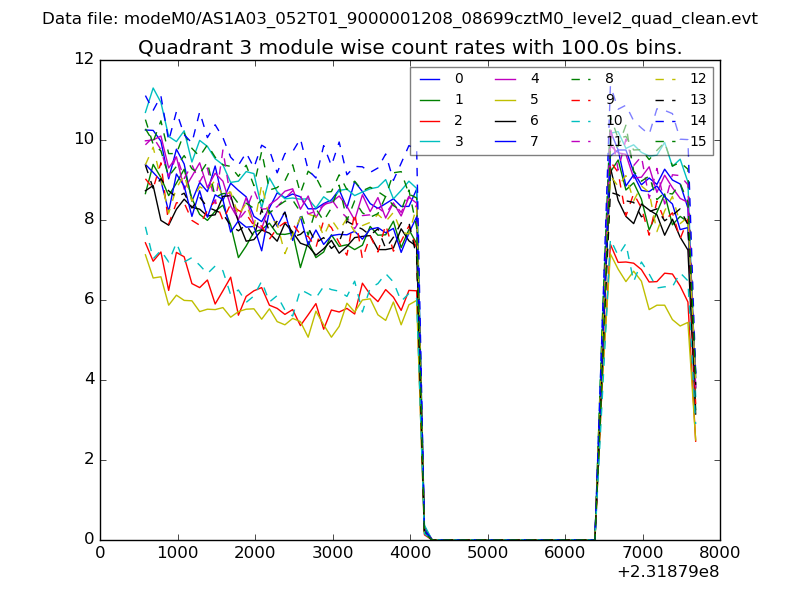
| Module-wise count rates for Quadrant C Data is divided into 100 sec bins |
 |
 |
| Module-wise count rates for Quadrant D Data is divided into 100 sec bins |
 |
 |
| Parameter | Plot |
|---|---|
| CZT HV Monitor | 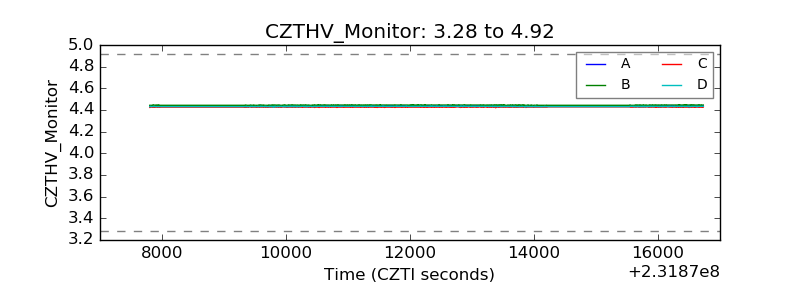 |
| D_VDD | 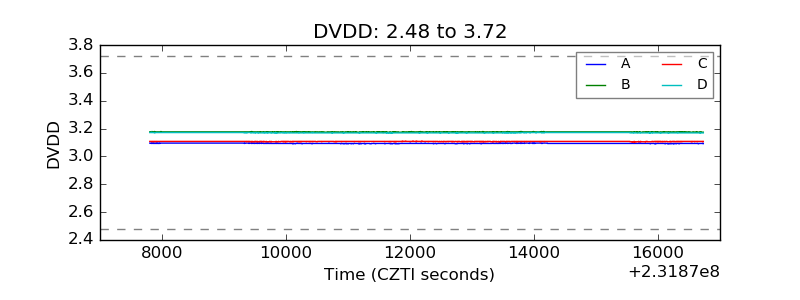 |
| Temperature 1 | 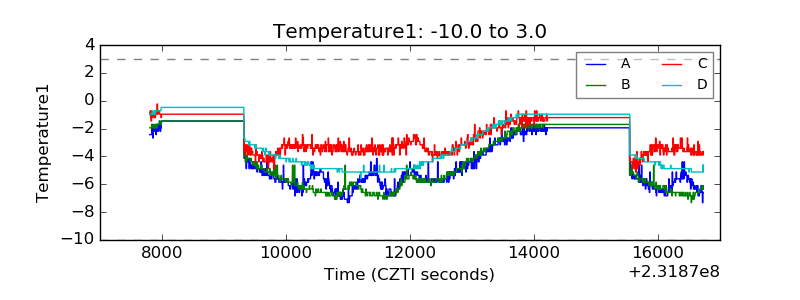 |
| Veto HV Monitor | 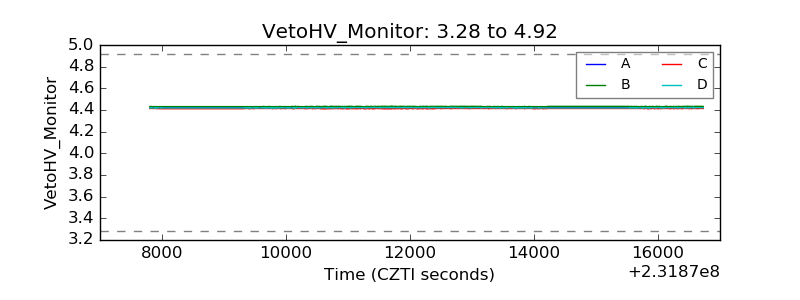 |
| Veto LLD | 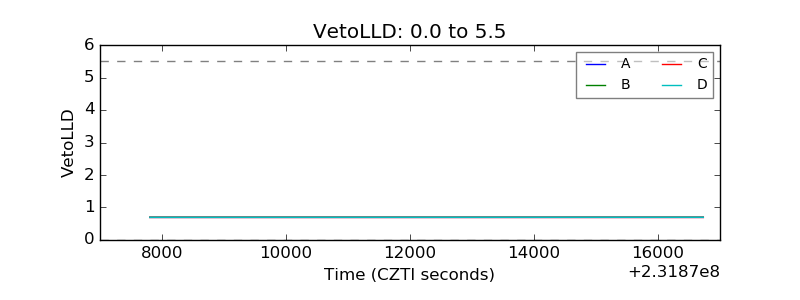 |
| Alpha Counter | 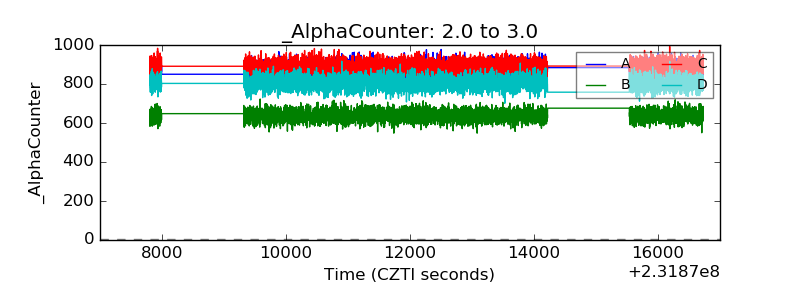 |
| _CPM_Rate | 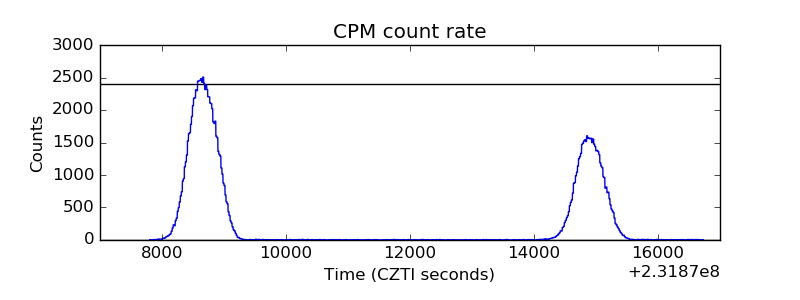 |
| CZT Counter | 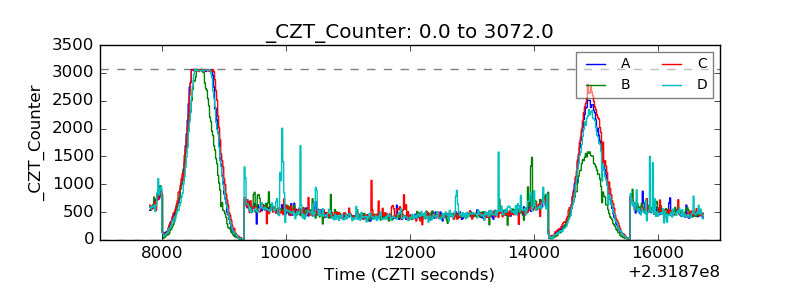 |
| +2.5 Volts monitor |  |
| +5 Volts monitor |  |
| _ROLL_ROT | 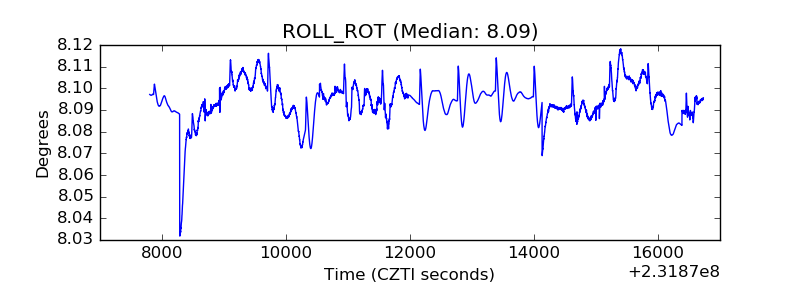 |
| _Roll_DEC | 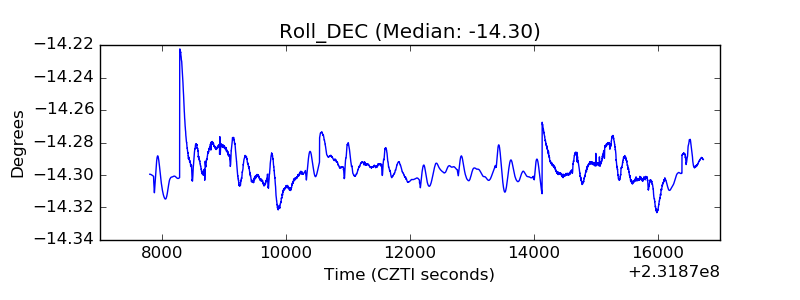 |
| _Roll_RA | 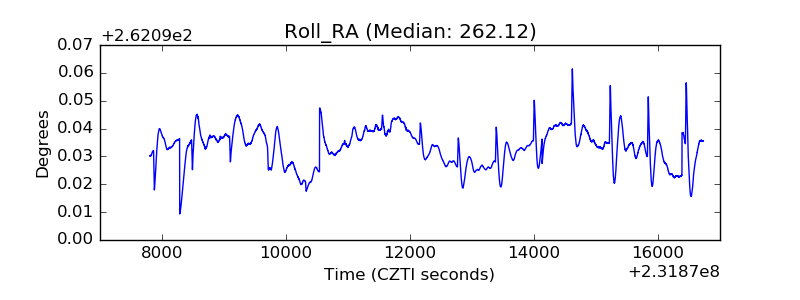 |
| Veto Counter | 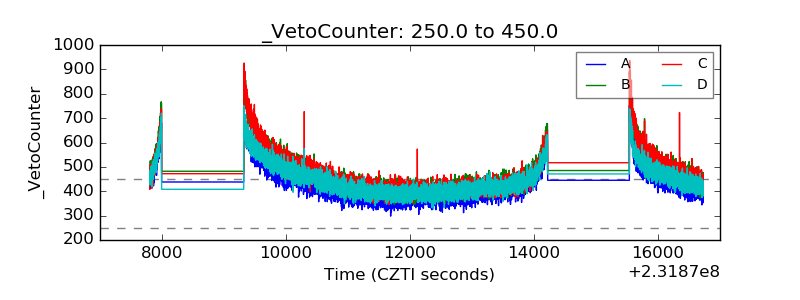 |