| Param | Original file | Final file |
|---|---|---|
| Filename | modeM0/AS1A03_052T01_9000001208_08700cztM0_level2.evt | modeM0/AS1A03_052T01_9000001208_08700cztM0_level2_quad_clean.evt |
| Size (bytes) | 464,947,200 | 98,763,840 |
| Size | 443.4 MB | 94.2 MB |
| Events in quadrant A | 3,352,747 | 619,089 |
| Events in quadrant B | 3,534,993 | 644,265 |
| Events in quadrant C | 3,302,663 | 643,824 |
| Events in quadrant D | 3,424,889 | 606,308 |
| Mode M9 | |||
|---|---|---|---|
| Quadrant | BADHDUFLAG | Total packets | Discarded packets |
| A | 0 | 25 | 0 |
| B | 0 | 25 | 0 |
| C | 0 | 25 | 0 |
| D | 0 | 25 | 0 |
| Mode SS | |||
|---|---|---|---|
| Quadrant | BADHDUFLAG | Total packets | Discarded packets |
| A | 0 | 140 | 0 |
| B | 0 | 140 | 0 |
| C | 0 | 140 | 0 |
| D | 0 | 140 | 0 |
| Mode M0 | |||
|---|---|---|---|
| Quadrant | BADHDUFLAG | Total packets | Discarded packets |
| A | 0 | 14504 | 3 |
| B | 0 | 15014 | 2 |
| C | 0 | 14316 | 2 |
| D | 0 | 14909 | 2 |
| Quadrant | Total seconds | Saturated seconds | Saturation percentage |
|---|---|---|---|
| A | 6856 | 45 | 0.656359% |
| B | 6856 | 110 | 1.604434% |
| C | 6856 | 29 | 0.422987% |
| D | 6856 | 42 | 0.612602% |
Noise dominated data is calculated using 1-second bins in cleaned event files. If a bin has >2000 counts, and if more than 50% of those come from <1% of pixels, then it is considered to be noise-dominated and hence unusable.
| Quadrant | # 1 sec bins | Bins with >0 counts | Bins with >2000 counts | High rate bins dominated by noise | Noise dominated (total time) | Noise dominated (detector-on time) | Marked lightcurve |
|---|---|---|---|---|---|---|---|
| A | 9356 | 6858 | 4 | 4 | 0.04% | 0.06% | 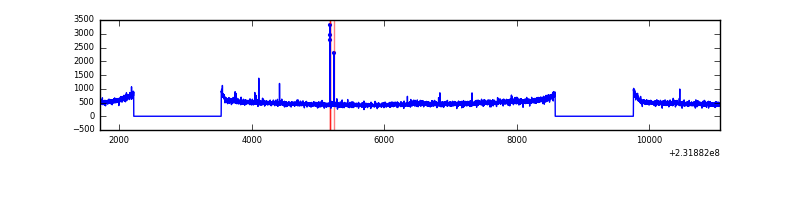 |
| B | 9356 | 6857 | 14 | 14 | 0.15% | 0.20% | 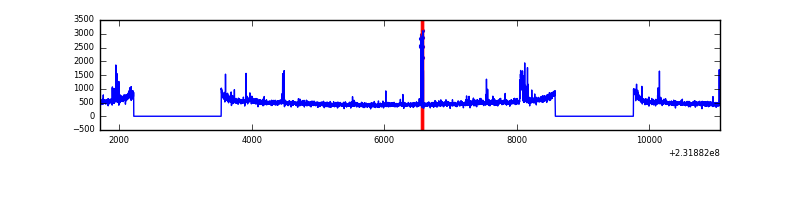 |
| C | 9356 | 6857 | 0 | 0 | 0.00% | 0.00% | 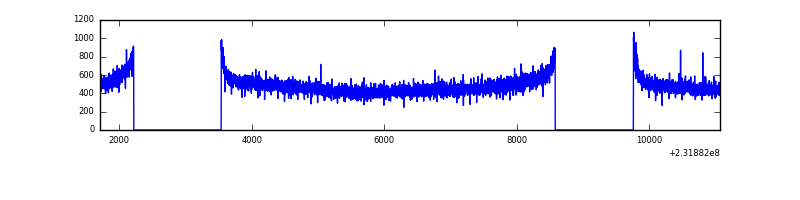 |
| D | 9356 | 6858 | 13 | 13 | 0.14% | 0.19% | 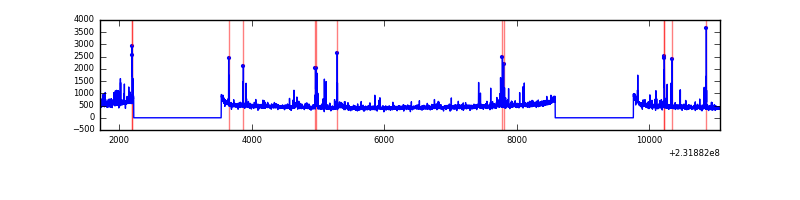 |
Top three noisy pixels from each quadrant. If the there are fewer than three noisy pixels in the level2.evt file, extra rows are filled as -1
| Pixel properties | Quadrant properties | ||||||
|---|---|---|---|---|---|---|---|
| Quadrant | DetID | PixID | Counts | Sigma | Mean | Median | Sigma |
| A | 13 | 251 | 61388 | 351.01 | 848 | 828 | 172.5 |
| A | 5 | 16 | 21118 | 117.6 | 848 | 828 | 172.5 |
| A | 0 | 226 | 7857 | 40.74 | 848 | 828 | 172.5 |
| B | 4 | 173 | 63786 | 380.05 | 865 | 843 | 165.6 |
| B | 5 | 255 | 59189 | 352.29 | 865 | 843 | 165.6 |
| B | 10 | 16 | 28499 | 166.99 | 865 | 843 | 165.6 |
| C | 13 | 61 | 6497 | 28.68 | 845 | 850 | 196.9 |
| C | 8 | 222 | 3157 | 11.72 | 845 | 850 | 196.9 |
| C | 12 | 4 | 2446 | 8.11 | 845 | 850 | 196.9 |
| D | 2 | 152 | 76183 | 341.72 | 829 | 809 | 220.6 |
| D | 1 | 52 | 69613 | 311.93 | 829 | 809 | 220.6 |
| D | 2 | 136 | 45728 | 203.65 | 829 | 809 | 220.6 |
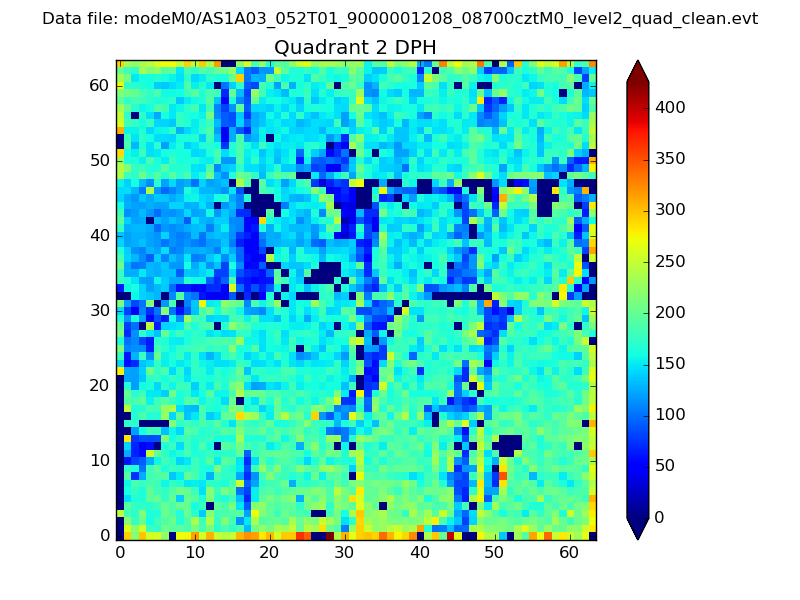
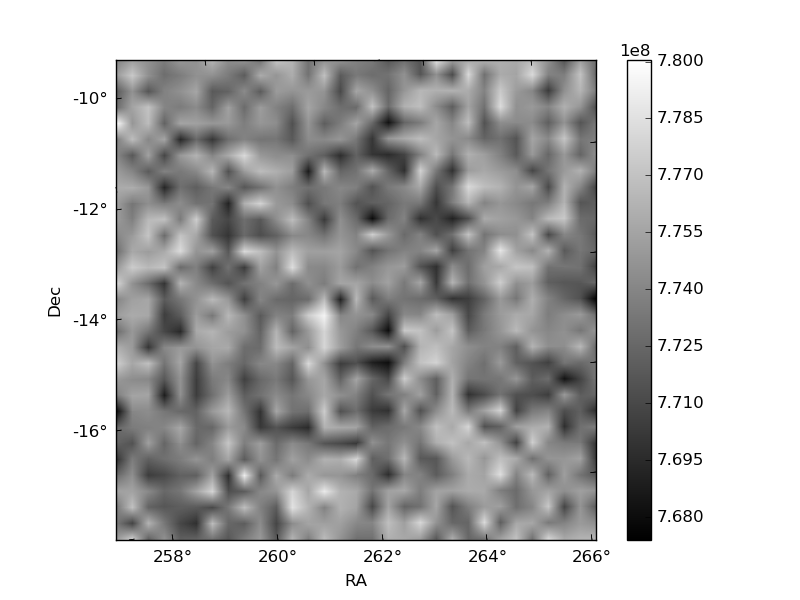
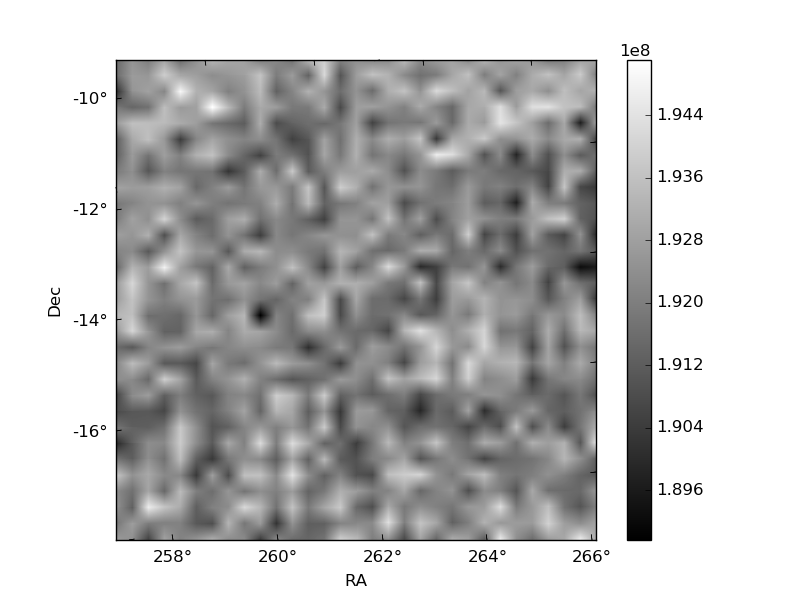
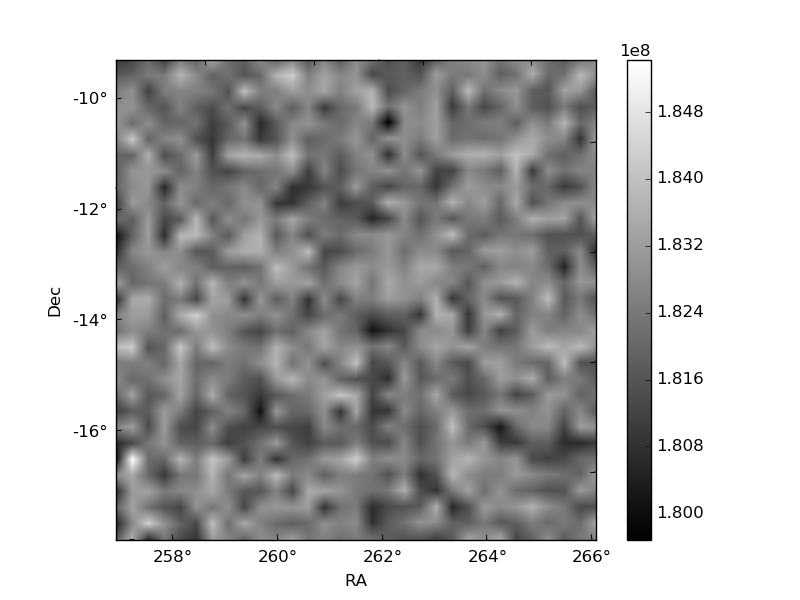
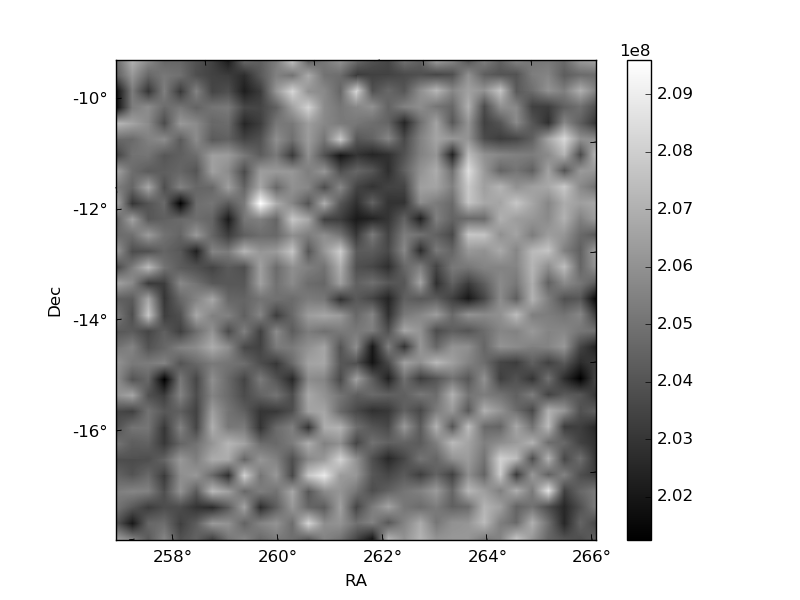
Histogram calculated using DETX and DETY for each event in the final _common_clean file
| Quadrant A | 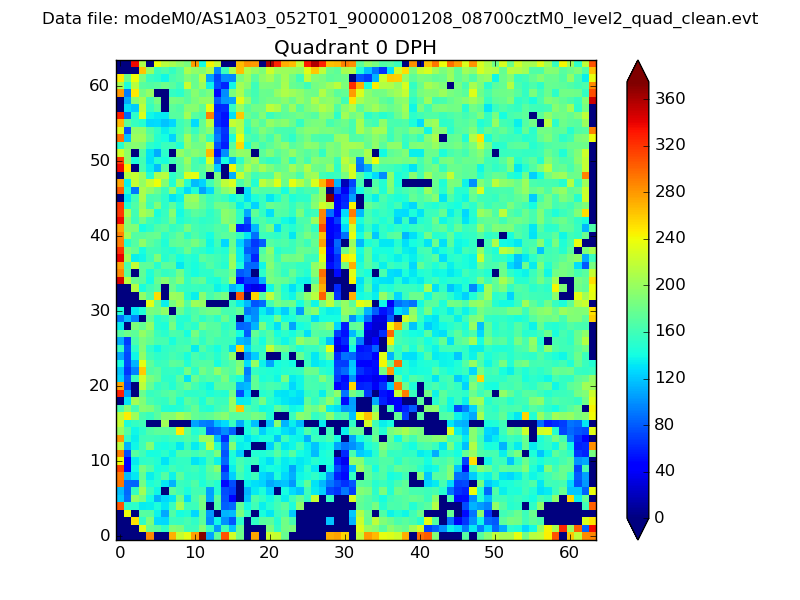 |
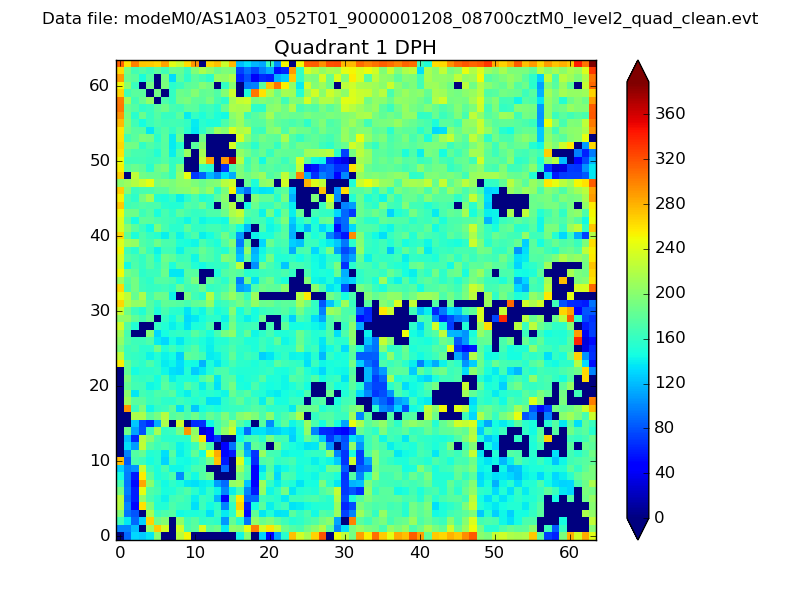 |
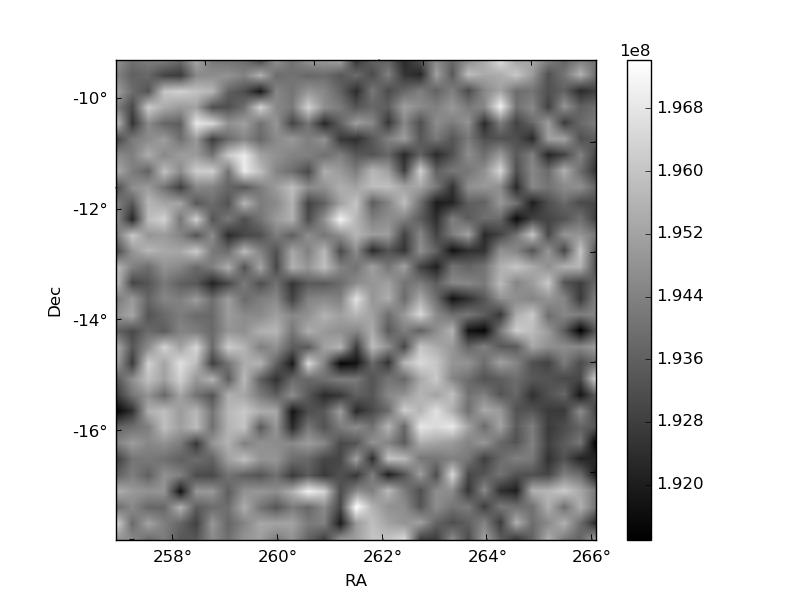
Quadrant B |
|---|---|---|---|
| Quadrant D | 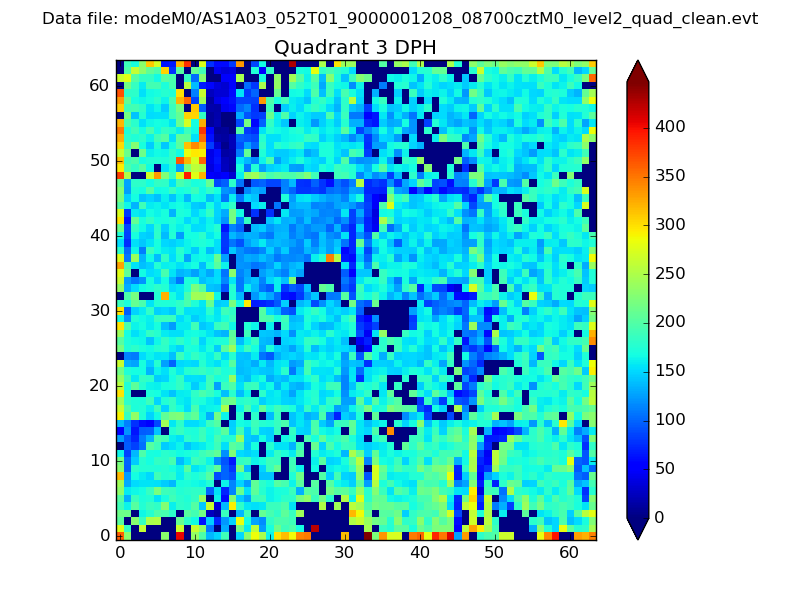 |
 |
Quadrant C |
| Plot type | Count rate plots | Images |
|---|---|---|
| Comparison with Poisson distribution Blue bars denote a histogram of data divided into 1 sec bins. Red curve is a Poisson curve with rate = median count rate of data. |
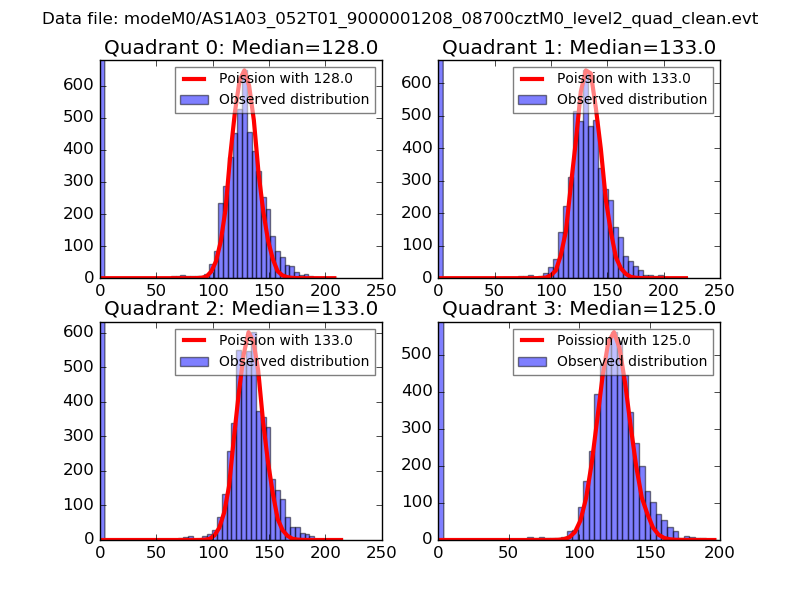 |
 |
| Quadrant-wise count rates Data is divided into 100 sec bins |
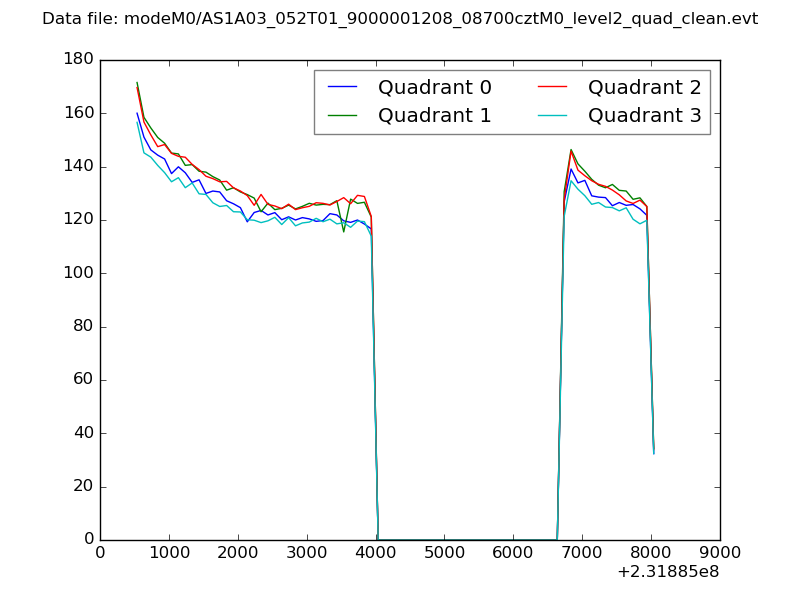 |
|
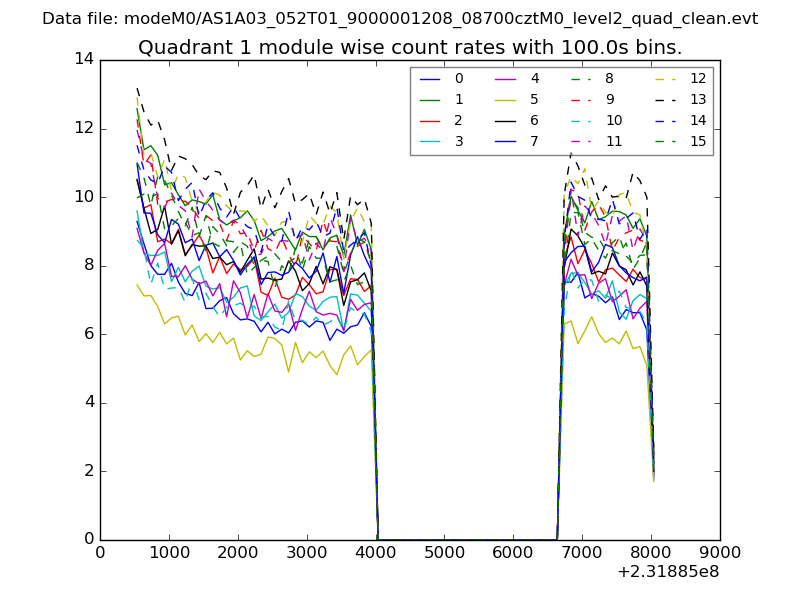
| Module-wise count rates for Quadrant A Data is divided into 100 sec bins |
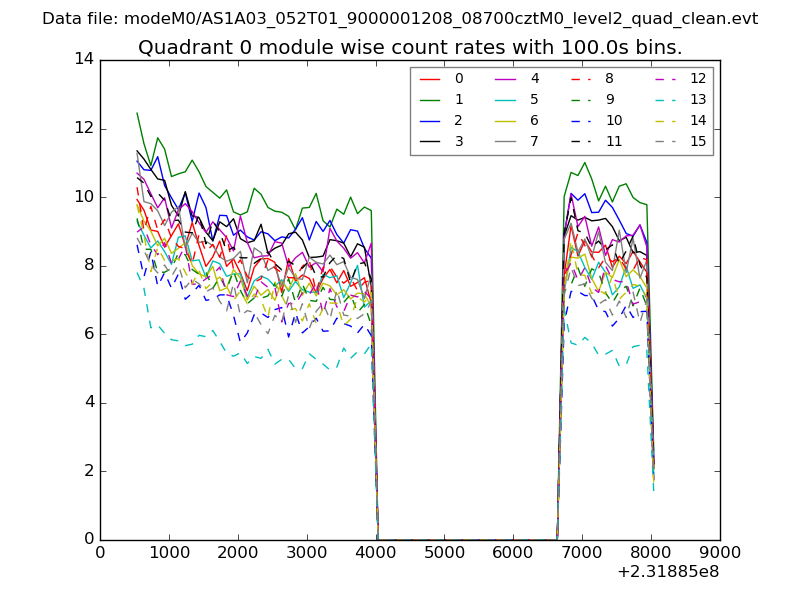 |
 |
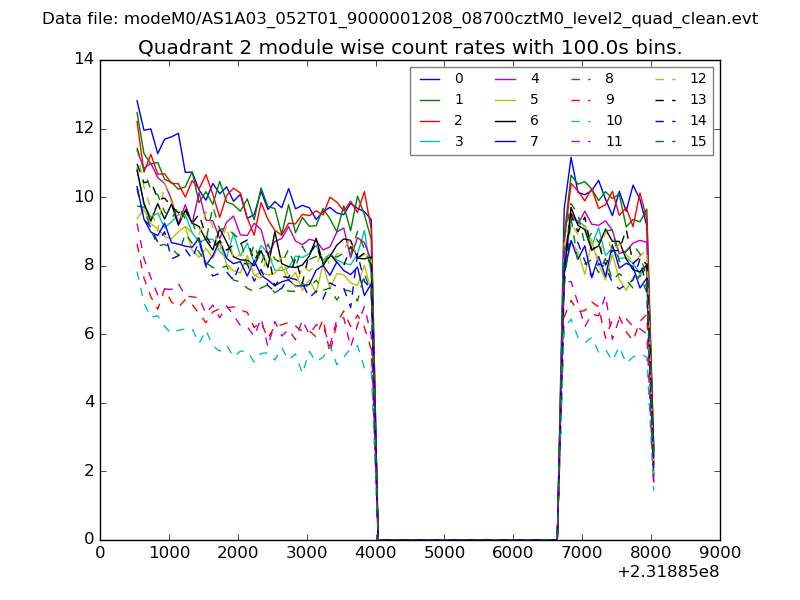
| Module-wise count rates for Quadrant B Data is divided into 100 sec bins |
 |
 |
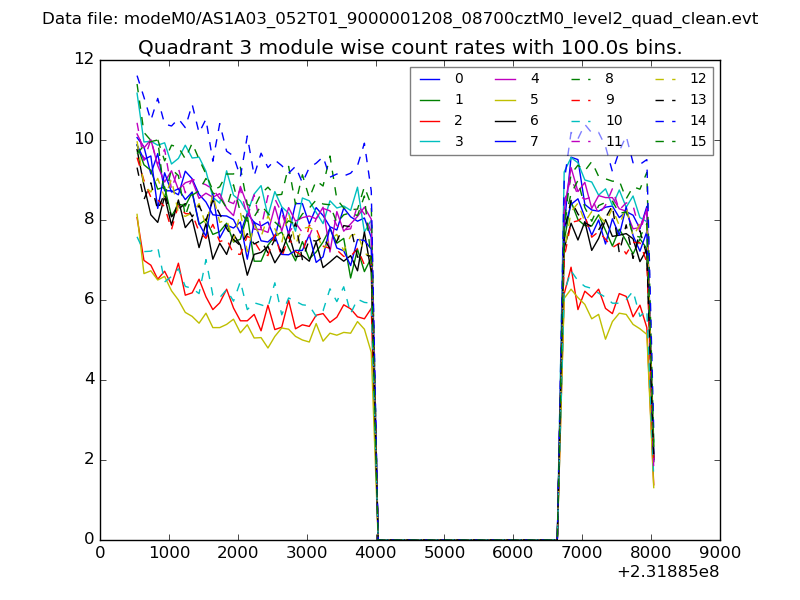
| Module-wise count rates for Quadrant C Data is divided into 100 sec bins |
 |
 |
| Module-wise count rates for Quadrant D Data is divided into 100 sec bins |
 |
 |
| Parameter | Plot |
|---|---|
| CZT HV Monitor | 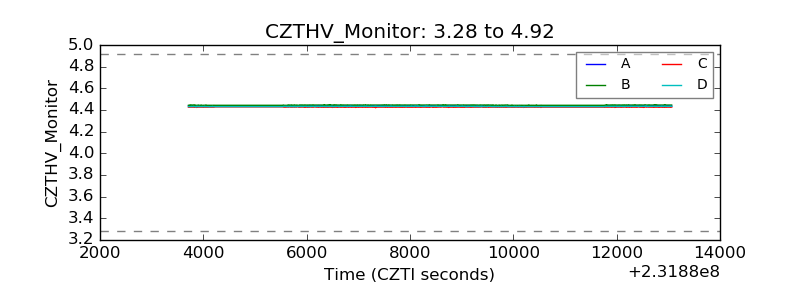 |
| D_VDD | 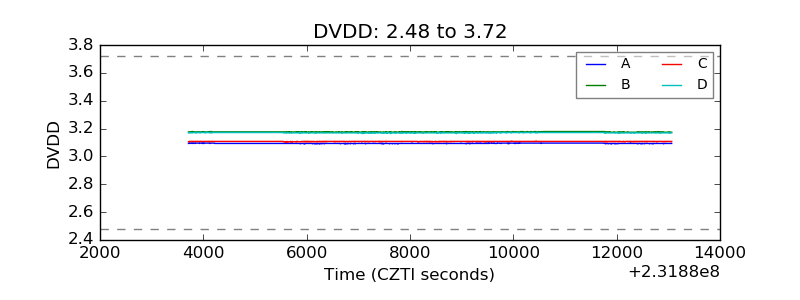 |
| Temperature 1 | 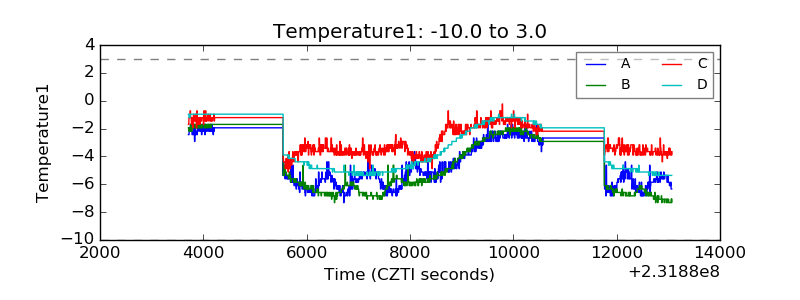 |
| Veto HV Monitor | 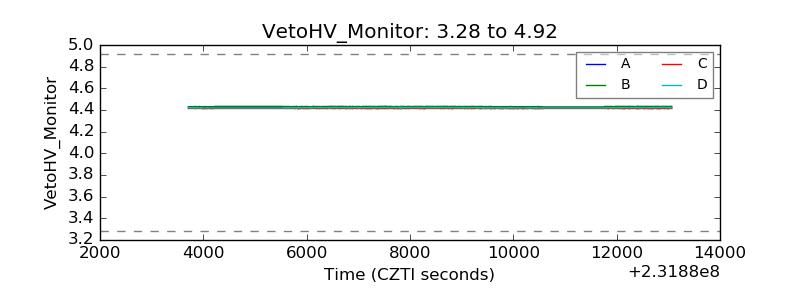 |
| Veto LLD | 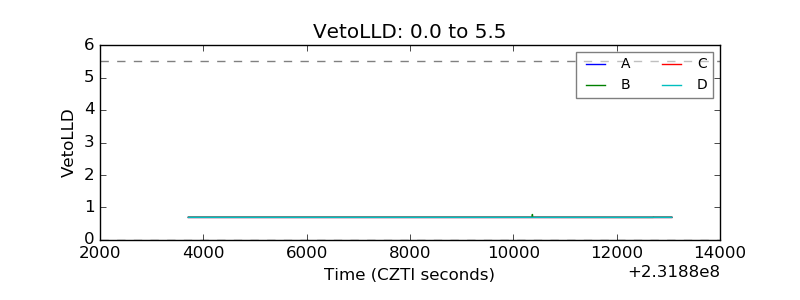 |
| Alpha Counter | 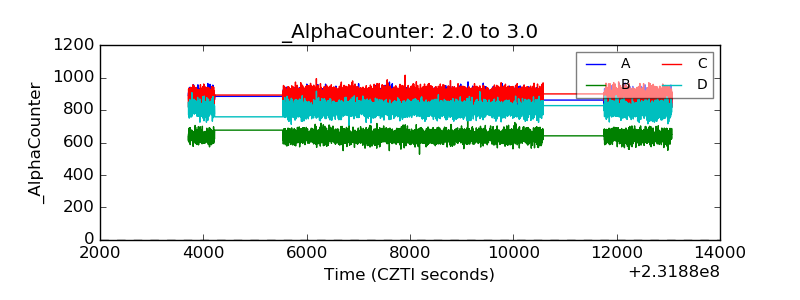 |
| _CPM_Rate | 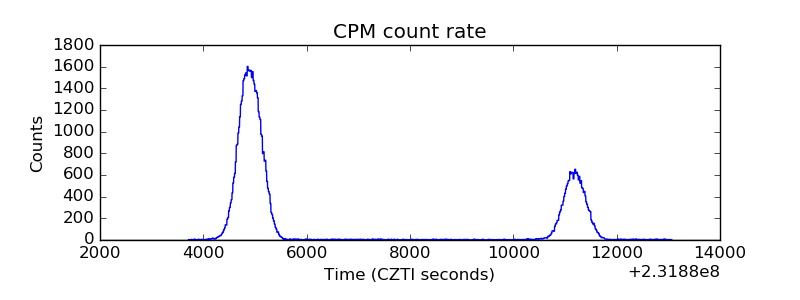 |
| CZT Counter | 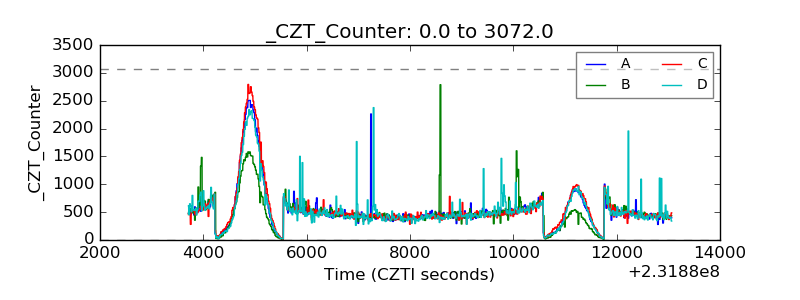 |
| +2.5 Volts monitor | 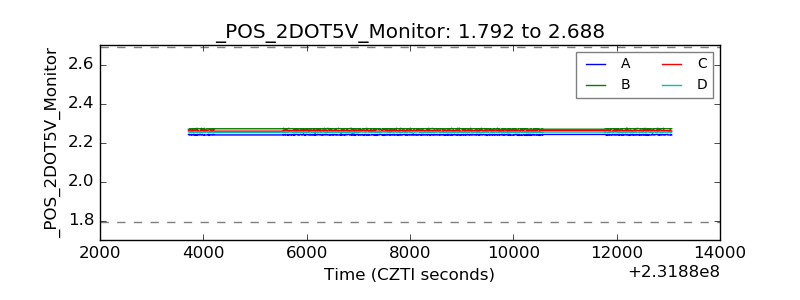 |
| +5 Volts monitor |  |
| _ROLL_ROT | 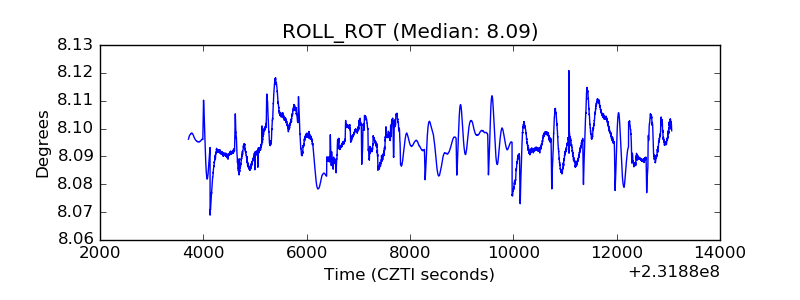 |
| _Roll_DEC | 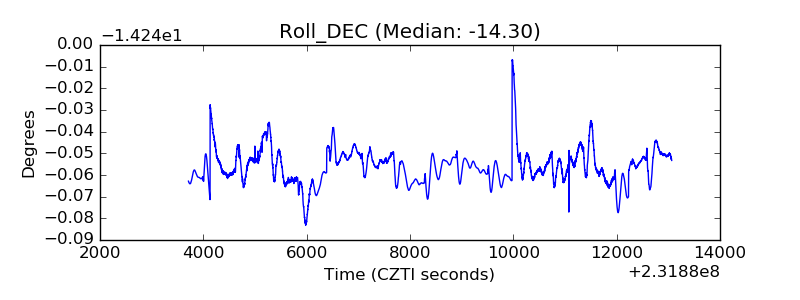 |
| _Roll_RA | 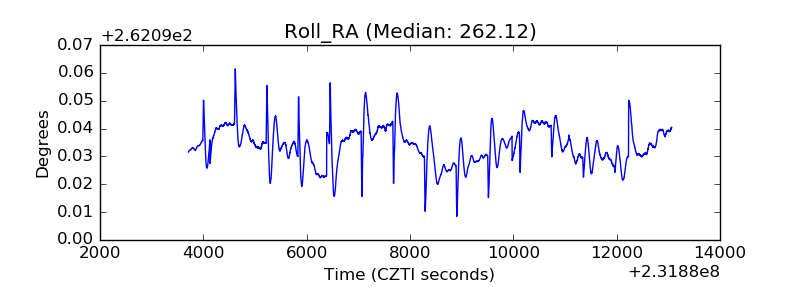 |
| Veto Counter | 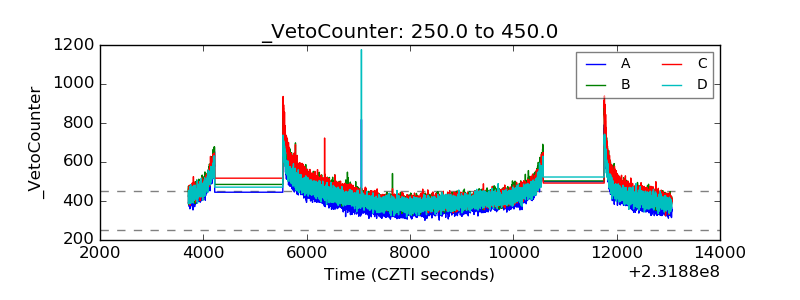 |