| Param | Original file | Final file |
|---|---|---|
| Filename | modeM0/AS1A03_052T01_9000001208_08701cztM0_level2.evt | modeM0/AS1A03_052T01_9000001208_08701cztM0_level2_quad_clean.evt |
| Size (bytes) | 521,847,360 | 92,494,080 |
| Size | 497.7 MB | 88.2 MB |
| Events in quadrant A | 3,779,972 | 560,793 |
| Events in quadrant B | 4,111,036 | 580,453 |
| Events in quadrant C | 3,619,920 | 578,240 |
| Events in quadrant D | 3,775,407 | 550,935 |
| Mode M9 | |||
|---|---|---|---|
| Quadrant | BADHDUFLAG | Total packets | Discarded packets |
| A | 0 | 20 | 0 |
| B | 0 | 20 | 0 |
| C | 0 | 20 | 0 |
| D | 0 | 20 | 0 |
| Mode SS | |||
|---|---|---|---|
| Quadrant | BADHDUFLAG | Total packets | Discarded packets |
| A | 0 | 158 | 0 |
| B | 0 | 158 | 0 |
| C | 0 | 158 | 0 |
| D | 0 | 158 | 0 |
| Mode M0 | |||
|---|---|---|---|
| Quadrant | BADHDUFLAG | Total packets | Discarded packets |
| A | 0 | 16238 | 3 |
| B | 0 | 17364 | 2 |
| C | 0 | 15863 | 2 |
| D | 0 | 16432 | 2 |
| Quadrant | Total seconds | Saturated seconds | Saturation percentage |
|---|---|---|---|
| A | 7622 | 58 | 0.760955% |
| B | 7622 | 202 | 2.650223% |
| C | 7622 | 51 | 0.669116% |
| D | 7622 | 51 | 0.669116% |
Noise dominated data is calculated using 1-second bins in cleaned event files. If a bin has >2000 counts, and if more than 50% of those come from <1% of pixels, then it is considered to be noise-dominated and hence unusable.
| Quadrant | # 1 sec bins | Bins with >0 counts | Bins with >2000 counts | High rate bins dominated by noise | Noise dominated (total time) | Noise dominated (detector-on time) | Marked lightcurve |
|---|---|---|---|---|---|---|---|
| A | 9667 | 7624 | 0 | 0 | 0.00% | 0.00% |  |
| B | 9667 | 7623 | 47 | 47 | 0.49% | 0.62% |  |
| C | 9667 | 7622 | 2 | 2 | 0.02% | 0.03% | 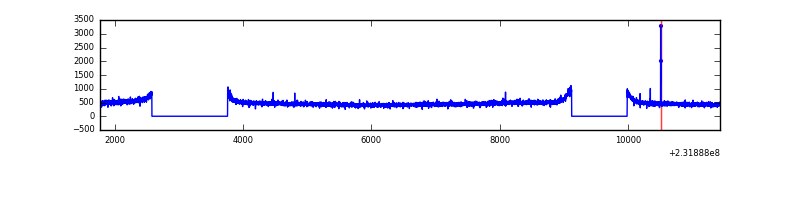 |
| D | 9667 | 7624 | 20 | 20 | 0.21% | 0.26% |  |
Top three noisy pixels from each quadrant. If the there are fewer than three noisy pixels in the level2.evt file, extra rows are filled as -1
| Pixel properties | Quadrant properties | ||||||
|---|---|---|---|---|---|---|---|
| Quadrant | DetID | PixID | Counts | Sigma | Mean | Median | Sigma |
| A | 13 | 251 | 149410 | 776.34 | 929 | 908 | 191.3 |
| A | 15 | 174 | 50643 | 260.01 | 929 | 908 | 191.3 |
| A | 0 | 226 | 8735 | 40.92 | 929 | 908 | 191.3 |
| B | 10 | 16 | 357601 | 1961.57 | 940 | 916 | 181.8 |
| B | 4 | 173 | 60299 | 326.57 | 940 | 916 | 181.8 |
| B | 12 | 111 | 19019 | 99.56 | 940 | 916 | 181.8 |
| C | 14 | 225 | 12177 | 52.08 | 922 | 927 | 216.0 |
| C | 14 | 67 | 7962 | 32.57 | 922 | 927 | 216.0 |
| C | 13 | 61 | 6959 | 27.92 | 922 | 927 | 216.0 |
| D | 1 | 52 | 120741 | 513.75 | 909 | 887 | 233.3 |
| D | 9 | 64 | 69288 | 293.2 | 909 | 887 | 233.3 |
| D | 2 | 152 | 66721 | 282.2 | 909 | 887 | 233.3 |
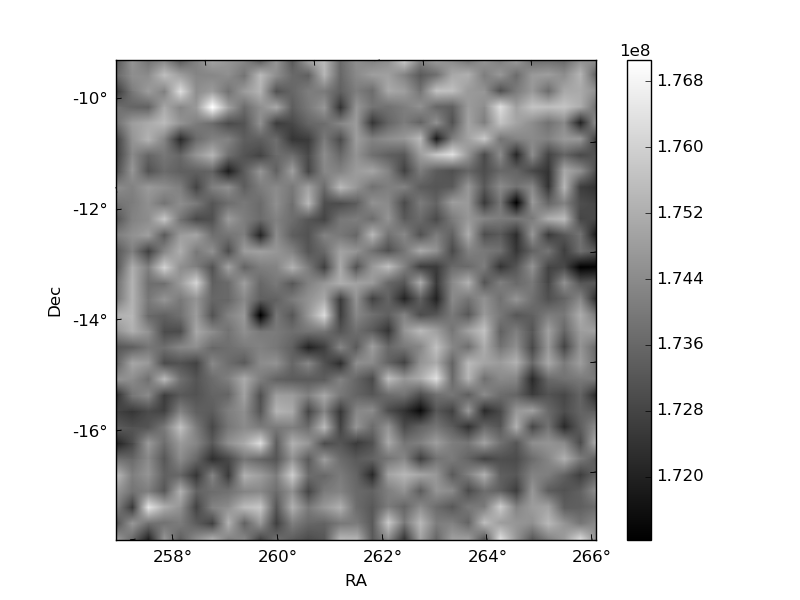
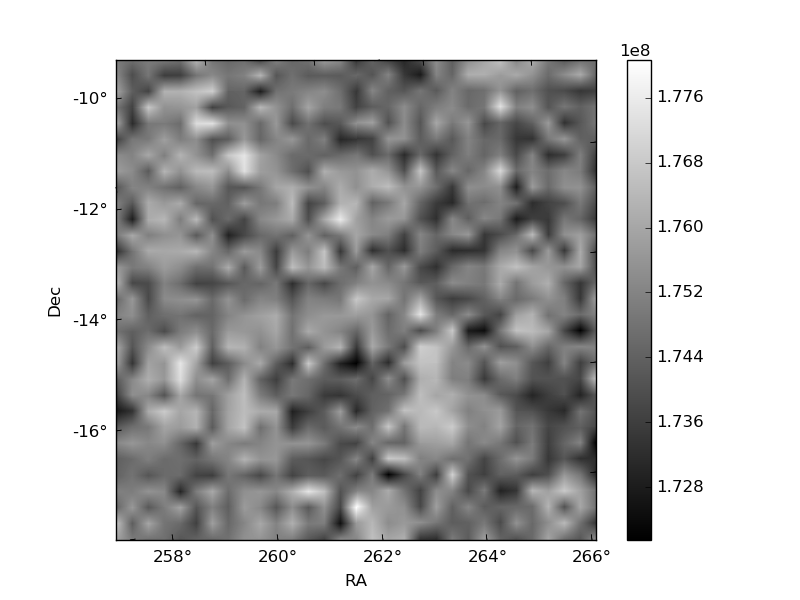
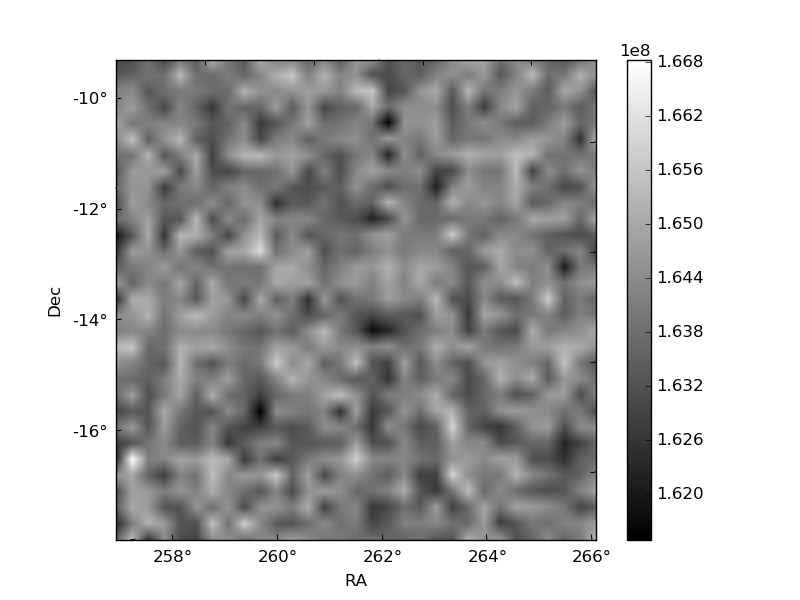
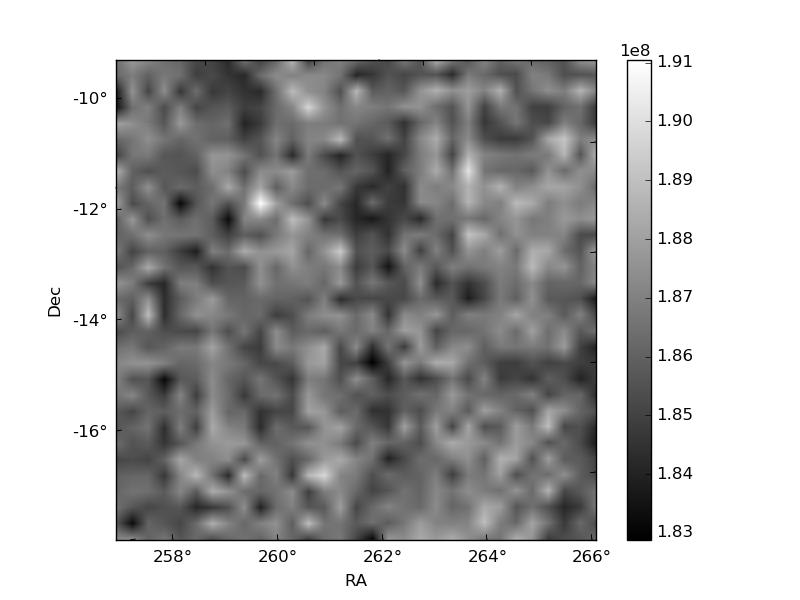
Histogram calculated using DETX and DETY for each event in the final _common_clean file
| Quadrant A | 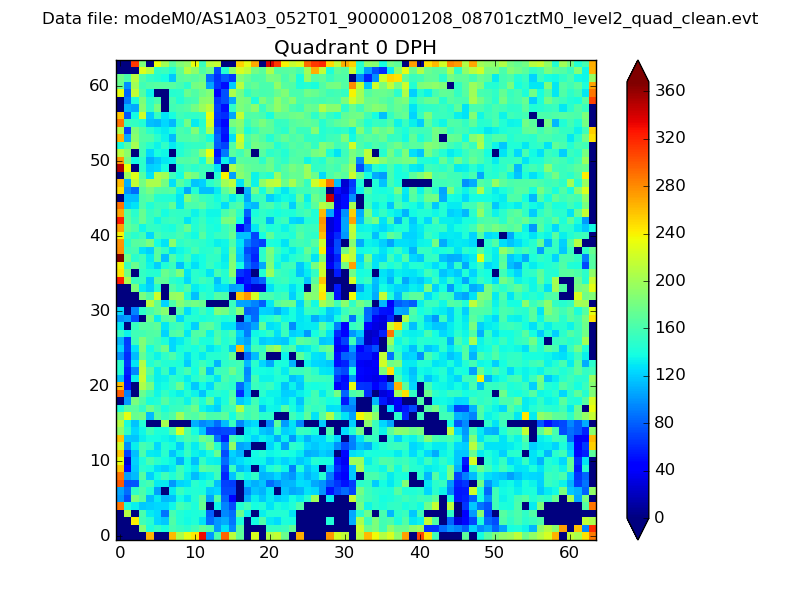 |
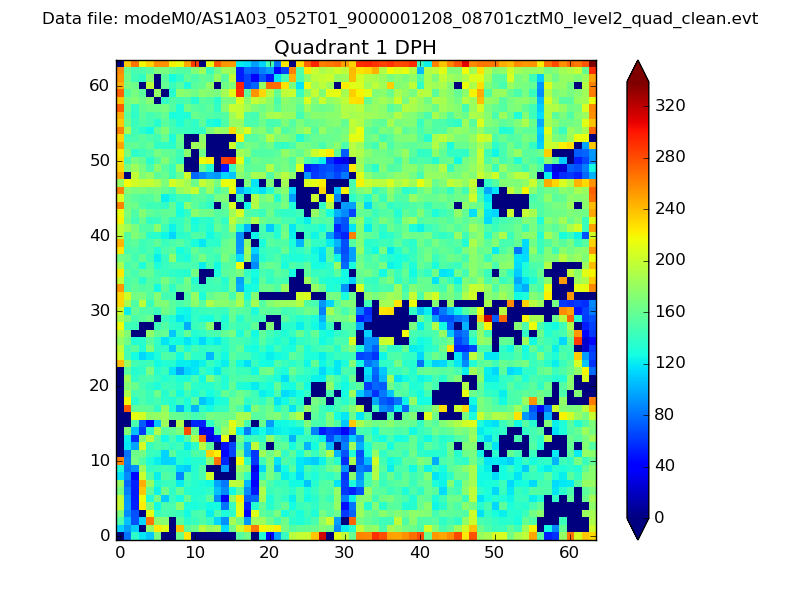 |
Quadrant B |
|---|---|---|---|
| Quadrant D |  |
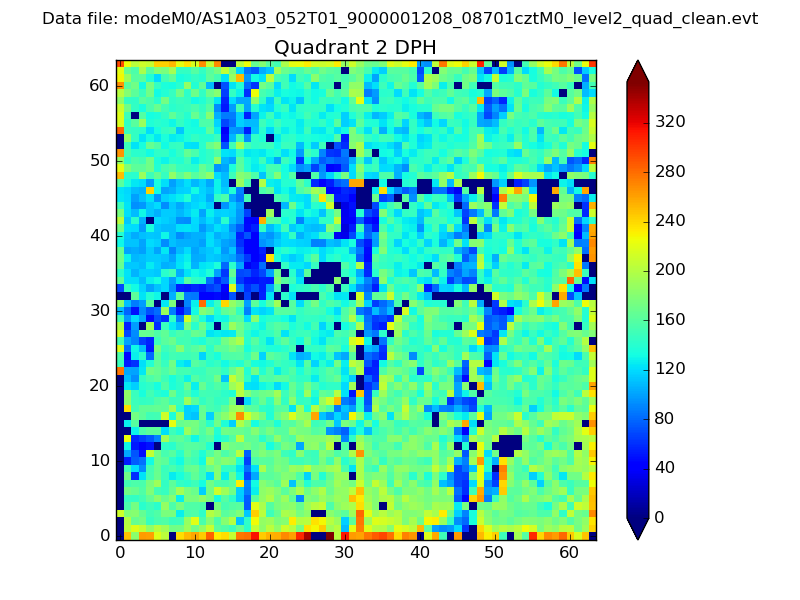 |
Quadrant C |
| Plot type | Count rate plots | Images |
|---|---|---|
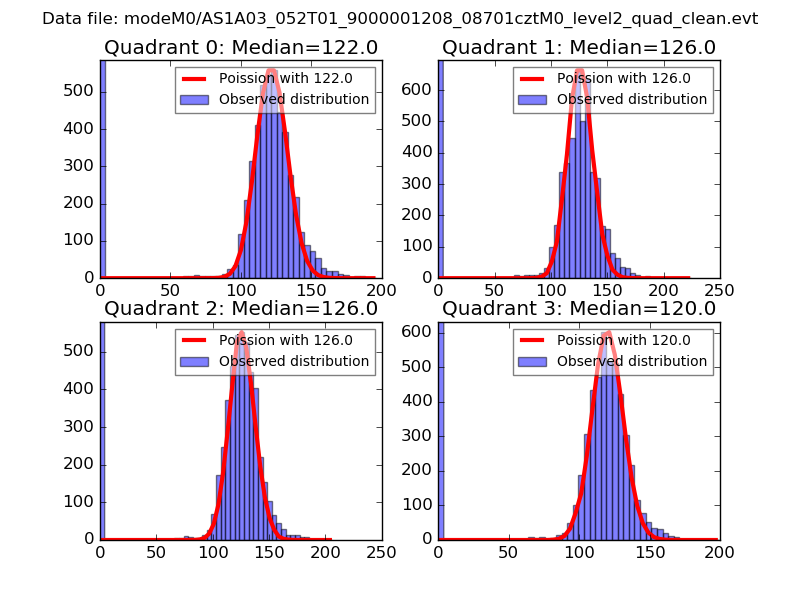
| Comparison with Poisson distribution Blue bars denote a histogram of data divided into 1 sec bins. Red curve is a Poisson curve with rate = median count rate of data. |
 |
 |
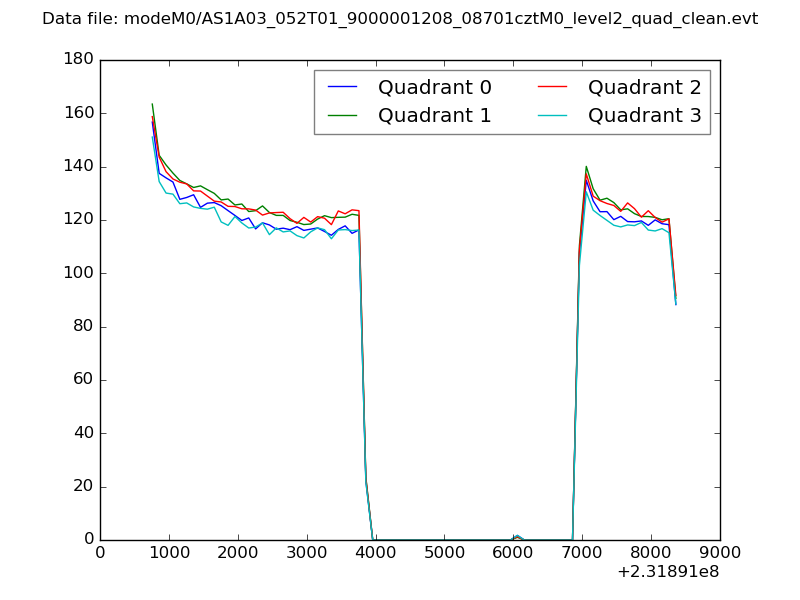
| Quadrant-wise count rates Data is divided into 100 sec bins |
 |
|
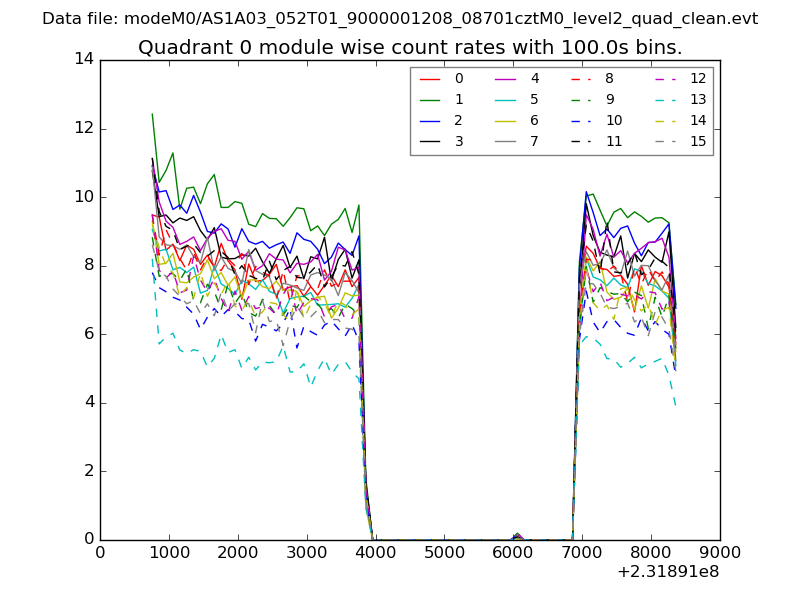
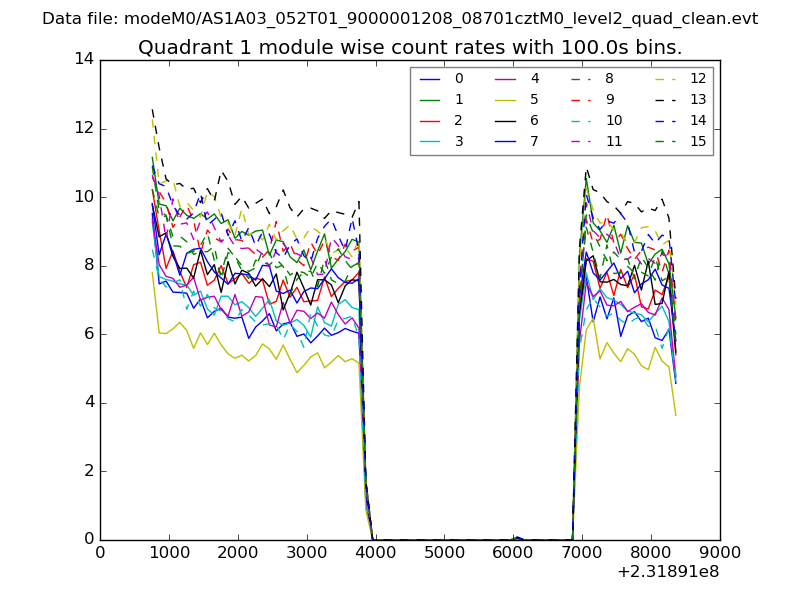
| Module-wise count rates for Quadrant A Data is divided into 100 sec bins |
 |
 |
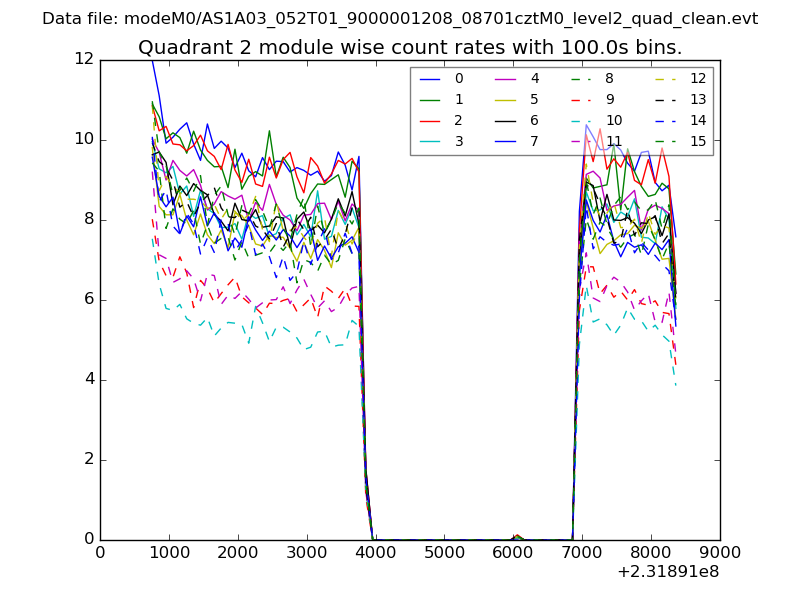
| Module-wise count rates for Quadrant B Data is divided into 100 sec bins |
 |
 |
| Module-wise count rates for Quadrant C Data is divided into 100 sec bins |
 |
 |
| Module-wise count rates for Quadrant D Data is divided into 100 sec bins |
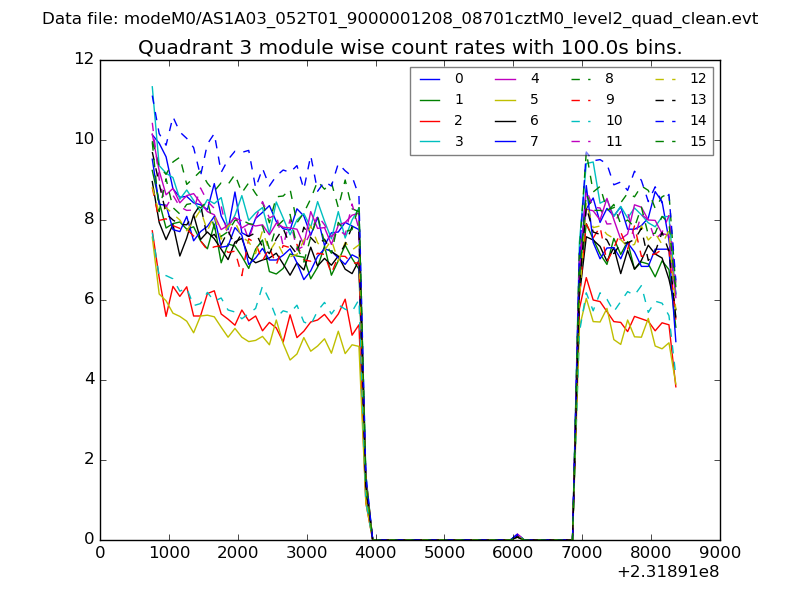 |
 |
| Parameter | Plot |
|---|---|
| CZT HV Monitor | 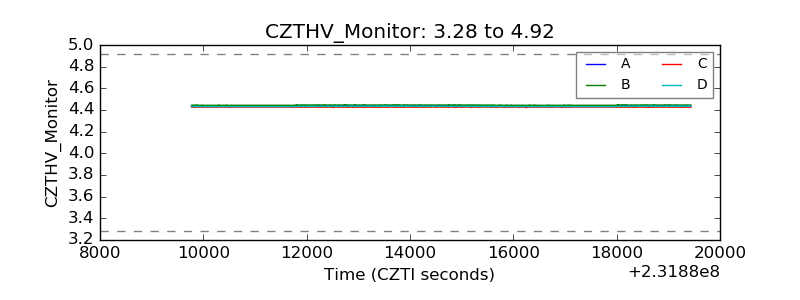 |
| D_VDD | 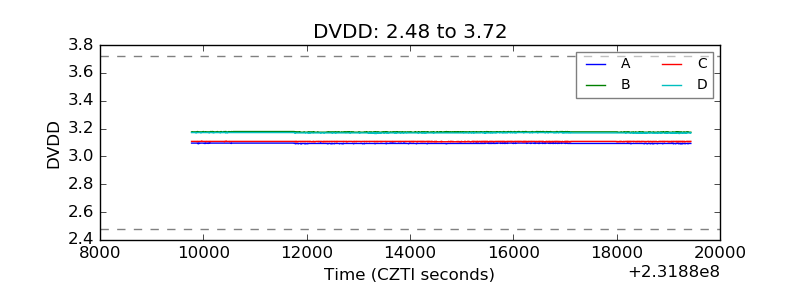 |
| Temperature 1 | 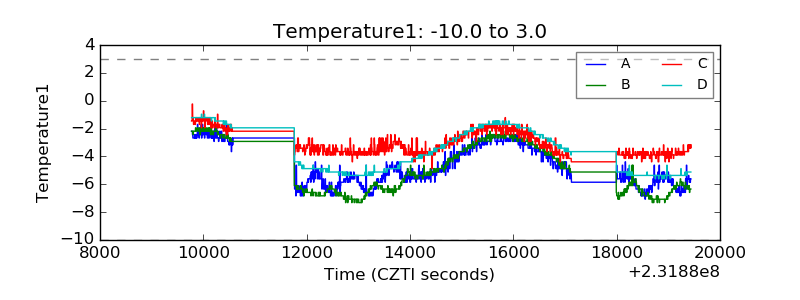 |
| Veto HV Monitor |  |
| Veto LLD | 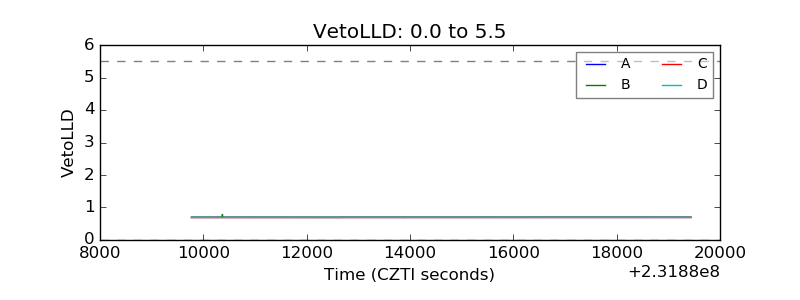 |
| Alpha Counter | 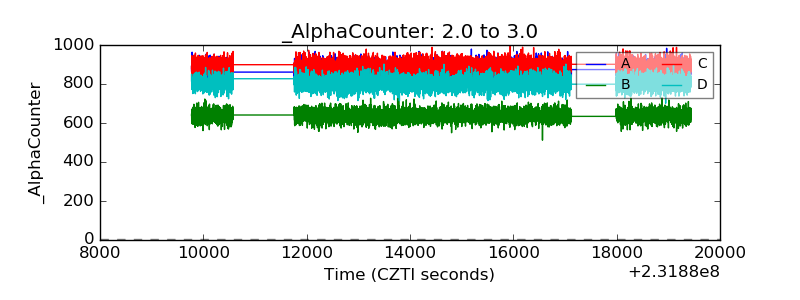 |
| _CPM_Rate | 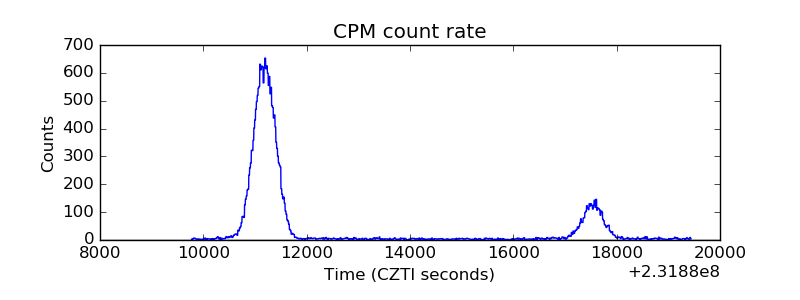 |
| CZT Counter | 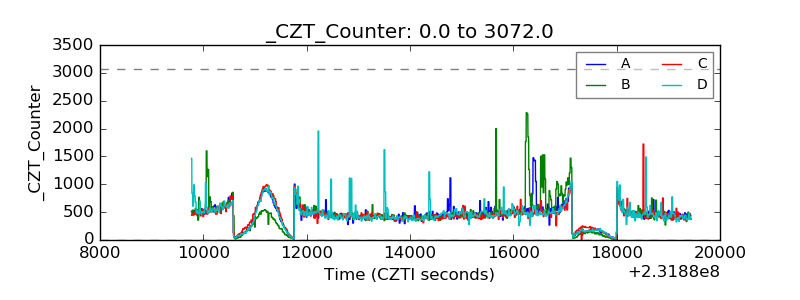 |
| +2.5 Volts monitor | 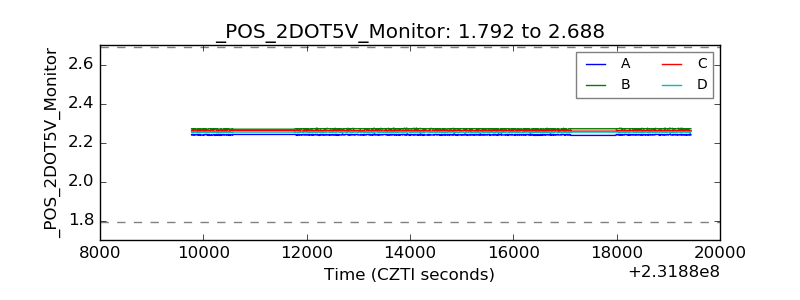 |
| +5 Volts monitor |  |
| _ROLL_ROT | 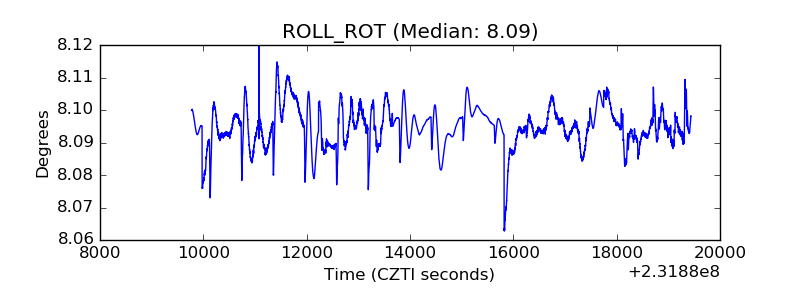 |
| _Roll_DEC | 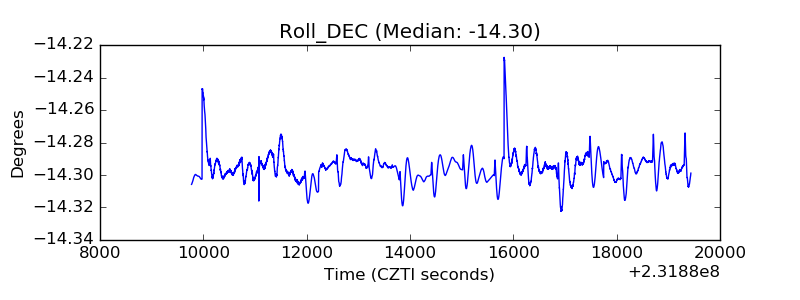 |
| _Roll_RA | 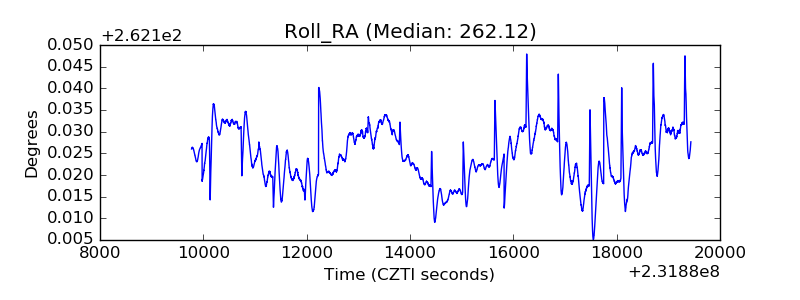 |
| Veto Counter | 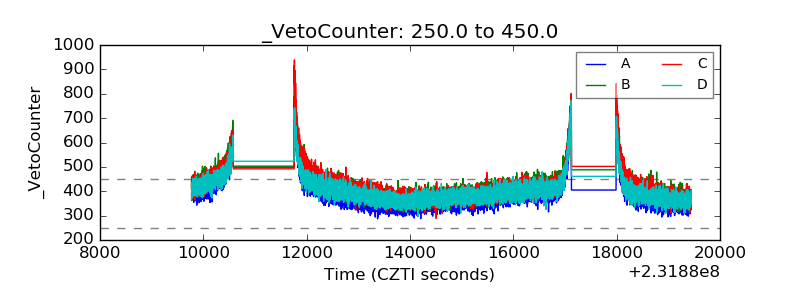 |