| Param | Original file | Final file |
|---|---|---|
| Filename | modeM0/AS1A03_052T01_9000001208_08708cztM0_level2.evt | modeM0/AS1A03_052T01_9000001208_08708cztM0_level2_quad_clean.evt |
| Size (bytes) | 2,152,368,000 | 366,543,360 |
| Size | 2.0 GB | 349.6 MB |
| Events in quadrant A | 15,000,441 | 2,203,629 |
| Events in quadrant B | 14,830,101 | 2,279,094 |
| Events in quadrant C | 14,447,849 | 2,273,850 |
| Events in quadrant D | 18,749,278 | 2,151,589 |
| Mode M9 | |||
|---|---|---|---|
| Quadrant | BADHDUFLAG | Total packets | Discarded packets |
| A | 0 | 16 | 0 |
| B | 0 | 16 | 0 |
| C | 0 | 16 | 0 |
| D | 0 | 16 | 0 |
| Mode SS | |||
|---|---|---|---|
| Quadrant | BADHDUFLAG | Total packets | Discarded packets |
| A | 0 | 644 | 0 |
| B | 0 | 644 | 0 |
| C | 0 | 644 | 0 |
| D | 0 | 644 | 0 |
| Mode M0 | |||
|---|---|---|---|
| Quadrant | BADHDUFLAG | Total packets | Discarded packets |
| A | 0 | 66096 | 4 |
| B | 0 | 65679 | 4 |
| C | 0 | 65462 | 6 |
| D | 0 | 78598 | 4 |
| Quadrant | Total seconds | Saturated seconds | Saturation percentage |
|---|---|---|---|
| A | 31920 | 633 | 1.983083% |
| B | 31920 | 608 | 1.904762% |
| C | 31919 | 410 | 1.284501% |
| D | 31920 | 1359 | 4.257519% |
Noise dominated data is calculated using 1-second bins in cleaned event files. If a bin has >2000 counts, and if more than 50% of those come from <1% of pixels, then it is considered to be noise-dominated and hence unusable.
| Quadrant | # 1 sec bins | Bins with >0 counts | Bins with >2000 counts | High rate bins dominated by noise | Noise dominated (total time) | Noise dominated (detector-on time) | Marked lightcurve |
|---|---|---|---|---|---|---|---|
| A | 33460 | 31921 | 20 | 20 | 0.06% | 0.06% |  |
| B | 33460 | 31921 | 4 | 4 | 0.01% | 0.01% |  |
| C | 33460 | 31921 | 2 | 2 | 0.01% | 0.01% | 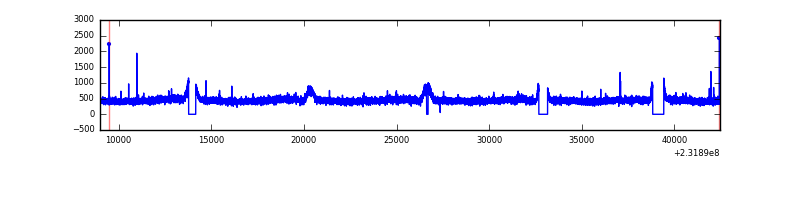 |
| D | 33460 | 31921 | 790 | 790 | 2.36% | 2.47% | 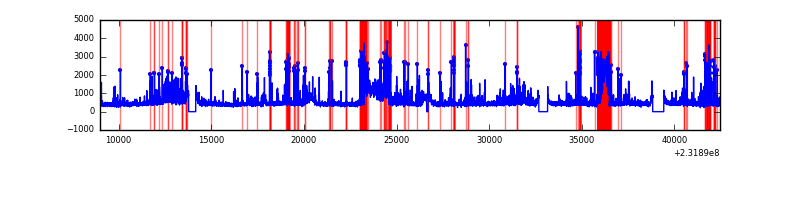 |
Top three noisy pixels from each quadrant. If the there are fewer than three noisy pixels in the level2.evt file, extra rows are filled as -1
| Pixel properties | Quadrant properties | ||||||
|---|---|---|---|---|---|---|---|
| Quadrant | DetID | PixID | Counts | Sigma | Mean | Median | Sigma |
| A | 13 | 251 | 306337 | 394.71 | 3747 | 3648 | 766.9 |
| A | 15 | 236 | 155911 | 198.55 | 3747 | 3648 | 766.9 |
| A | 15 | 174 | 103404 | 130.08 | 3747 | 3648 | 766.9 |
| B | 12 | 111 | 78586 | 104.14 | 3775 | 3682 | 719.3 |
| B | 11 | 111 | 63498 | 83.16 | 3775 | 3682 | 719.3 |
| B | 4 | 173 | 49998 | 64.39 | 3775 | 3682 | 719.3 |
| C | 12 | 4 | 29422 | 30.12 | 3684 | 3698 | 854.0 |
| C | 13 | 61 | 27660 | 28.06 | 3684 | 3698 | 854.0 |
| C | 8 | 128 | 17353 | 15.99 | 3684 | 3698 | 854.0 |
| D | 1 | 52 | 2876893 | 3213.14 | 3619 | 3534 | 894.3 |
| D | 7 | 71 | 1520466 | 1696.31 | 3619 | 3534 | 894.3 |
| D | 9 | 64 | 204666 | 224.92 | 3619 | 3534 | 894.3 |
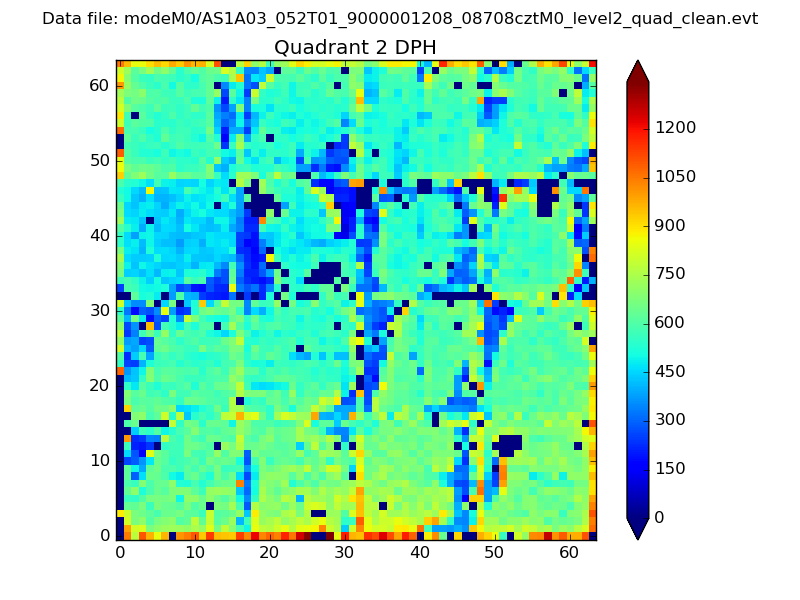
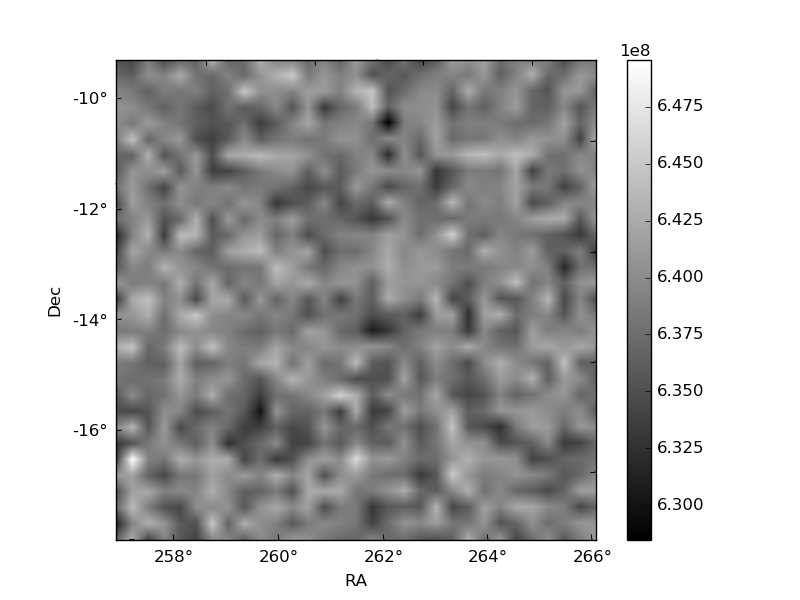
Histogram calculated using DETX and DETY for each event in the final _common_clean file
| Quadrant A | 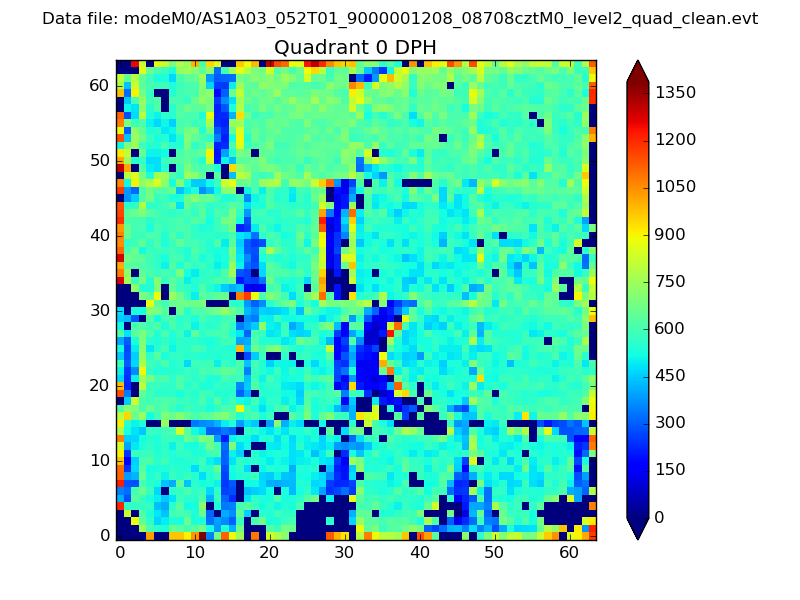 |
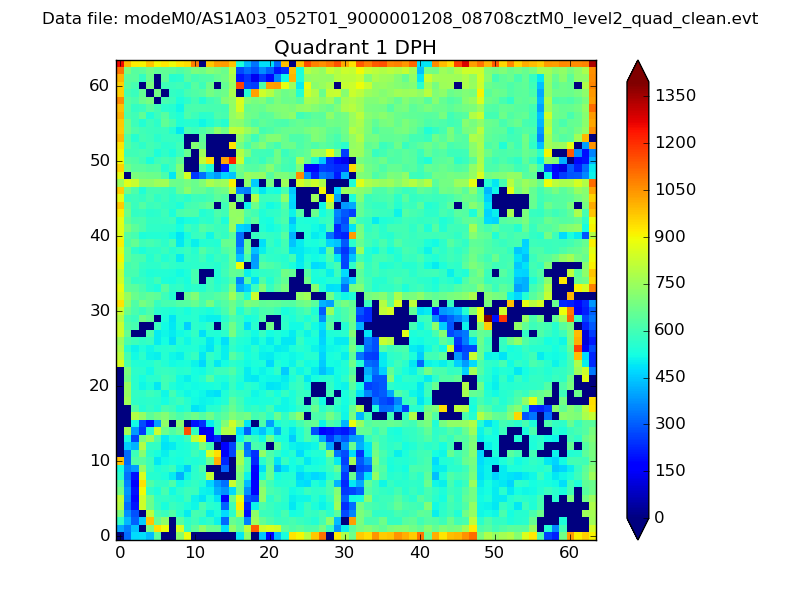 |
Quadrant B |
|---|---|---|---|
| Quadrant D | 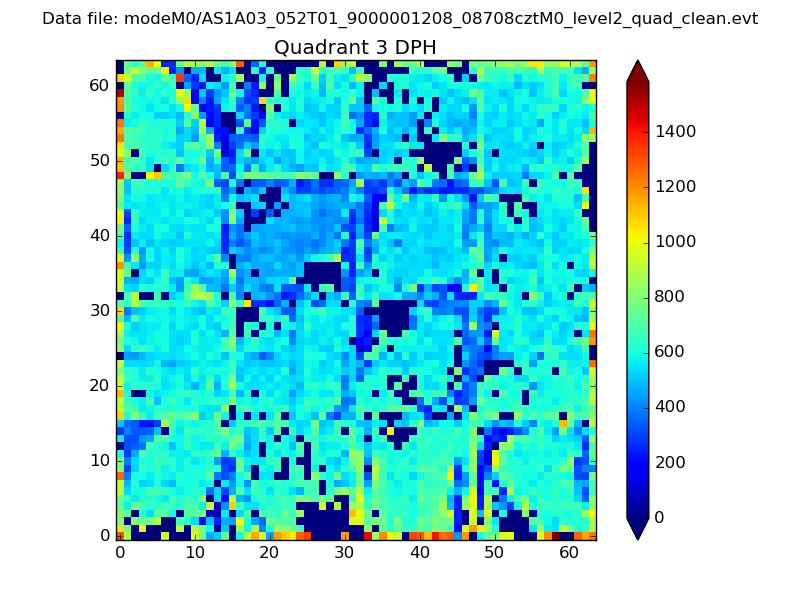 |
 |
Quadrant C |
| Plot type | Count rate plots | Images |
|---|---|---|
| Comparison with Poisson distribution Blue bars denote a histogram of data divided into 1 sec bins. Red curve is a Poisson curve with rate = median count rate of data. |
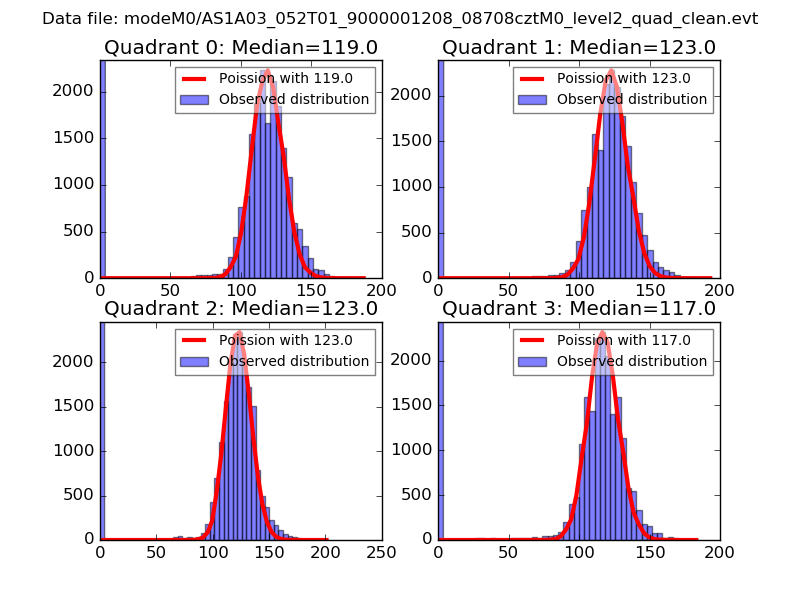 |
 |
| Quadrant-wise count rates Data is divided into 100 sec bins |
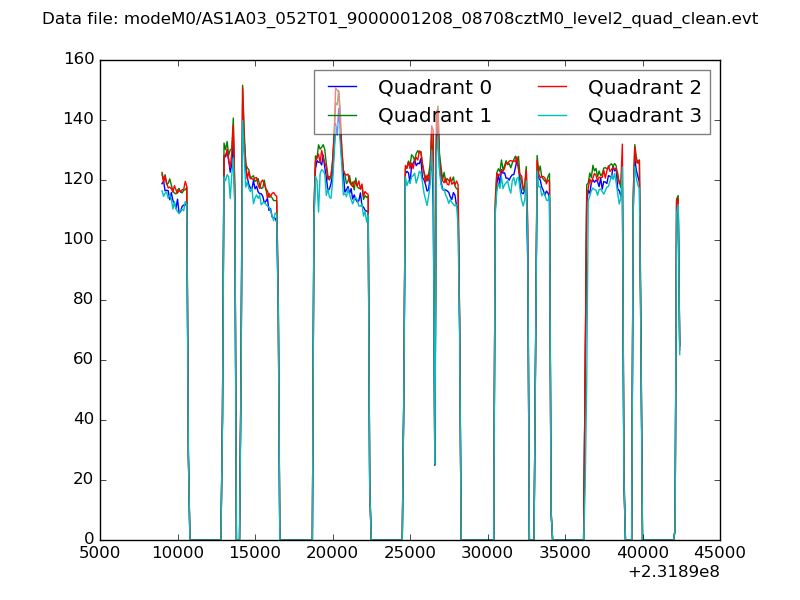 |
|
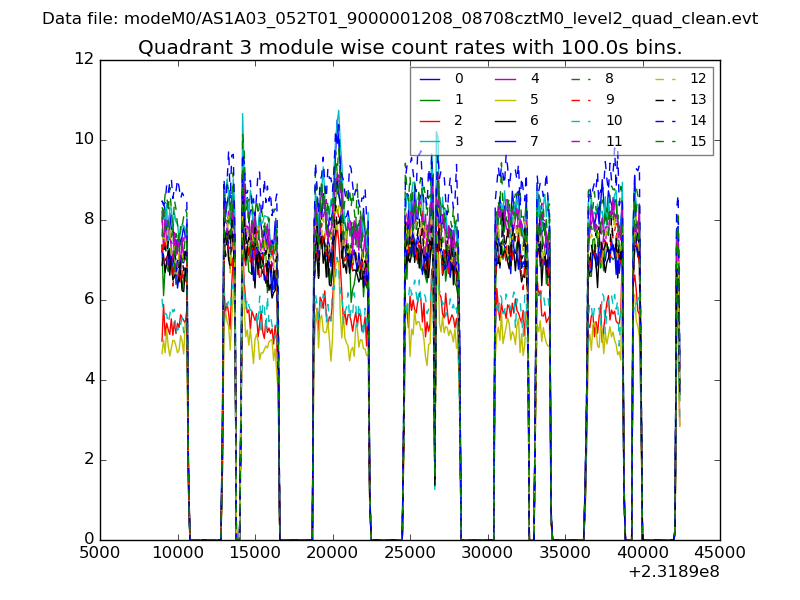
| Module-wise count rates for Quadrant A Data is divided into 100 sec bins |
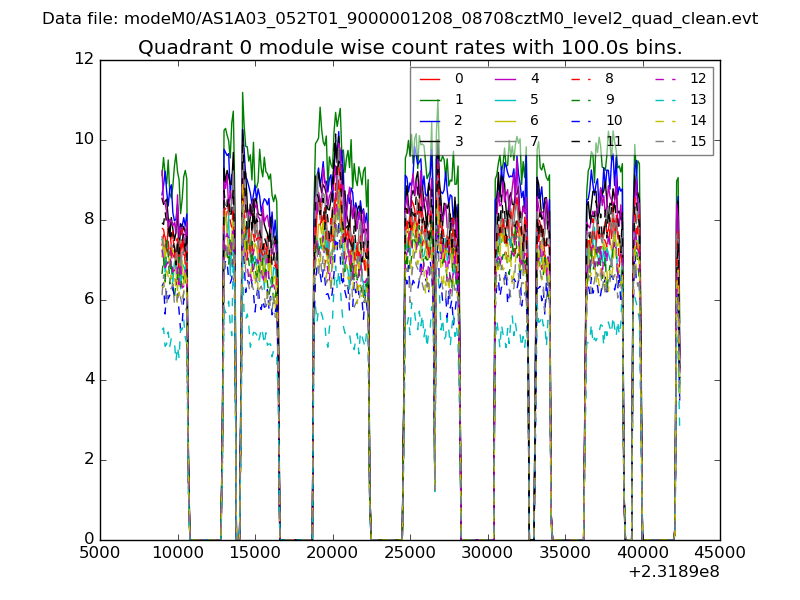 |
 |
| Module-wise count rates for Quadrant B Data is divided into 100 sec bins |
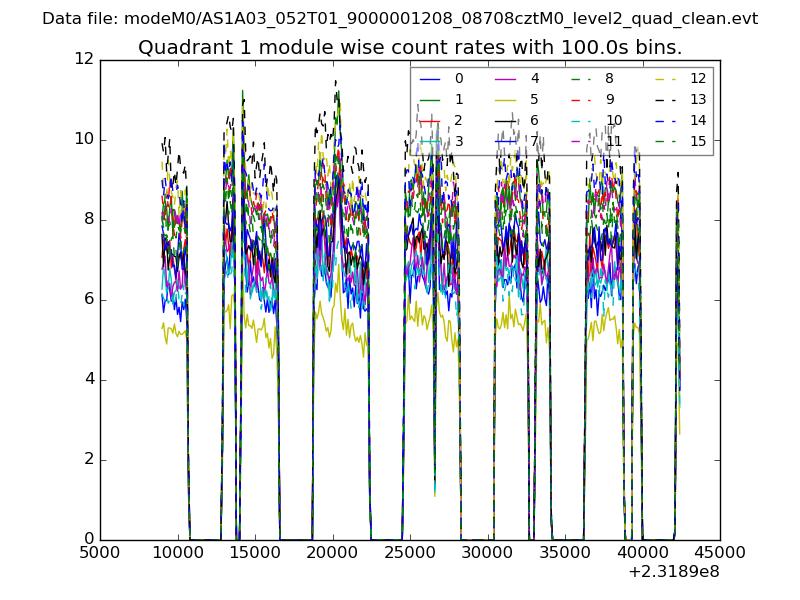 |
 |
| Module-wise count rates for Quadrant C Data is divided into 100 sec bins |
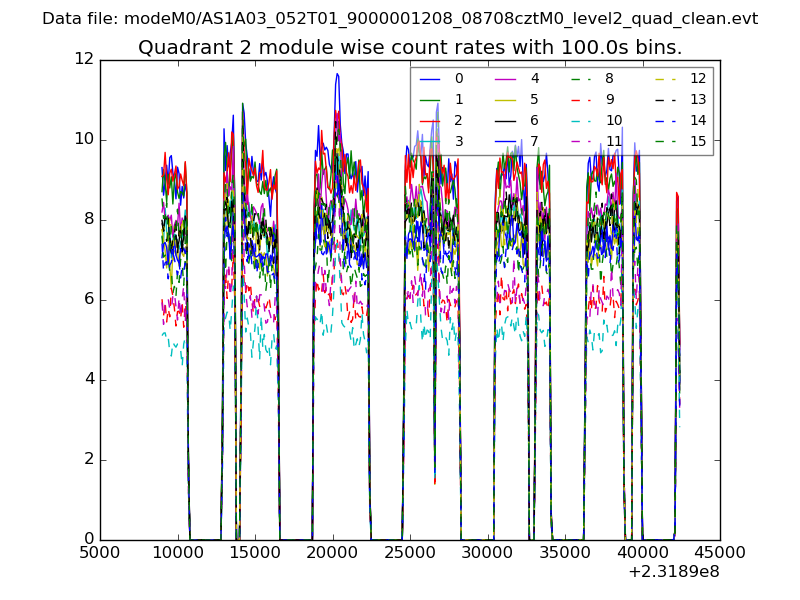 |
 |
| Module-wise count rates for Quadrant D Data is divided into 100 sec bins |
 |
 |
| Parameter | Plot |
|---|---|
| CZT HV Monitor | 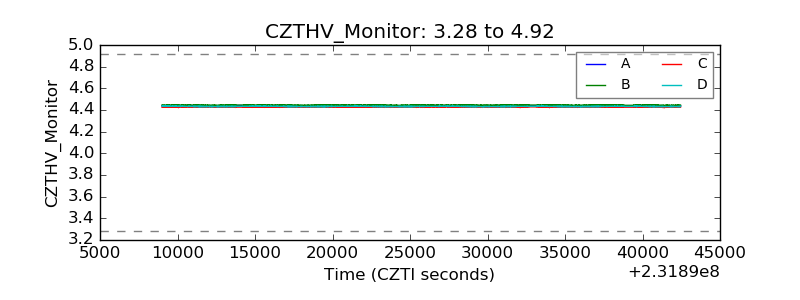 |
| D_VDD | 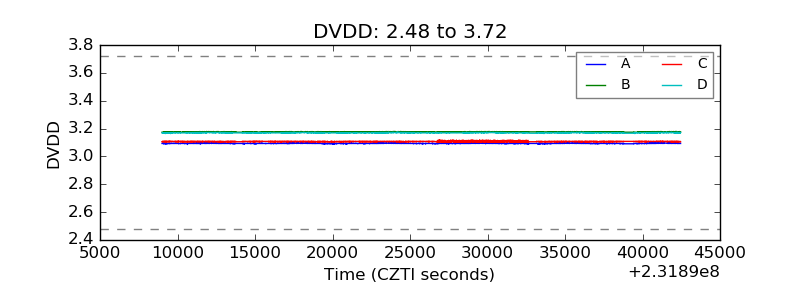 |
| Temperature 1 | 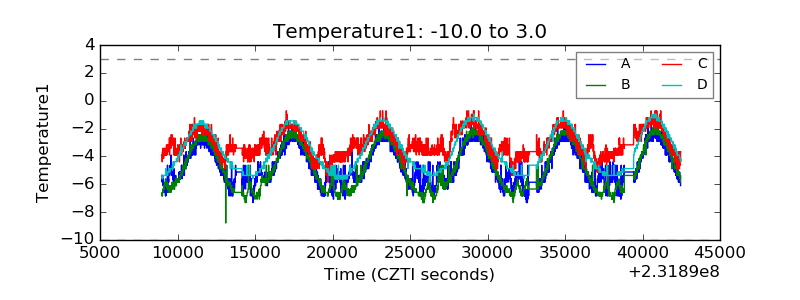 |
| Veto HV Monitor | 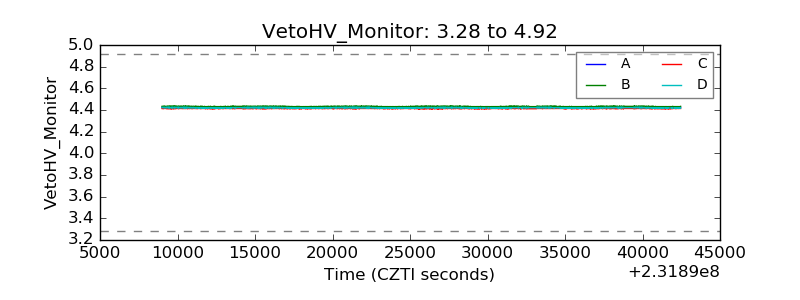 |
| Veto LLD | 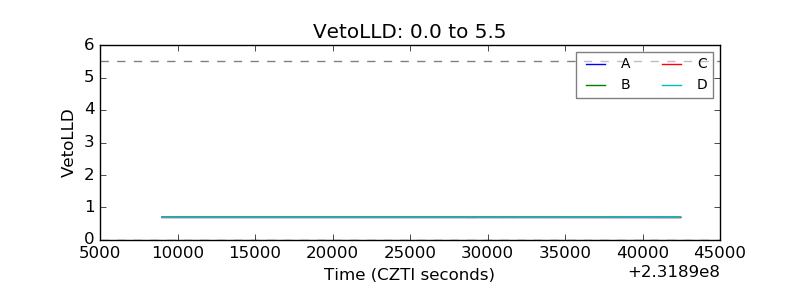 |
| Alpha Counter | 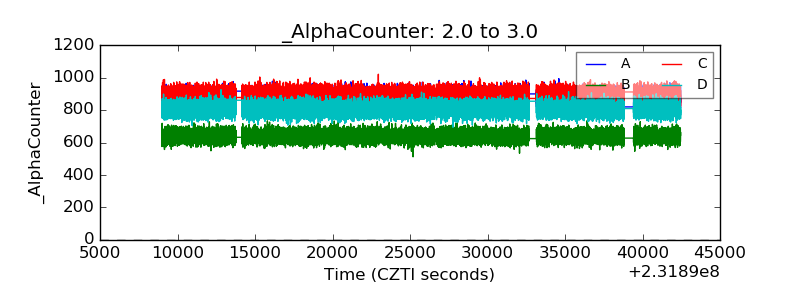 |
| _CPM_Rate | 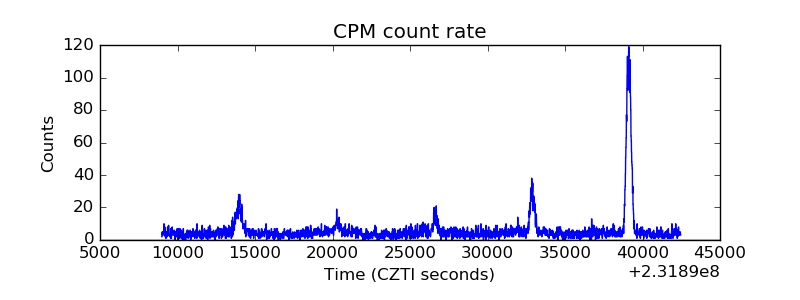 |
| CZT Counter | 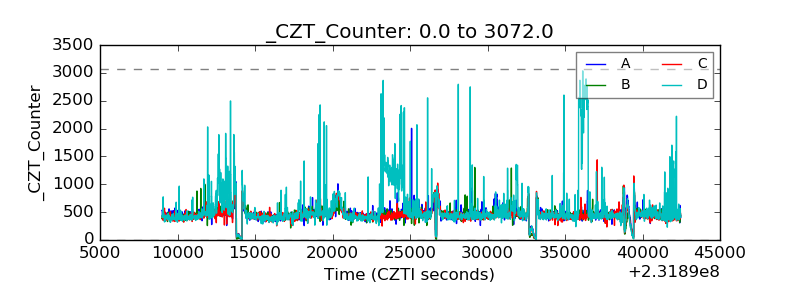 |
| +2.5 Volts monitor |  |
| +5 Volts monitor | 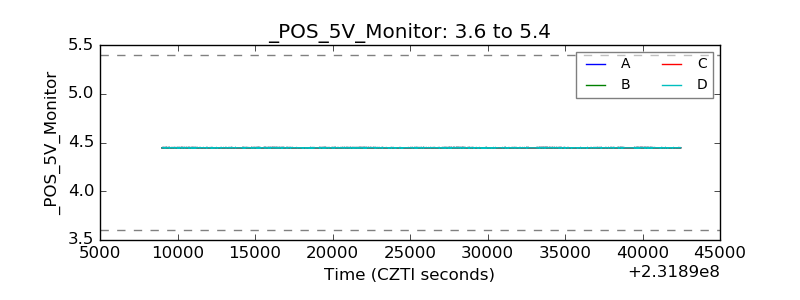 |
| _ROLL_ROT | 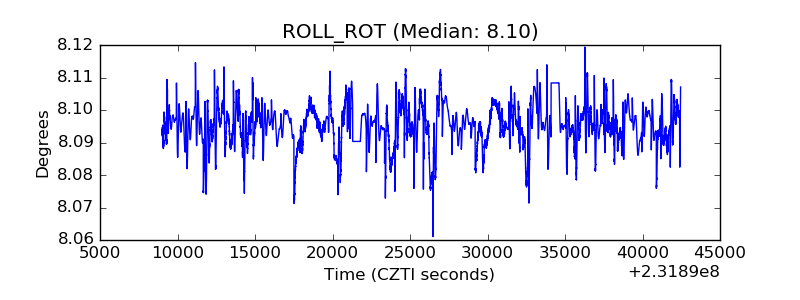 |
| _Roll_DEC | 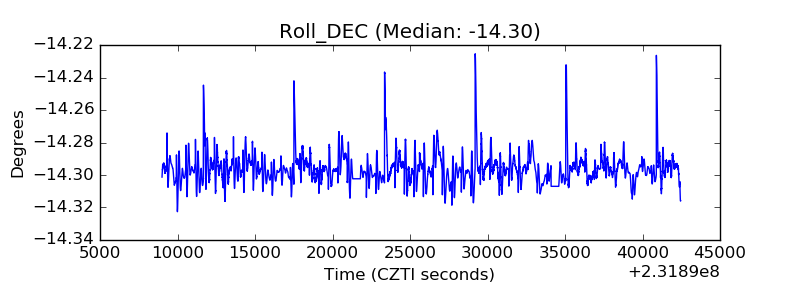 |
| _Roll_RA | 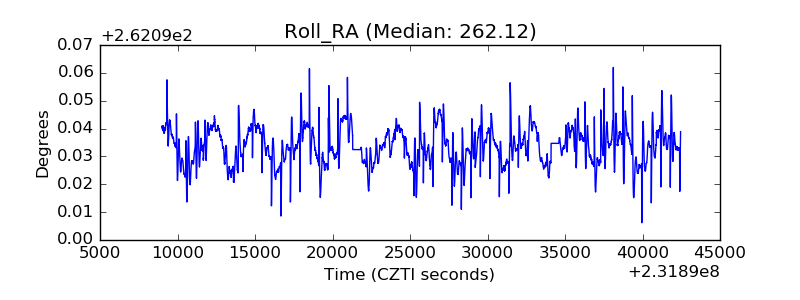 |
| Veto Counter | 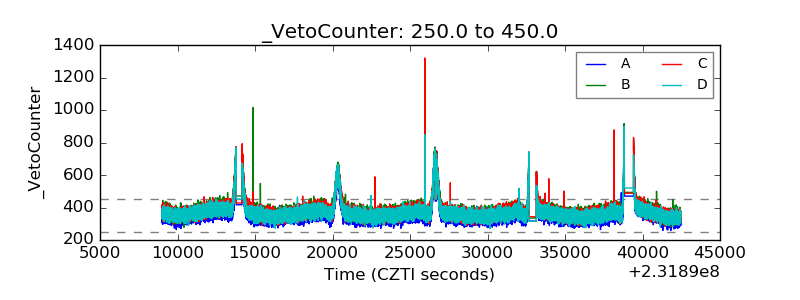 |