| Param | Original file | Final file |
|---|---|---|
| Filename | modeM0/AS1A02_132T01_9000001212cztM0_level2.fits | modeM0/AS1A02_132T01_9000001212cztM0_level2_quad_clean.evt |
| Size (bytes) | 803,280,960 | 785,165,760 |
| Size | 766.1 MB | 748.8 MB |
| Events in quadrant A | 4,847,413 | 4,653,314 |
| Events in quadrant B | 4,726,760 | 4,758,485 |
| Events in quadrant C | 4,867,628 | 4,571,831 |
| Events in quadrant D | 4,137,386 | 4,049,180 |
| Mode M0 | |||
|---|---|---|---|
| Quadrant | BADHDUFLAG | Total packets | Discarded packets |
| A | 0 | 177330 | 0 |
| B | 0 | 176158 | 0 |
| C | 0 | 173727 | 0 |
| D | 0 | 203730 | 0 |
| Mode M9 | |||
|---|---|---|---|
| Quadrant | BADHDUFLAG | Total packets | Discarded packets |
| A | 0 | 142 | 0 |
| B | 0 | 143 | 0 |
| C | 0 | 143 | 0 |
| D | 0 | 143 | 0 |
| Mode SS | |||
|---|---|---|---|
| Quadrant | BADHDUFLAG | Total packets | Discarded packets |
| A | 0 | 1700 | 0 |
| B | 0 | 1696 | 0 |
| C | 0 | 1700 | 0 |
| D | 0 | 1702 | 0 |
| Quadrant | Total seconds | Saturated seconds | Saturation percentage |
|---|---|---|---|
| A | 83833 | 1355 | 1.616309% |
| B | 83861 | 1276 | 1.521565% |
| C | 83858 | 807 | 0.962341% |
| D | 83796 | 3738 | 4.460833% |
Noise dominated data is calculated using 1-second bins in cleaned event files. If a bin has >2000 counts, and if more than 50% of those come from <1% of pixels, then it is considered to be noise-dominated and hence unusable.
| Quadrant | # 1 sec bins | Bins with >0 counts | Bins with >2000 counts | High rate bins dominated by noise | Noise dominated (total time) | Noise dominated (detector-on time) | Marked lightcurve |
|---|---|---|---|---|---|---|---|
| A | 98777 | 84236 | 0 | 0 | 0.00% | 0.00% |  |
| B | 98777 | 84225 | 0 | 0 | 0.00% | 0.00% |  |
| C | 98777 | 84234 | 0 | 0 | 0.00% | 0.00% |  |
| D | 98777 | 84142 | 0 | 0 | 0.00% | 0.00% |  |
Top three noisy pixels from each quadrant. If the there are fewer than three noisy pixels in the level2.evt file, extra rows are filled as -1
| Pixel properties | Quadrant properties | ||||||
|---|---|---|---|---|---|---|---|
| Quadrant | DetID | PixID | Counts | Sigma | Mean | Median | Sigma |
| A | 0 | 29 | 4684 | 11.08 | 1257 | 1173 | 317.0 |
| A | 7 | 110 | 4037 | 9.04 | 1257 | 1173 | 317.0 |
| A | 0 | 30 | 3655 | 7.83 | 1257 | 1173 | 317.0 |
| B | 2 | 9 | 4100 | 11.7 | 1247 | 1184 | 249.3 |
| B | 3 | 17 | 3251 | 8.29 | 1247 | 1184 | 249.3 |
| B | 2 | 8 | 3157 | 7.91 | 1247 | 1184 | 249.3 |
| C | 1 | 80 | 3712 | 7.52 | 1283 | 1193 | 335.2 |
| C | 1 | 81 | 3695 | 7.47 | 1283 | 1193 | 335.2 |
| C | 12 | 241 | 3423 | 6.65 | 1283 | 1193 | 335.2 |
| D | 6 | 231 | 3029 | 6.23 | 1177 | 1069 | 314.4 |
| D | 3 | 14 | 2955 | 6.0 | 1177 | 1069 | 314.4 |
| D | 1 | 19 | 2936 | 5.94 | 1177 | 1069 | 314.4 |
Histogram calculated using DETX and DETY for each event in the final _common_clean file
| Quadrant A | 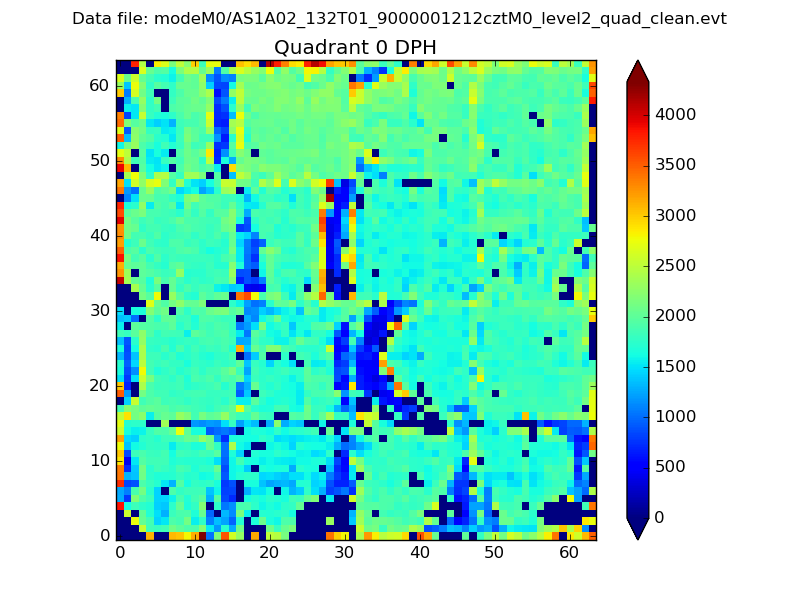 |
 |
Quadrant B |
|---|---|---|---|
| Quadrant D | 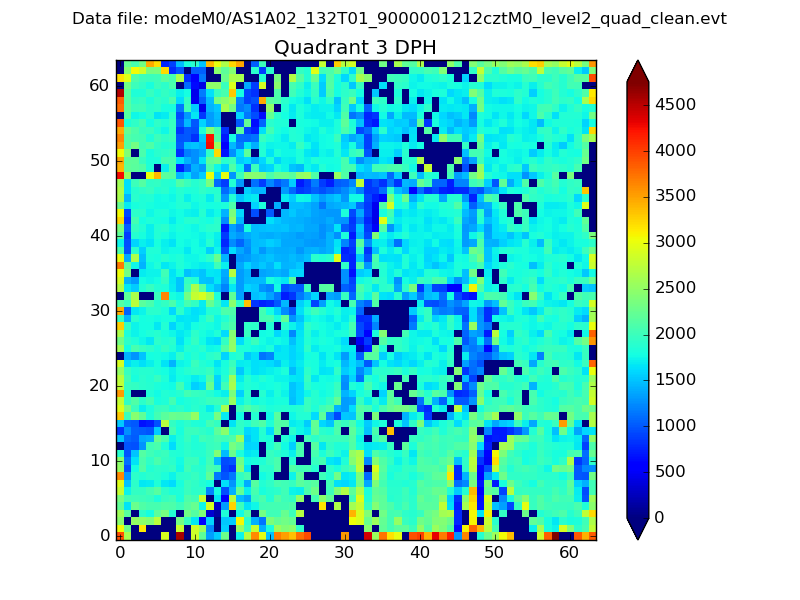 |
 |
Quadrant C |
| Plot type | Count rate plots | Images |
|---|---|---|
| Comparison with Poisson distribution Blue bars denote a histogram of data divided into 1 sec bins. Red curve is a Poisson curve with rate = median count rate of data. |
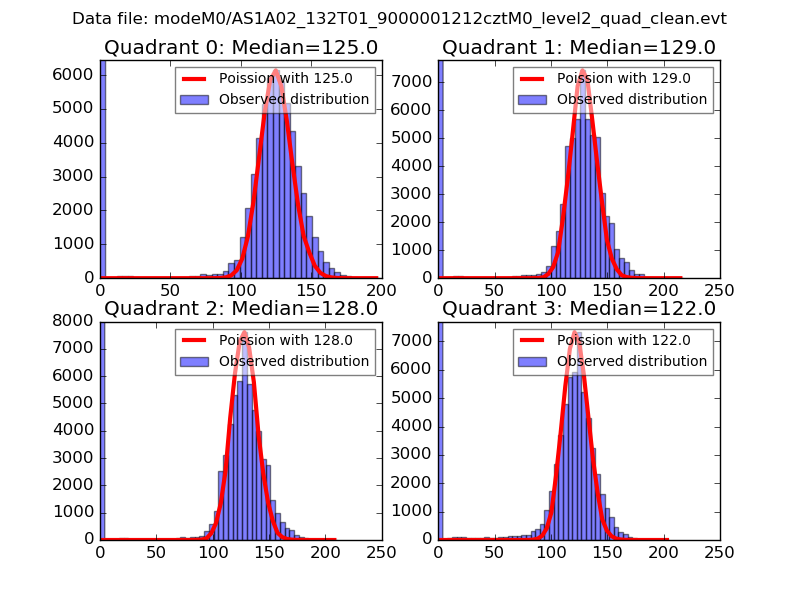 |
 |
| Quadrant-wise count rates Data is divided into 100 sec bins |
 |
|
| Module-wise count rates for Quadrant A Data is divided into 100 sec bins |
 |
 |
| Module-wise count rates for Quadrant B Data is divided into 100 sec bins |
 |
 |
| Module-wise count rates for Quadrant C Data is divided into 100 sec bins |
 |
 |
| Module-wise count rates for Quadrant D Data is divided into 100 sec bins |
 |
 |
| Parameter | Plot |
|---|---|
| CZT HV Monitor |  |
| D_VDD | 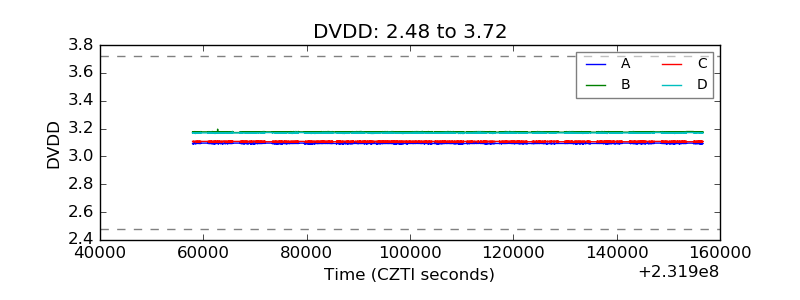 |
| Temperature 1 |  |
| Veto HV Monitor | 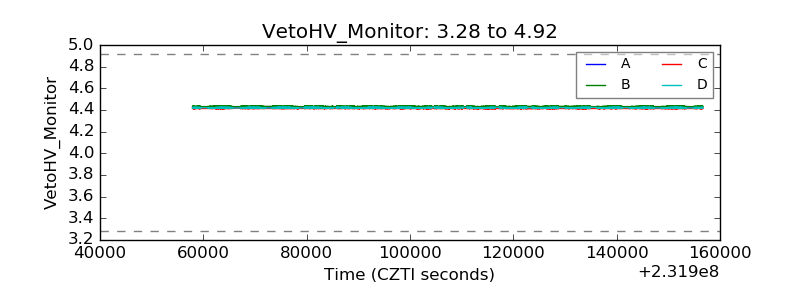 |
| Veto LLD | 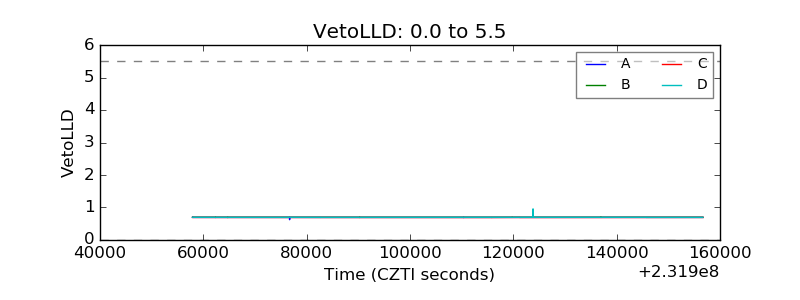 |
| Alpha Counter | 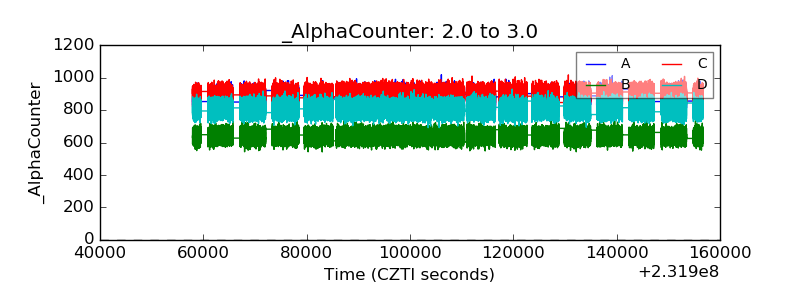 |
| _CPM_Rate | 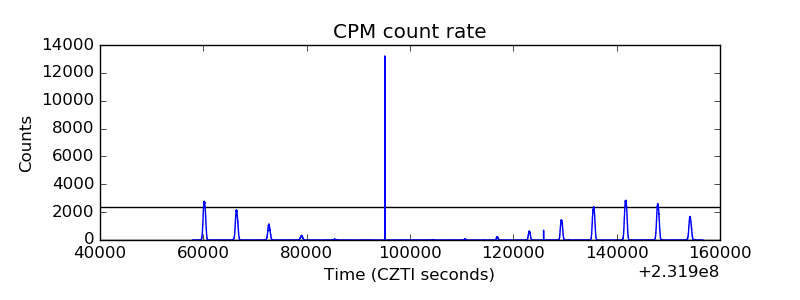 |
| CZT Counter |  |
| +2.5 Volts monitor |  |
| +5 Volts monitor |  |
| _ROLL_ROT |  |
| _Roll_DEC | 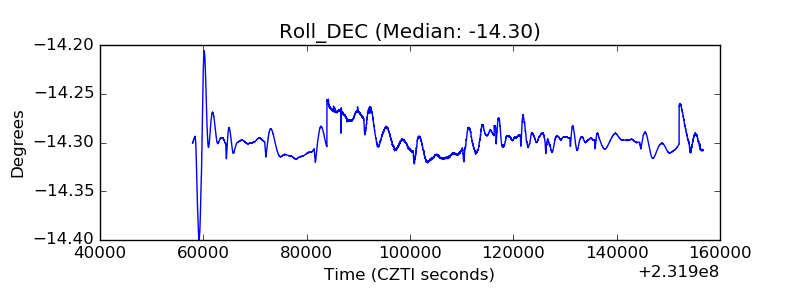 |
| _Roll_RA | 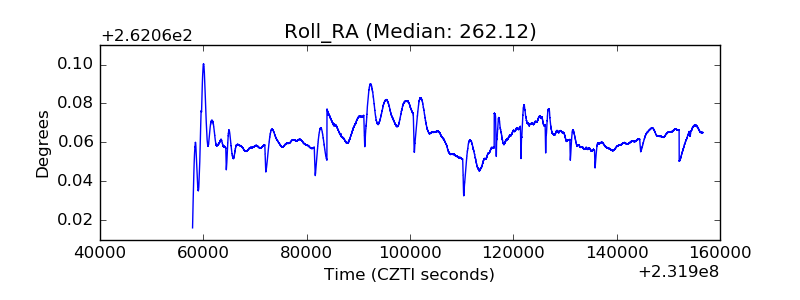 |
| Veto Counter |  |