| Param | Original file | Final file |
|---|---|---|
| Filename | modeM0/AS1A02_132T01_9000001212_08712cztM0_level2.evt | modeM0/AS1A02_132T01_9000001212_08712cztM0_level2_quad_clean.evt |
| Size (bytes) | 201,896,640 | 40,302,720 |
| Size | 192.5 MB | 38.4 MB |
| Events in quadrant A | 1,468,595 | 251,599 |
| Events in quadrant B | 1,494,963 | 261,839 |
| Events in quadrant C | 1,446,244 | 259,775 |
| Events in quadrant D | 1,514,139 | 248,514 |
| Mode M0 | |||
|---|---|---|---|
| Quadrant | BADHDUFLAG | Total packets | Discarded packets |
| A | 0 | 6015 | 2 |
| B | 0 | 6145 | 4 |
| C | 0 | 5964 | 1 |
| D | 0 | 6189 | 1 |
| Mode M9 | |||
|---|---|---|---|
| Quadrant | BADHDUFLAG | Total packets | Discarded packets |
| A | 0 | 13 | 0 |
| B | 0 | 13 | 0 |
| C | 0 | 13 | 0 |
| D | 0 | 13 | 0 |
| Mode SS | |||
|---|---|---|---|
| Quadrant | BADHDUFLAG | Total packets | Discarded packets |
| A | 0 | 58 | 0 |
| B | 0 | 58 | 0 |
| C | 0 | 58 | 0 |
| D | 0 | 58 | 0 |
| Quadrant | Total seconds | Saturated seconds | Saturation percentage |
|---|---|---|---|
| A | 2772 | 49 | 1.767677% |
| B | 2771 | 51 | 1.840491% |
| C | 2772 | 24 | 0.865801% |
| D | 2772 | 35 | 1.262626% |
Noise dominated data is calculated using 1-second bins in cleaned event files. If a bin has >2000 counts, and if more than 50% of those come from <1% of pixels, then it is considered to be noise-dominated and hence unusable.
| Quadrant | # 1 sec bins | Bins with >0 counts | Bins with >2000 counts | High rate bins dominated by noise | Noise dominated (total time) | Noise dominated (detector-on time) | Marked lightcurve |
|---|---|---|---|---|---|---|---|
| A | 4092 | 2772 | 0 | 0 | 0.00% | 0.00% | 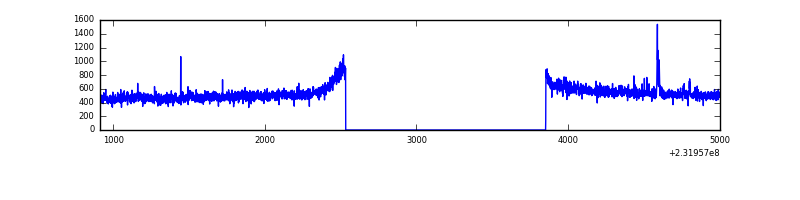 |
| B | 4092 | 2772 | 0 | 0 | 0.00% | 0.00% | 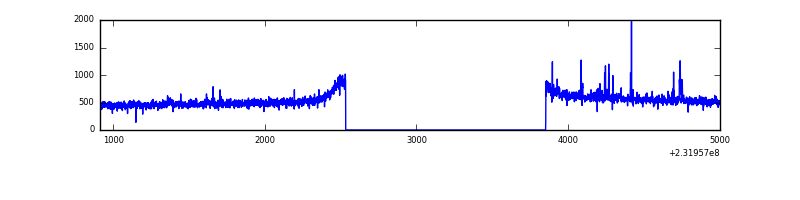 |
| C | 4092 | 2773 | 0 | 0 | 0.00% | 0.00% | 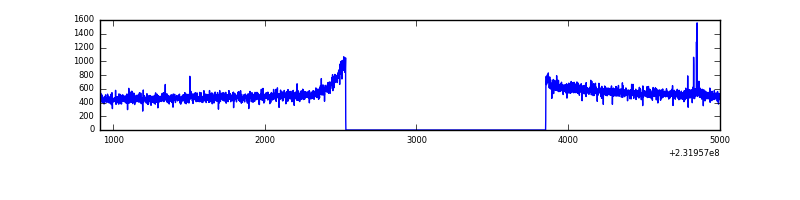 |
| D | 4092 | 2773 | 9 | 9 | 0.22% | 0.32% | 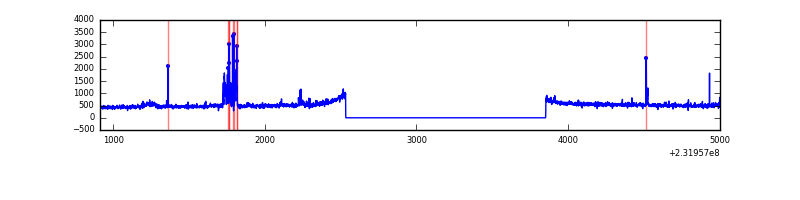 |
Top three noisy pixels from each quadrant. If the there are fewer than three noisy pixels in the level2.evt file, extra rows are filled as -1
| Pixel properties | Quadrant properties | ||||||
|---|---|---|---|---|---|---|---|
| Quadrant | DetID | PixID | Counts | Sigma | Mean | Median | Sigma |
| A | 15 | 174 | 13714 | 172.12 | 375 | 368 | 77.5 |
| A | 13 | 251 | 10151 | 126.17 | 375 | 368 | 77.5 |
| A | 0 | 226 | 3549 | 41.02 | 375 | 368 | 77.5 |
| B | 4 | 173 | 17846 | 239.14 | 377 | 369 | 73.1 |
| B | 12 | 111 | 7456 | 96.97 | 377 | 369 | 73.1 |
| B | 11 | 111 | 6146 | 79.05 | 377 | 369 | 73.1 |
| C | 14 | 234 | 5212 | 56.01 | 369 | 371 | 86.4 |
| C | 13 | 61 | 2793 | 28.02 | 369 | 371 | 86.4 |
| C | 12 | 4 | 1319 | 10.97 | 369 | 371 | 86.4 |
| D | 12 | 233 | 66938 | 749.36 | 366 | 357 | 88.9 |
| D | 1 | 52 | 42212 | 471.07 | 366 | 357 | 88.9 |
| D | 2 | 234 | 10740 | 116.86 | 366 | 357 | 88.9 |
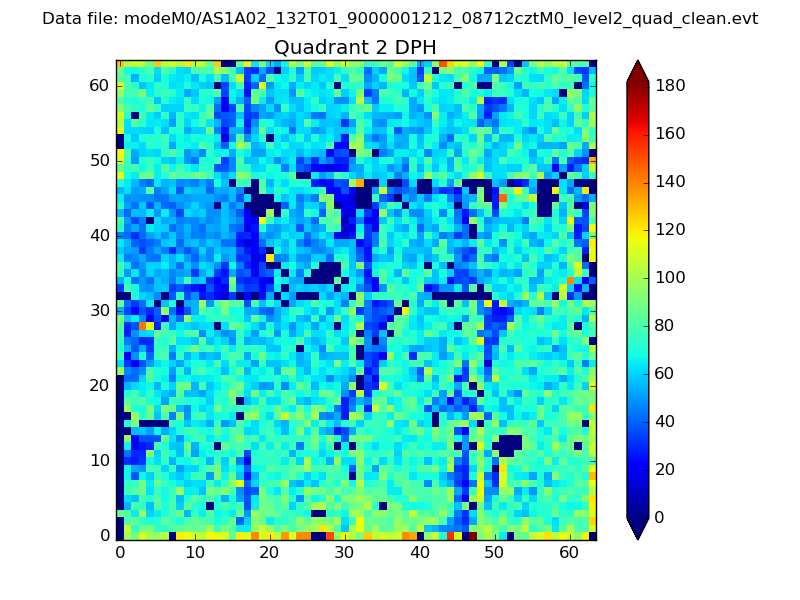
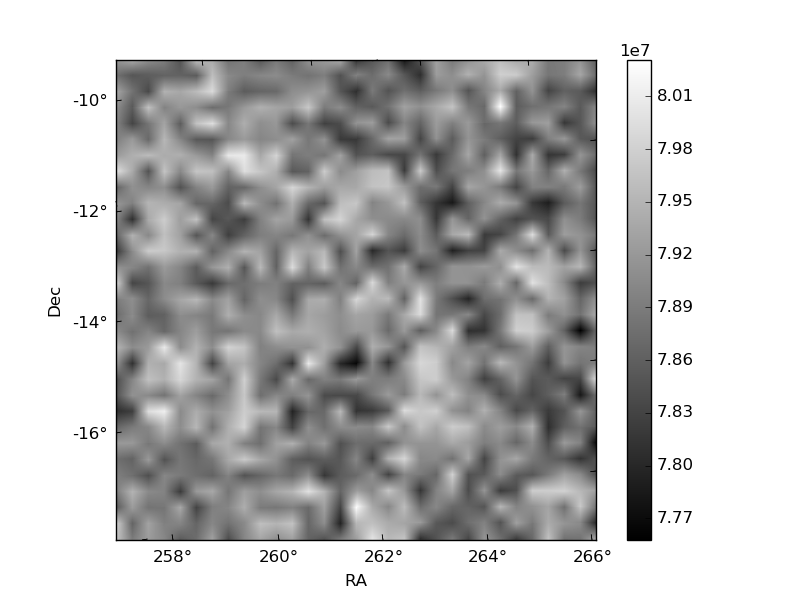
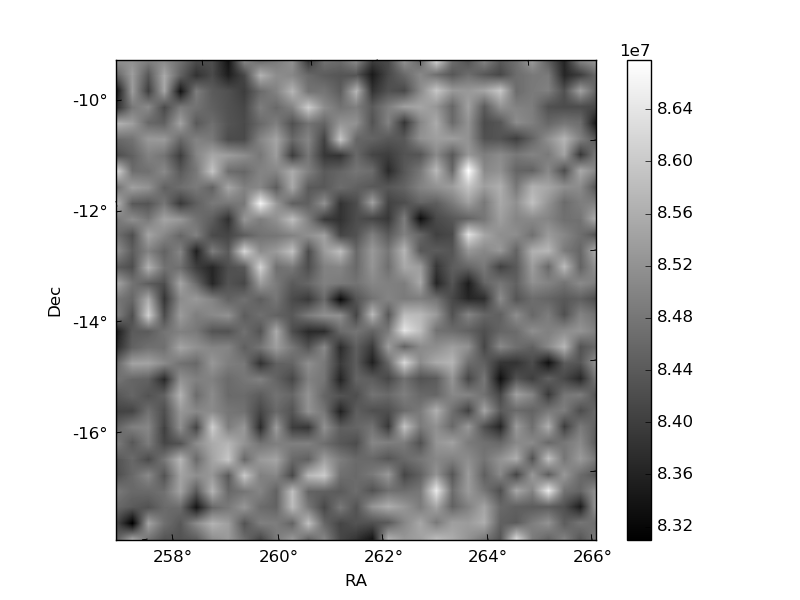
Histogram calculated using DETX and DETY for each event in the final _common_clean file
| Quadrant A | 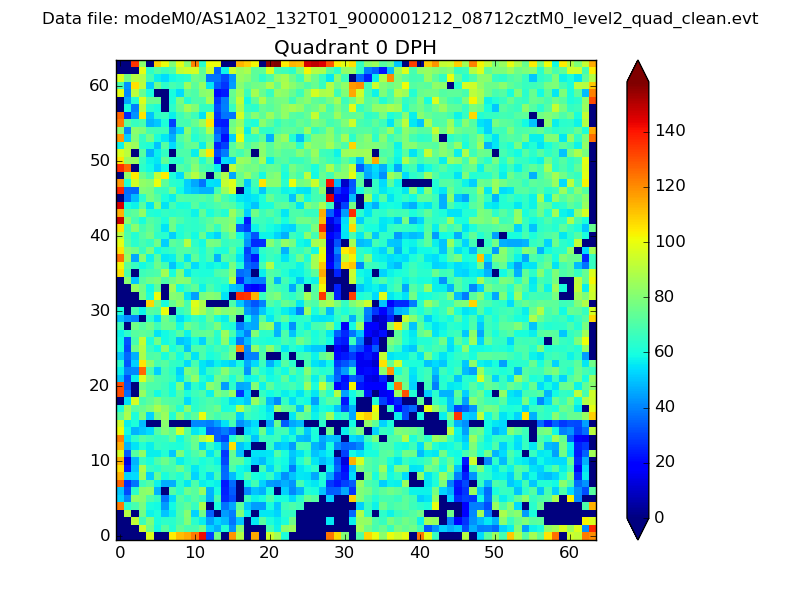 |
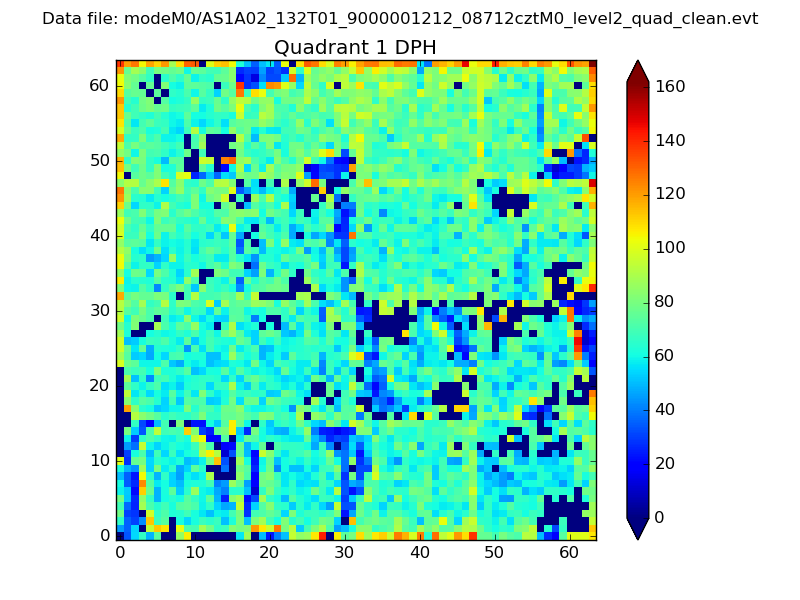 |
Quadrant B |
|---|---|---|---|
| Quadrant D | 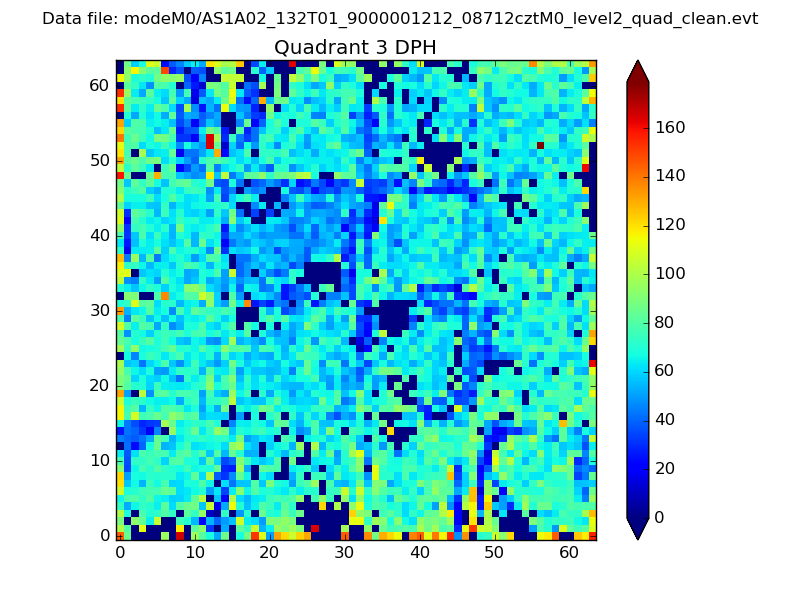 |
 |
Quadrant C |
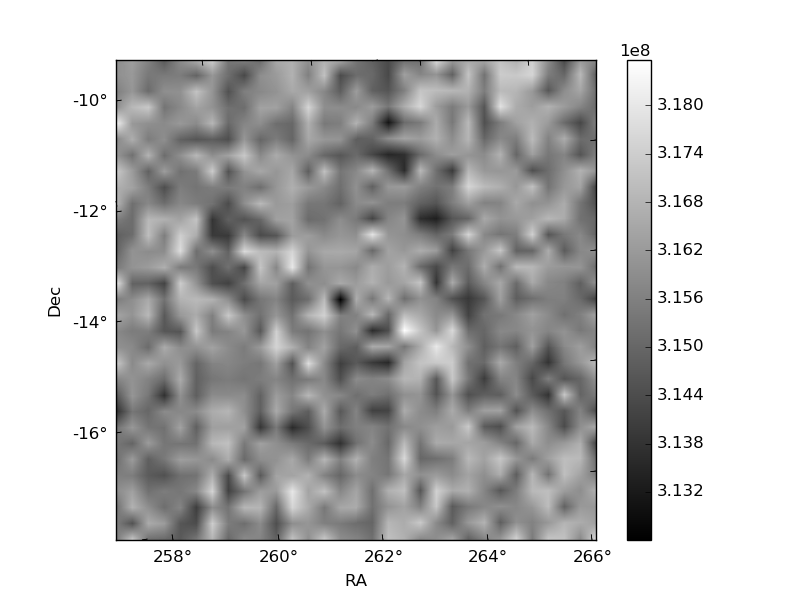
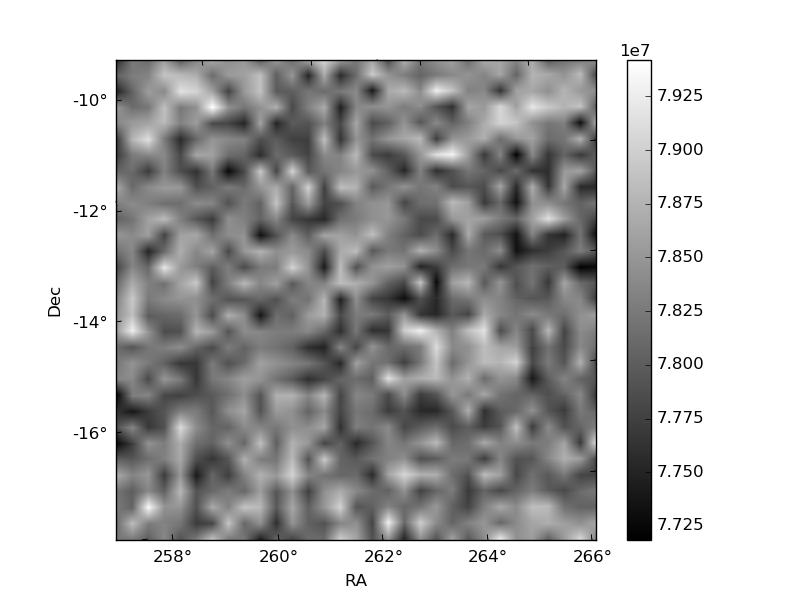
| Plot type | Count rate plots | Images |
|---|---|---|
| Comparison with Poisson distribution Blue bars denote a histogram of data divided into 1 sec bins. Red curve is a Poisson curve with rate = median count rate of data. |
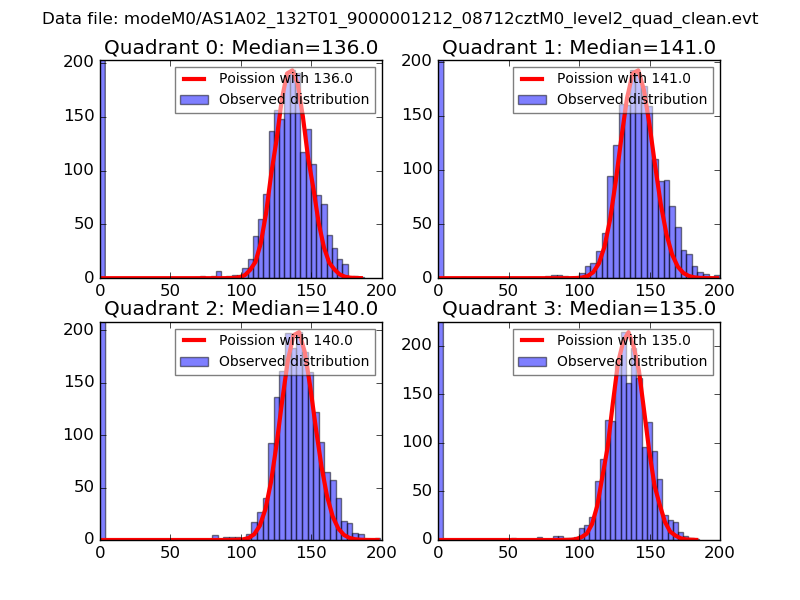 |
 |
| Quadrant-wise count rates Data is divided into 100 sec bins |
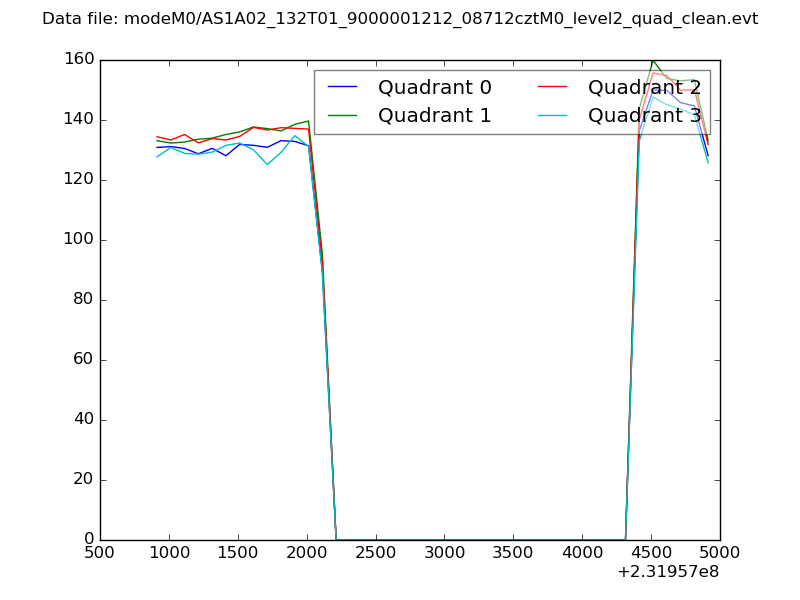 |
|
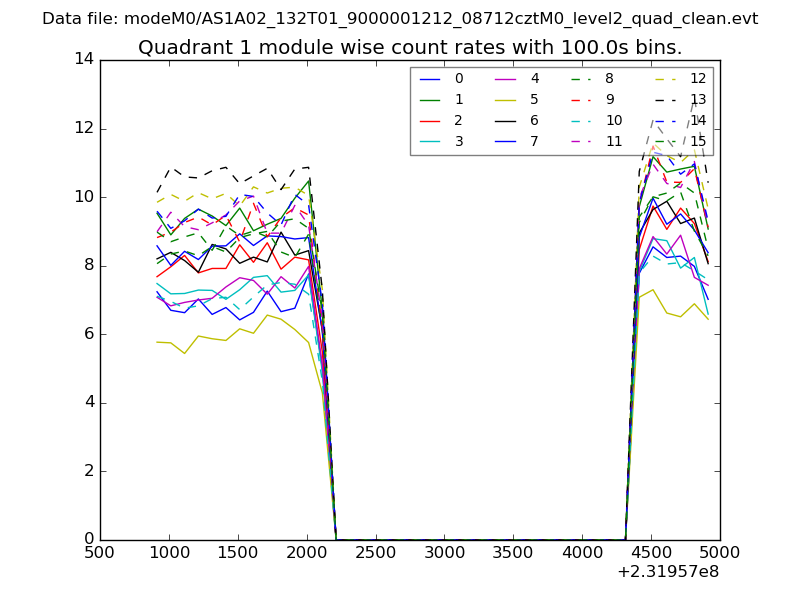
| Module-wise count rates for Quadrant A Data is divided into 100 sec bins |
 |
 |
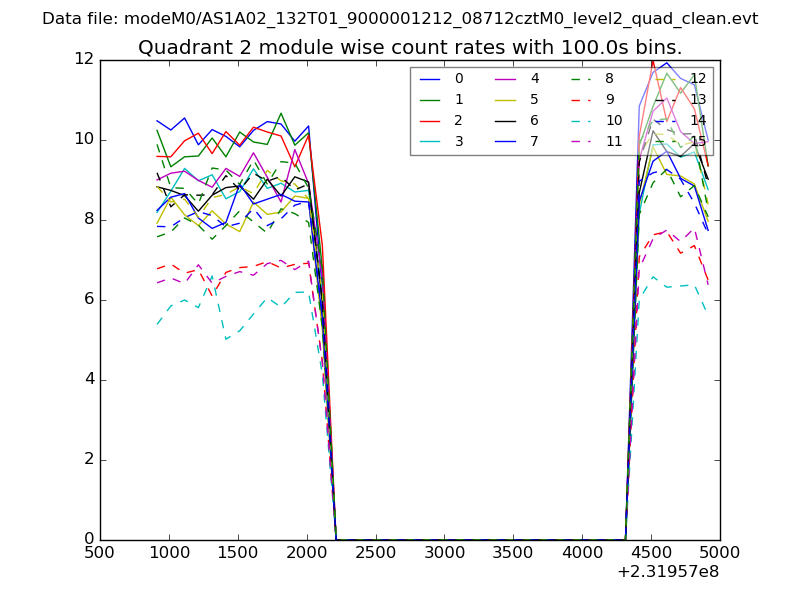
| Module-wise count rates for Quadrant B Data is divided into 100 sec bins |
 |
 |
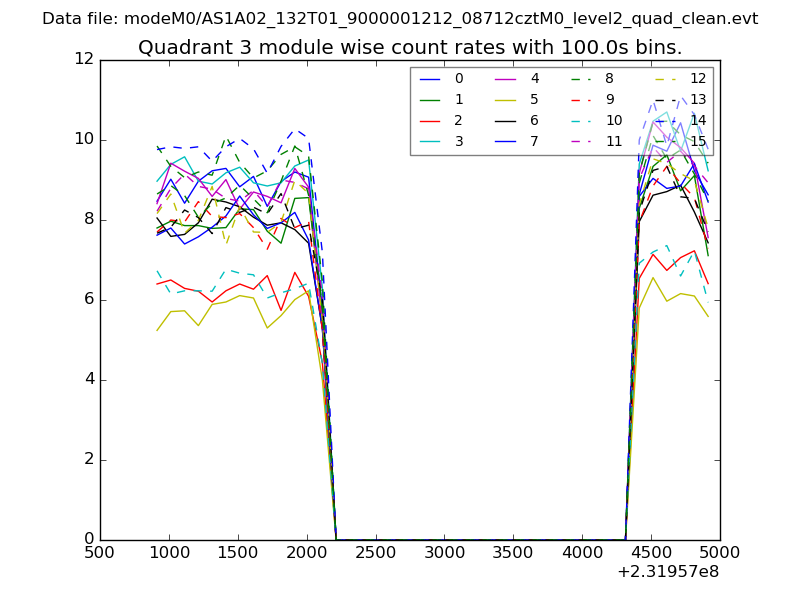
| Module-wise count rates for Quadrant C Data is divided into 100 sec bins |
 |
 |
| Module-wise count rates for Quadrant D Data is divided into 100 sec bins |
 |
 |
| Parameter | Plot |
|---|---|
| CZT HV Monitor | 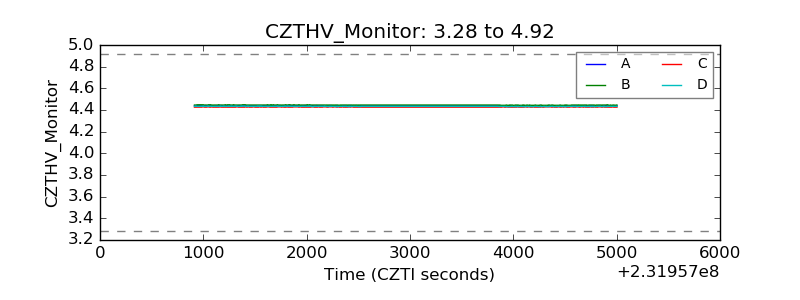 |
| D_VDD | 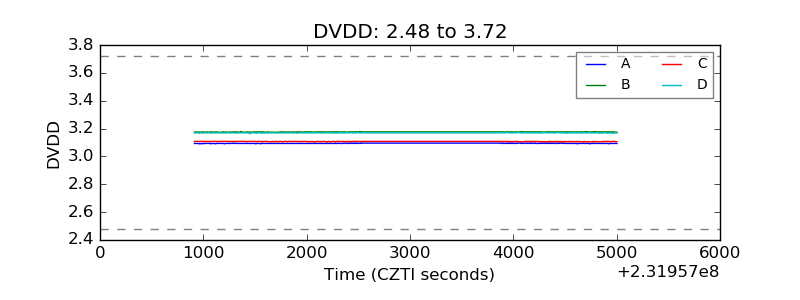 |
| Temperature 1 | 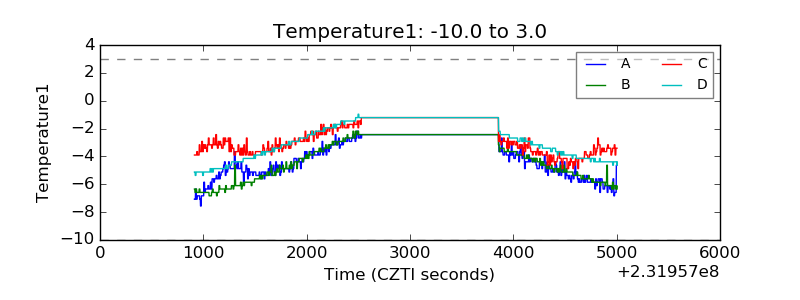 |
| Veto HV Monitor | 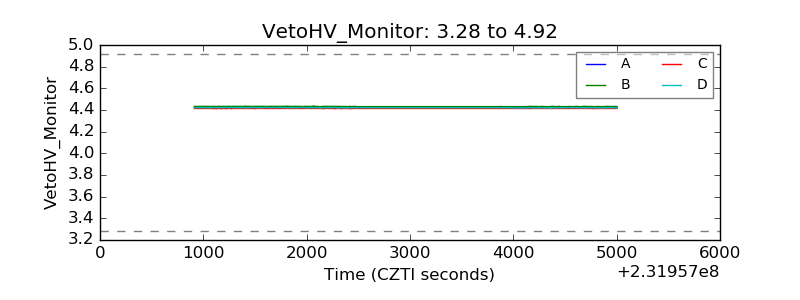 |
| Veto LLD | 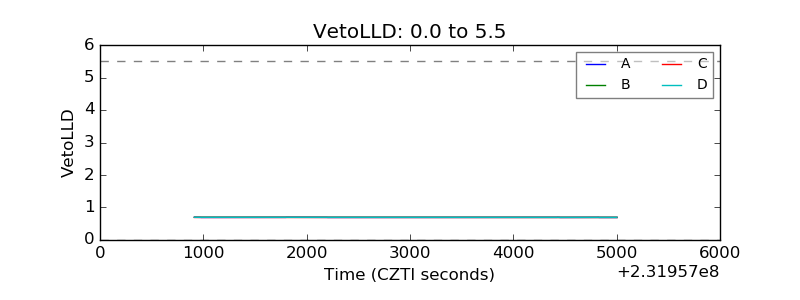 |
| Alpha Counter | 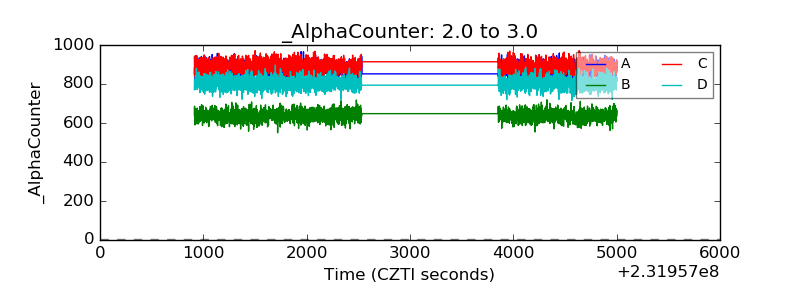 |
| _CPM_Rate | 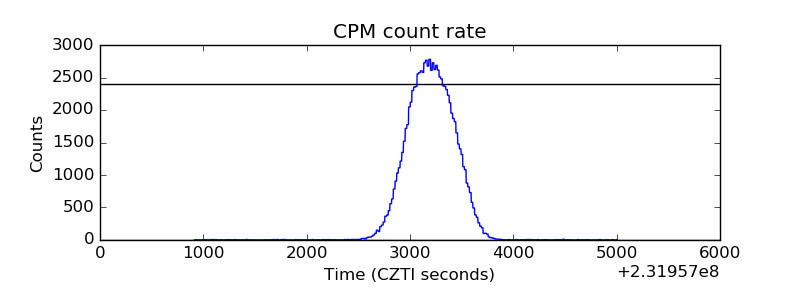 |
| CZT Counter | 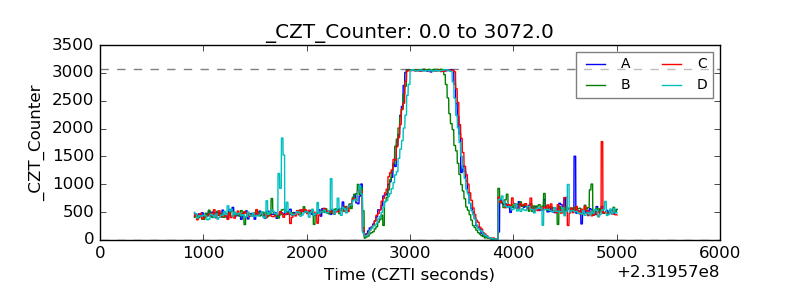 |
| +2.5 Volts monitor |  |
| +5 Volts monitor |  |
| _ROLL_ROT | 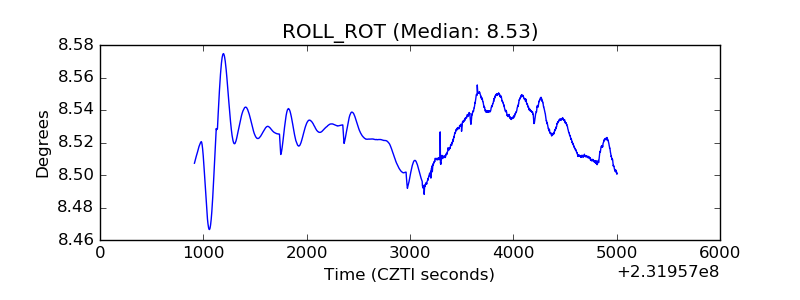 |
| _Roll_DEC | 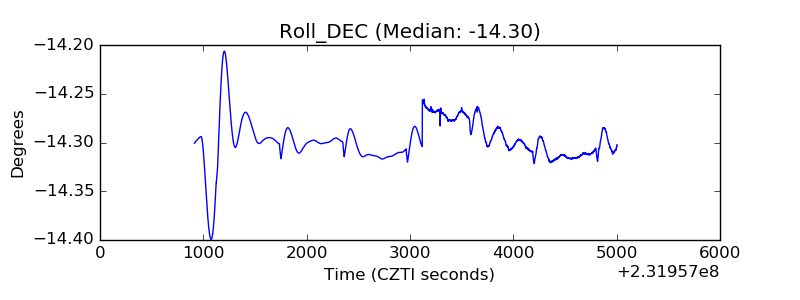 |
| _Roll_RA | 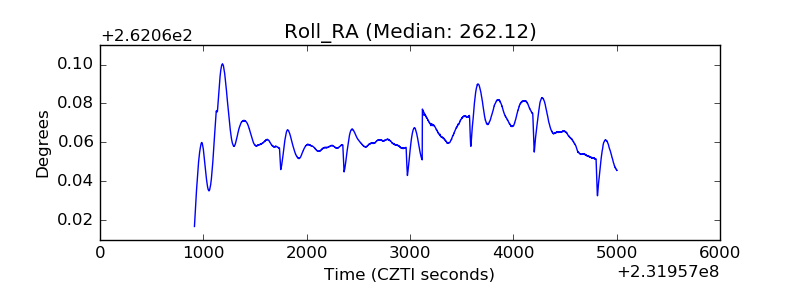 |
| Veto Counter | 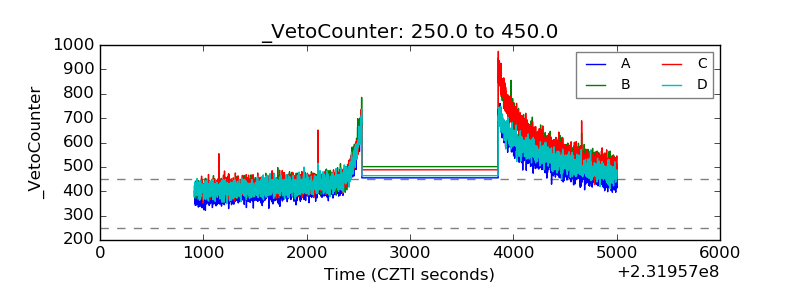 |