| Param | Original file | Final file |
|---|---|---|
| Filename | modeM0/AS1A02_132T01_9000001212_08715cztM0_level2.evt | modeM0/AS1A02_132T01_9000001212_08715cztM0_level2_quad_clean.evt |
| Size (bytes) | 418,446,720 | 94,063,680 |
| Size | 399.1 MB | 89.7 MB |
| Events in quadrant A | 3,051,055 | 593,612 |
| Events in quadrant B | 3,085,621 | 616,644 |
| Events in quadrant C | 3,021,120 | 611,283 |
| Events in quadrant D | 3,078,787 | 579,863 |
| Mode M0 | |||
|---|---|---|---|
| Quadrant | BADHDUFLAG | Total packets | Discarded packets |
| A | 0 | 13393 | 3 |
| B | 0 | 13359 | 2 |
| C | 0 | 13262 | 2 |
| D | 0 | 13646 | 2 |
| Mode M9 | |||
|---|---|---|---|
| Quadrant | BADHDUFLAG | Total packets | Discarded packets |
| A | 0 | 14 | 0 |
| B | 0 | 14 | 0 |
| C | 0 | 14 | 0 |
| D | 0 | 15 | 0 |
| Mode SS | |||
|---|---|---|---|
| Quadrant | BADHDUFLAG | Total packets | Discarded packets |
| A | 0 | 128 | 0 |
| B | 0 | 128 | 0 |
| C | 0 | 128 | 0 |
| D | 0 | 128 | 0 |
| Quadrant | Total seconds | Saturated seconds | Saturation percentage |
|---|---|---|---|
| A | 6418 | 26 | 0.405111% |
| B | 6418 | 32 | 0.498598% |
| C | 6418 | 14 | 0.218136% |
| D | 6418 | 21 | 0.327205% |
Noise dominated data is calculated using 1-second bins in cleaned event files. If a bin has >2000 counts, and if more than 50% of those come from <1% of pixels, then it is considered to be noise-dominated and hence unusable.
| Quadrant | # 1 sec bins | Bins with >0 counts | Bins with >2000 counts | High rate bins dominated by noise | Noise dominated (total time) | Noise dominated (detector-on time) | Marked lightcurve |
|---|---|---|---|---|---|---|---|
| A | 7478 | 6419 | 4 | 4 | 0.05% | 0.06% | 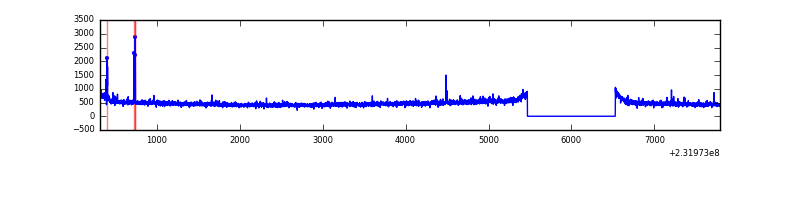 |
| B | 7478 | 6419 | 1 | 1 | 0.01% | 0.02% | 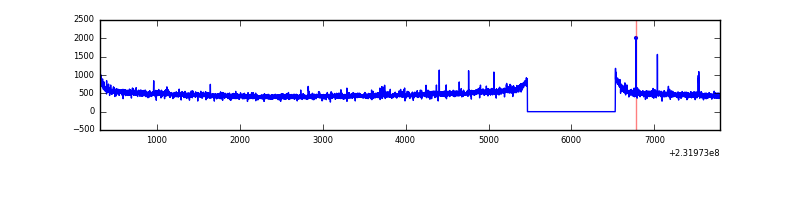 |
| C | 7478 | 6419 | 1 | 1 | 0.01% | 0.02% | 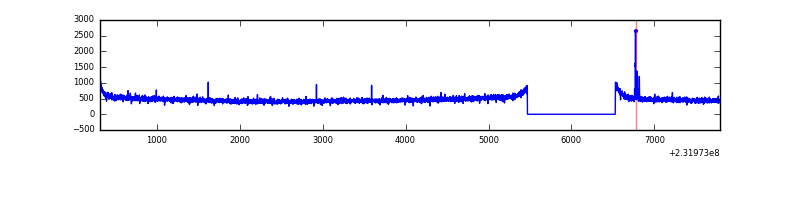 |
| D | 7478 | 6419 | 13 | 13 | 0.17% | 0.20% | 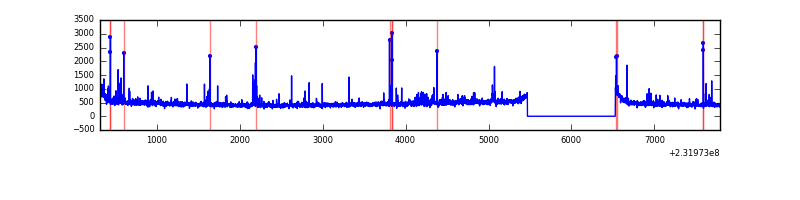 |
Top three noisy pixels from each quadrant. If the there are fewer than three noisy pixels in the level2.evt file, extra rows are filled as -1
| Pixel properties | Quadrant properties | ||||||
|---|---|---|---|---|---|---|---|
| Quadrant | DetID | PixID | Counts | Sigma | Mean | Median | Sigma |
| A | 13 | 251 | 42844 | 265.28 | 774 | 756 | 158.7 |
| A | 13 | 248 | 20992 | 127.55 | 774 | 756 | 158.7 |
| A | 15 | 174 | 12413 | 73.47 | 774 | 756 | 158.7 |
| B | 12 | 111 | 16135 | 101.69 | 786 | 767 | 151.1 |
| B | 11 | 111 | 12868 | 80.07 | 786 | 767 | 151.1 |
| B | 10 | 246 | 12489 | 77.57 | 786 | 767 | 151.1 |
| C | 14 | 234 | 15763 | 83.45 | 769 | 774 | 179.6 |
| C | 13 | 61 | 5611 | 26.93 | 769 | 774 | 179.6 |
| C | 12 | 4 | 3381 | 14.51 | 769 | 774 | 179.6 |
| D | 1 | 52 | 101880 | 550.5 | 755 | 737 | 183.7 |
| D | 2 | 152 | 36803 | 196.3 | 755 | 737 | 183.7 |
| D | 2 | 14 | 24131 | 127.33 | 755 | 737 | 183.7 |
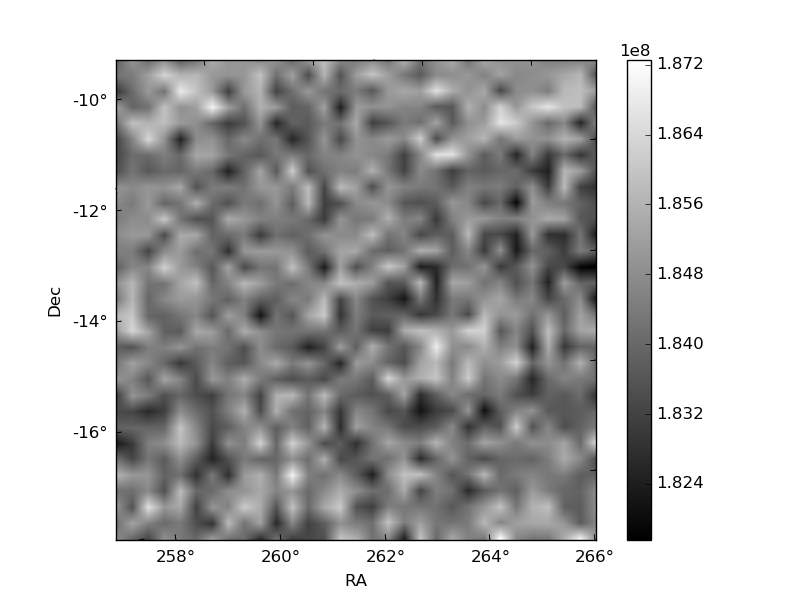
Histogram calculated using DETX and DETY for each event in the final _common_clean file
| Quadrant A | 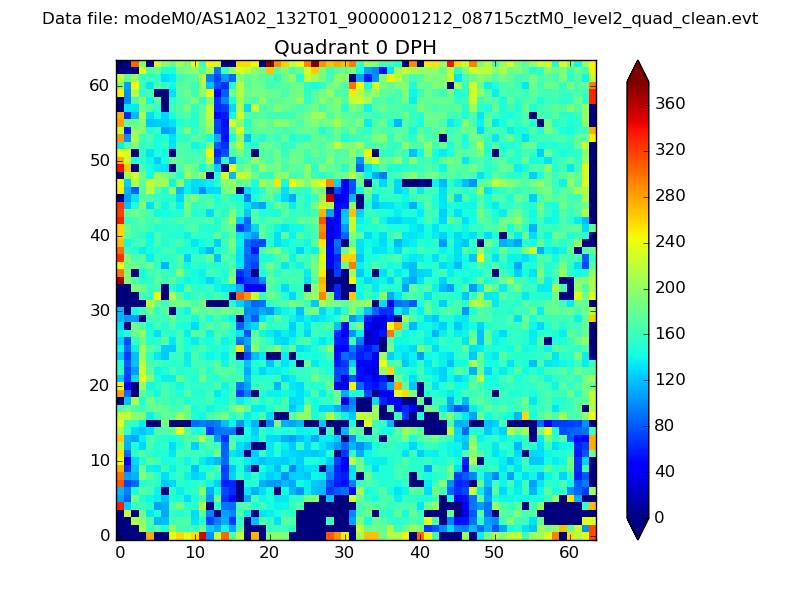 |
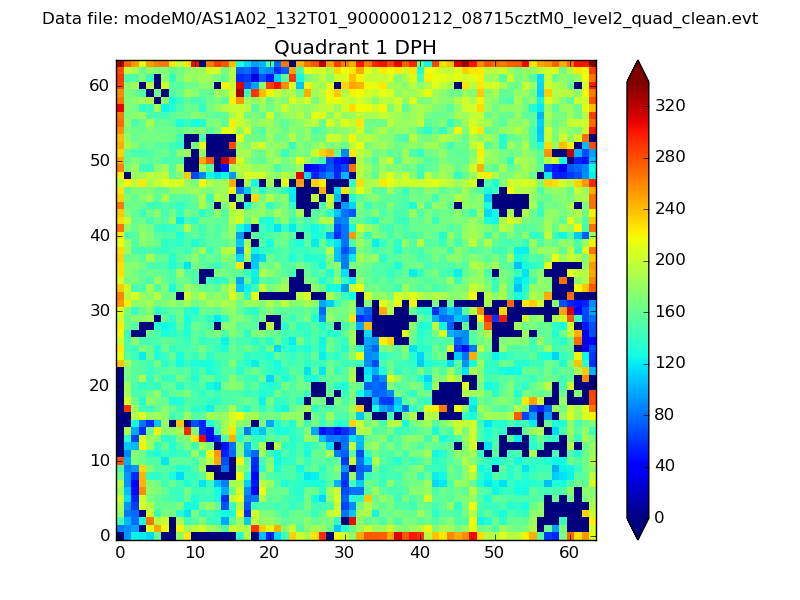 |
Quadrant B |
|---|---|---|---|
| Quadrant D |  |
 |
Quadrant C |
| Plot type | Count rate plots | Images |
|---|---|---|
| Comparison with Poisson distribution Blue bars denote a histogram of data divided into 1 sec bins. Red curve is a Poisson curve with rate = median count rate of data. |
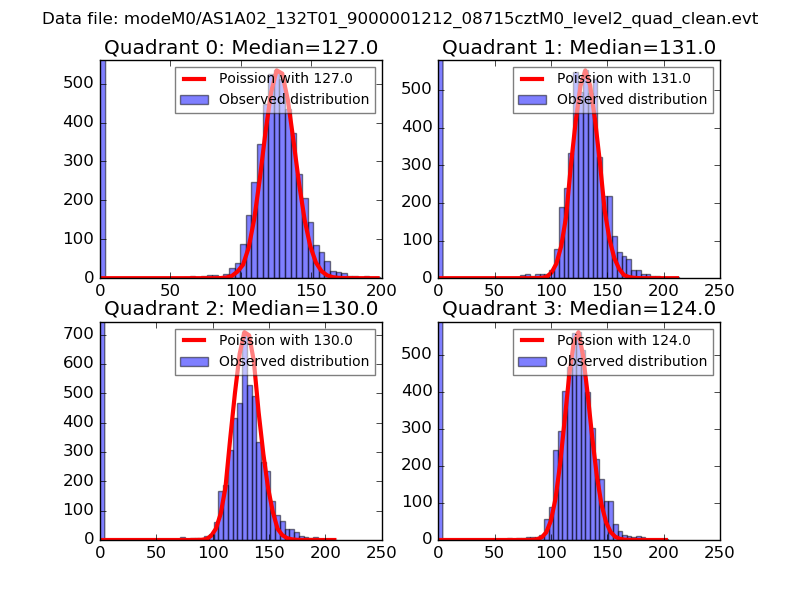 |
 |
| Quadrant-wise count rates Data is divided into 100 sec bins |
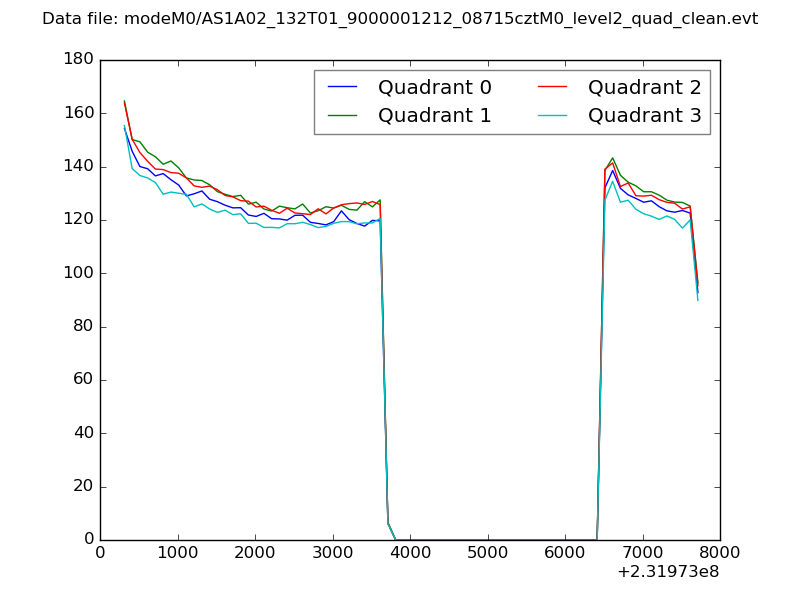 |
|
| Module-wise count rates for Quadrant A Data is divided into 100 sec bins |
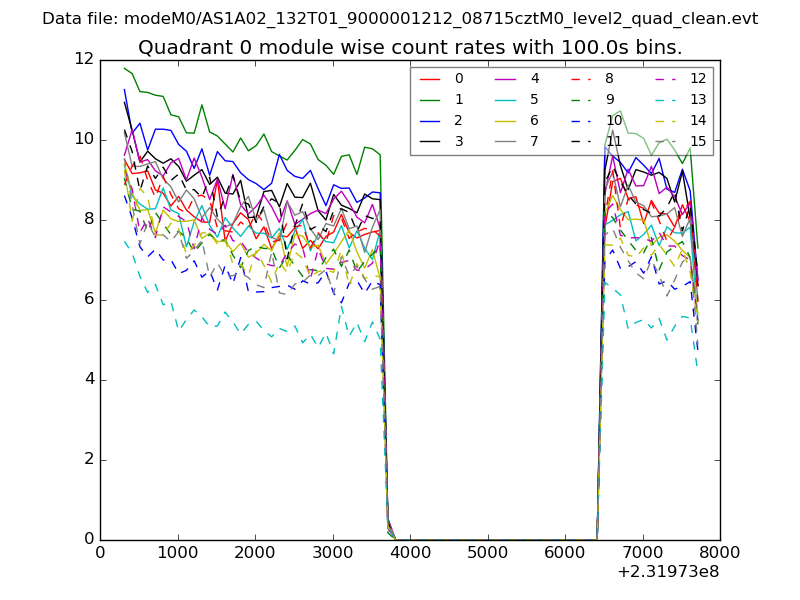 |
 |
| Module-wise count rates for Quadrant B Data is divided into 100 sec bins |
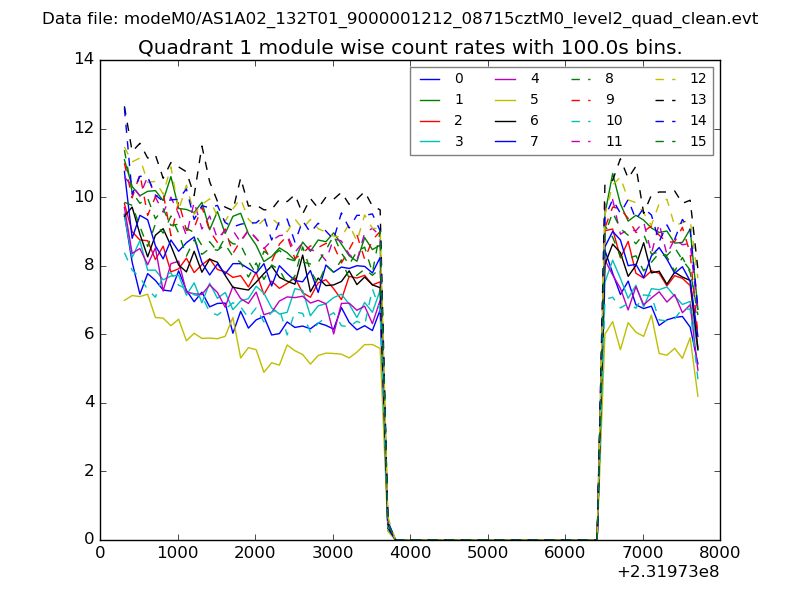 |
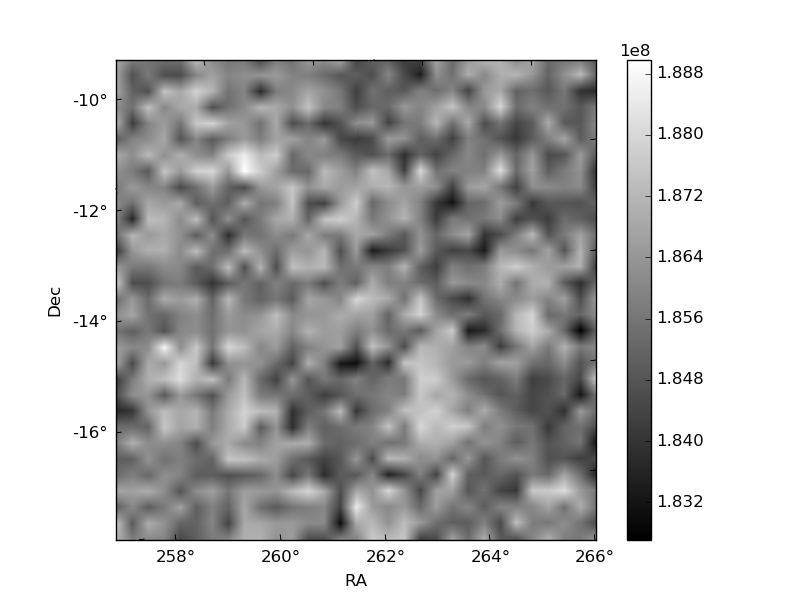 |
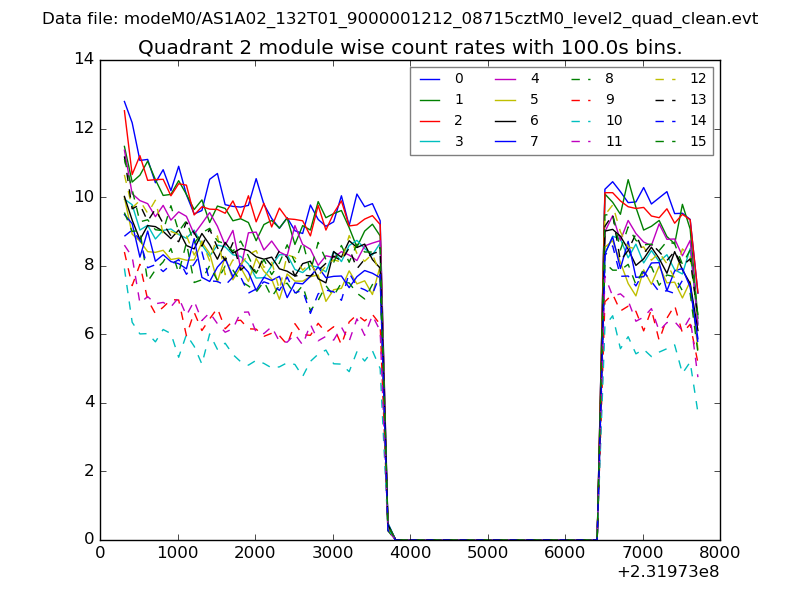
| Module-wise count rates for Quadrant C Data is divided into 100 sec bins |
 |
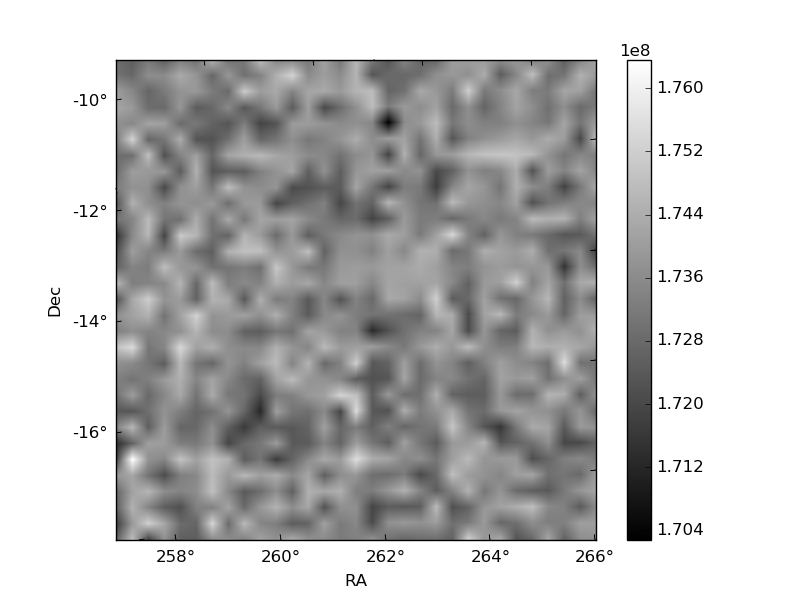 |
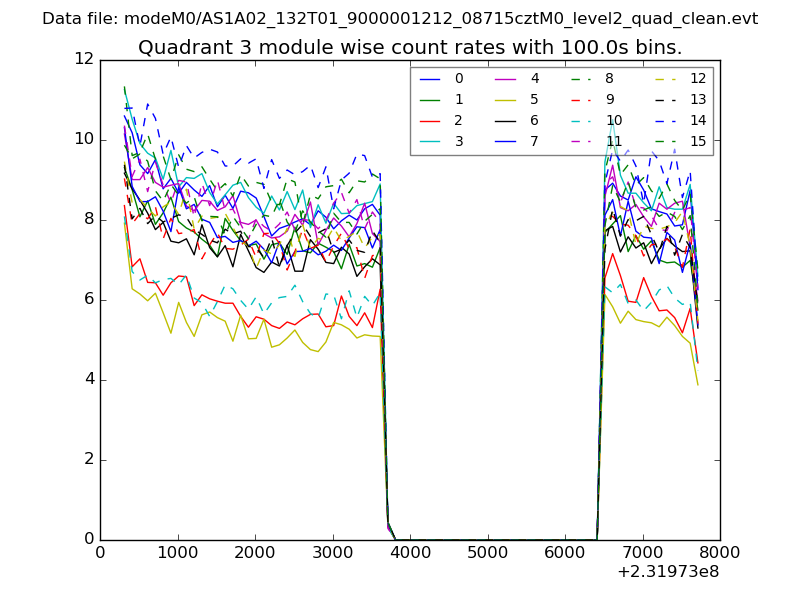
| Module-wise count rates for Quadrant D Data is divided into 100 sec bins |
 |
 |
| Parameter | Plot |
|---|---|
| CZT HV Monitor | 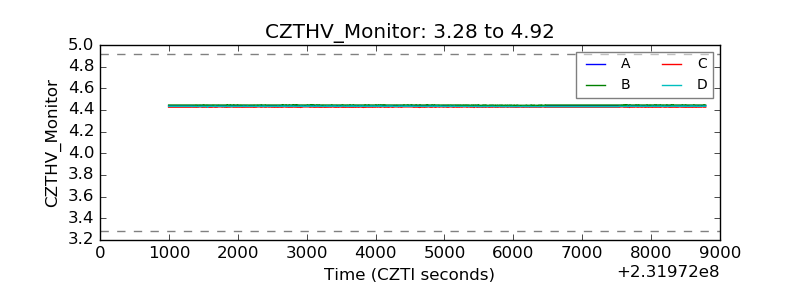 |
| D_VDD | 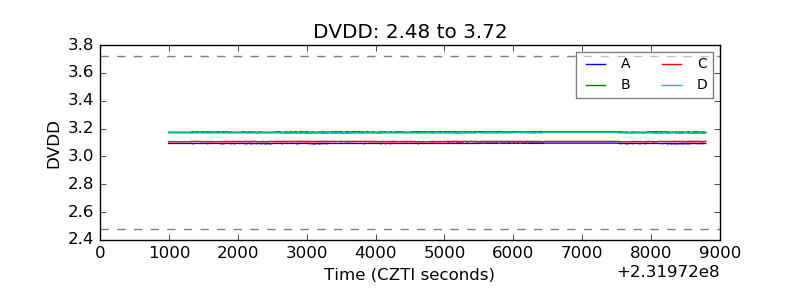 |
| Temperature 1 | 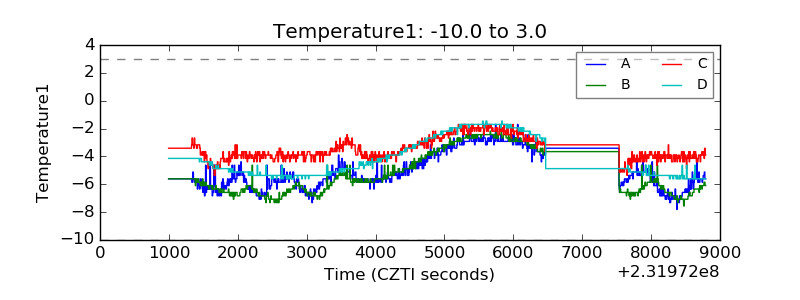 |
| Veto HV Monitor | 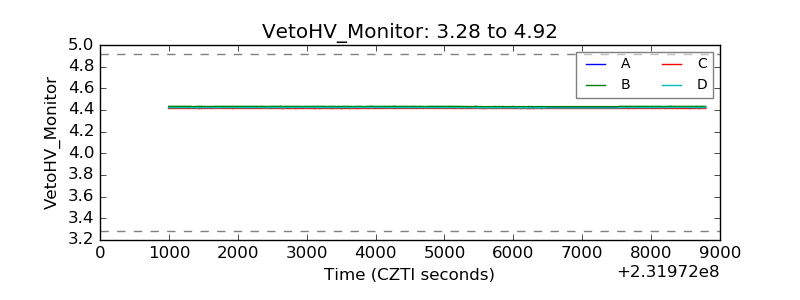 |
| Veto LLD | 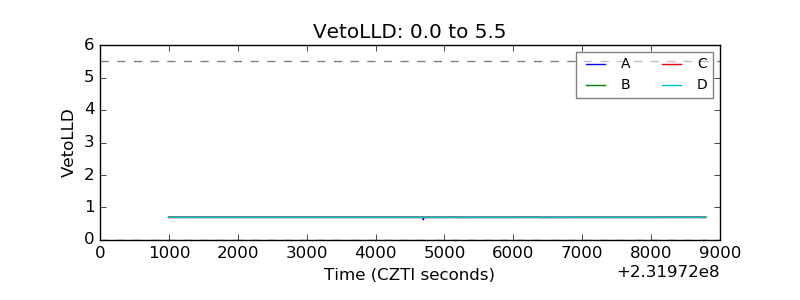 |
| Alpha Counter | 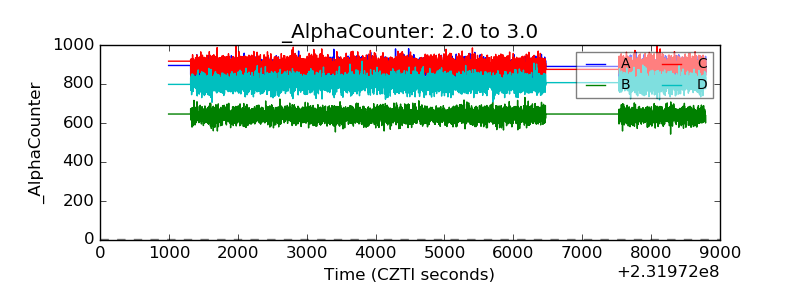 |
| _CPM_Rate | 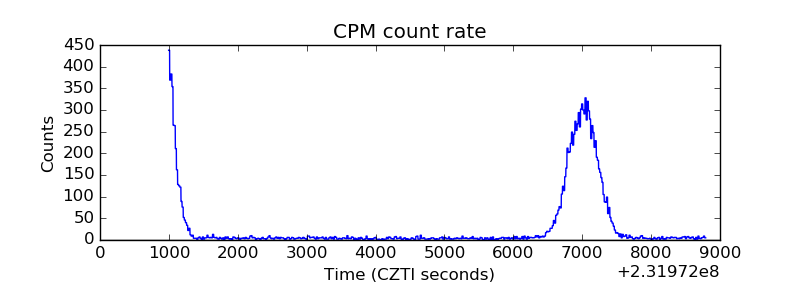 |
| CZT Counter | 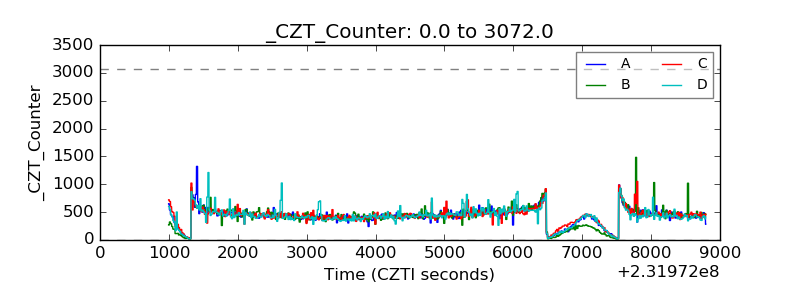 |
| +2.5 Volts monitor |  |
| +5 Volts monitor | 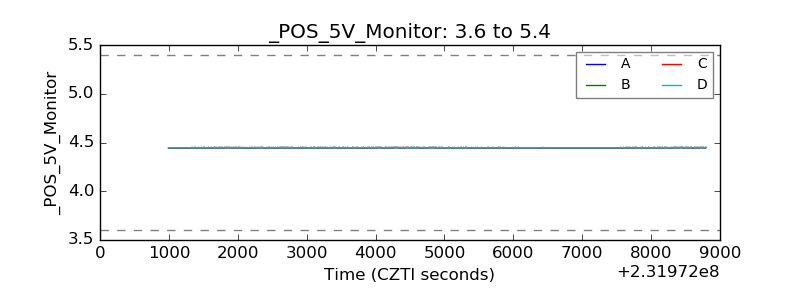 |
| _ROLL_ROT | 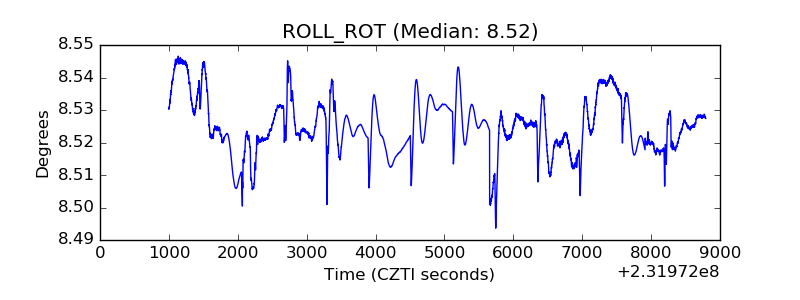 |
| _Roll_DEC | 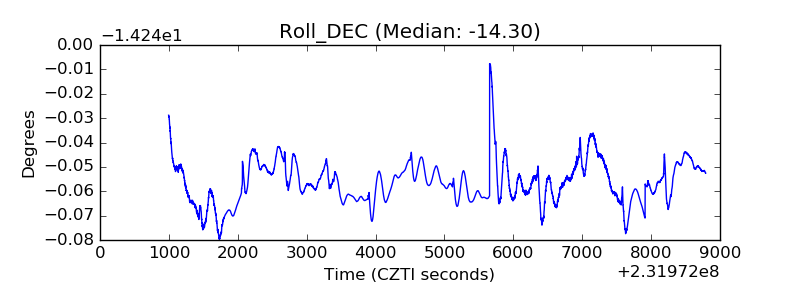 |
| _Roll_RA |  |
| Veto Counter | 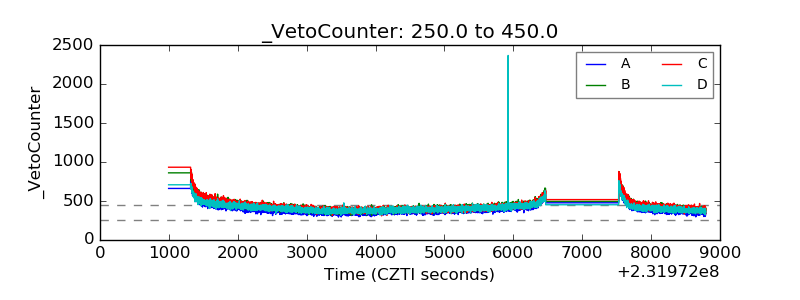 |