| Param | Original file | Final file |
|---|---|---|
| Filename | modeM0/AS1A02_132T01_9000001212_08723cztM0_level2.evt | modeM0/AS1A02_132T01_9000001212_08723cztM0_level2_quad_clean.evt |
| Size (bytes) | 419,544,000 | 57,329,280 |
| Size | 400.1 MB | 54.7 MB |
| Events in quadrant A | 3,143,822 | 330,407 |
| Events in quadrant B | 2,953,712 | 335,679 |
| Events in quadrant C | 2,819,367 | 336,279 |
| Events in quadrant D | 3,380,892 | 314,701 |
| Mode M0 | |||
|---|---|---|---|
| Quadrant | BADHDUFLAG | Total packets | Discarded packets |
| A | 0 | 14697 | 1376 |
| B | 0 | 13990 | 1247 |
| C | 0 | 13523 | 1128 |
| D | 0 | 15763 | 1707 |
| Mode M9 | |||
|---|---|---|---|
| Quadrant | BADHDUFLAG | Total packets | Discarded packets |
| A | 0 | 12 | 1 |
| B | 0 | 12 | 0 |
| C | 0 | 12 | 0 |
| D | 0 | 13 | 0 |
| Mode SS | |||
|---|---|---|---|
| Quadrant | BADHDUFLAG | Total packets | Discarded packets |
| A | 0 | 136 | 14 |
| B | 0 | 136 | 22 |
| C | 0 | 136 | 10 |
| D | 0 | 136 | 14 |
| Quadrant | Total seconds | Saturated seconds | Saturation percentage |
|---|---|---|---|
| A | 5984 | 131 | 2.189171% |
| B | 5982 | 74 | 1.237044% |
| C | 6031 | 53 | 0.878793% |
| D | 5962 | 114 | 1.912110% |
Noise dominated data is calculated using 1-second bins in cleaned event files. If a bin has >2000 counts, and if more than 50% of those come from <1% of pixels, then it is considered to be noise-dominated and hence unusable.
| Quadrant | # 1 sec bins | Bins with >0 counts | Bins with >2000 counts | High rate bins dominated by noise | Noise dominated (total time) | Noise dominated (detector-on time) | Marked lightcurve |
|---|---|---|---|---|---|---|---|
| A | 7657 | 6390 | 41 | 41 | 0.54% | 0.64% | 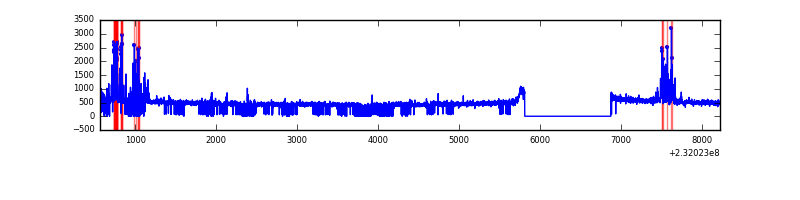 |
| B | 7657 | 6373 | 3 | 3 | 0.04% | 0.05% | 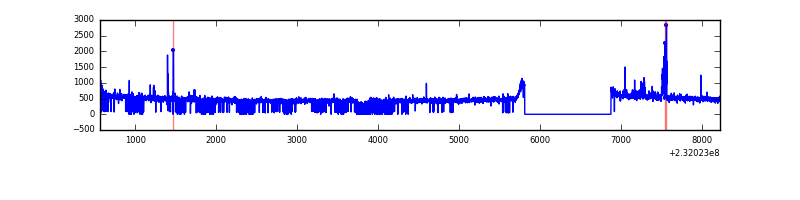 |
| C | 7657 | 6411 | 0 | 0 | 0.00% | 0.00% | 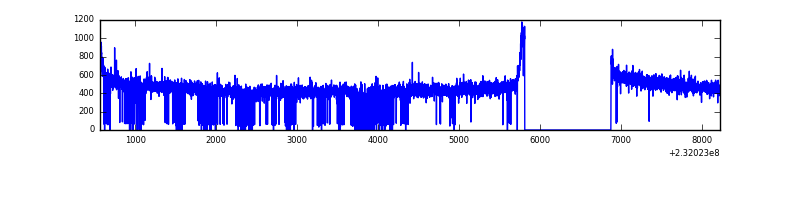 |
| D | 7657 | 6368 | 57 | 57 | 0.74% | 0.90% | 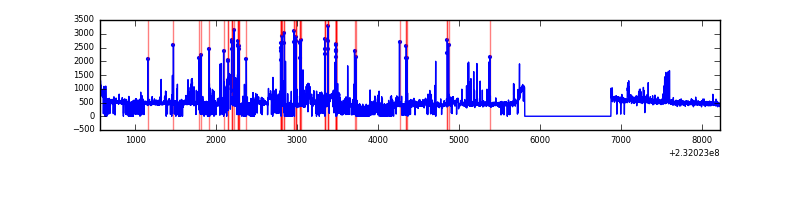 |
Top three noisy pixels from each quadrant. If the there are fewer than three noisy pixels in the level2.evt file, extra rows are filled as -1
| Pixel properties | Quadrant properties | ||||||
|---|---|---|---|---|---|---|---|
| Quadrant | DetID | PixID | Counts | Sigma | Mean | Median | Sigma |
| A | 13 | 251 | 318987 | 2129.35 | 732 | 716 | 149.5 |
| A | 15 | 174 | 7640 | 46.32 | 732 | 716 | 149.5 |
| A | 0 | 226 | 6899 | 41.37 | 732 | 716 | 149.5 |
| B | 15 | 255 | 45571 | 319.33 | 737 | 721 | 140.4 |
| B | 4 | 173 | 40917 | 286.2 | 737 | 721 | 140.4 |
| B | 12 | 111 | 15074 | 102.19 | 737 | 721 | 140.4 |
| C | 13 | 61 | 5509 | 28.61 | 721 | 726 | 167.2 |
| C | 14 | 67 | 3721 | 17.92 | 721 | 726 | 167.2 |
| C | 8 | 222 | 2760 | 12.17 | 721 | 726 | 167.2 |
| D | 1 | 52 | 476621 | 2768.72 | 708 | 692 | 171.9 |
| D | 7 | 71 | 117635 | 680.32 | 708 | 692 | 171.9 |
| D | 2 | 14 | 54362 | 312.23 | 708 | 692 | 171.9 |
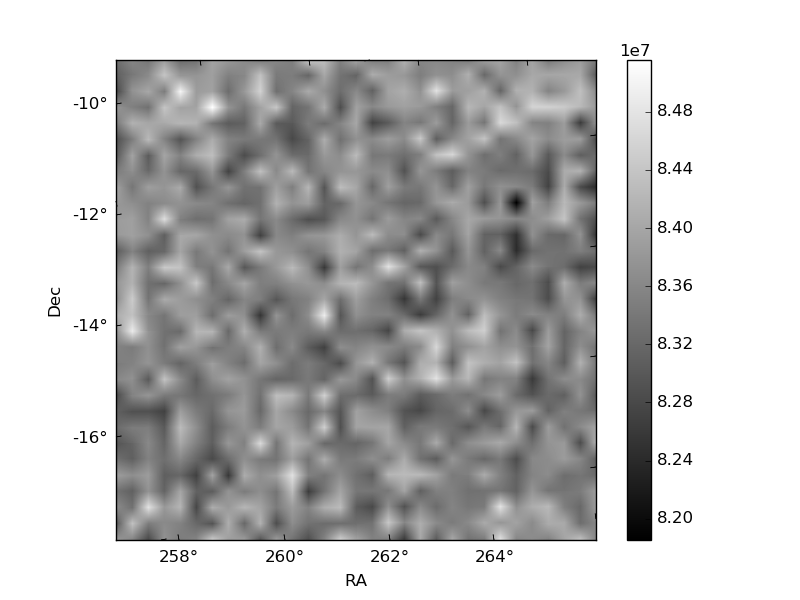
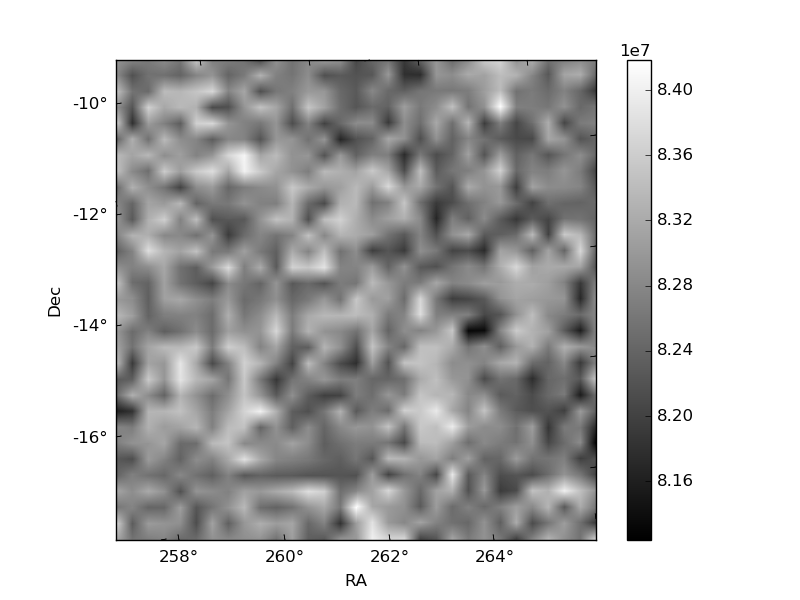
Histogram calculated using DETX and DETY for each event in the final _common_clean file
| Quadrant A |  |
 |
Quadrant B |
|---|---|---|---|
| Quadrant D |  |
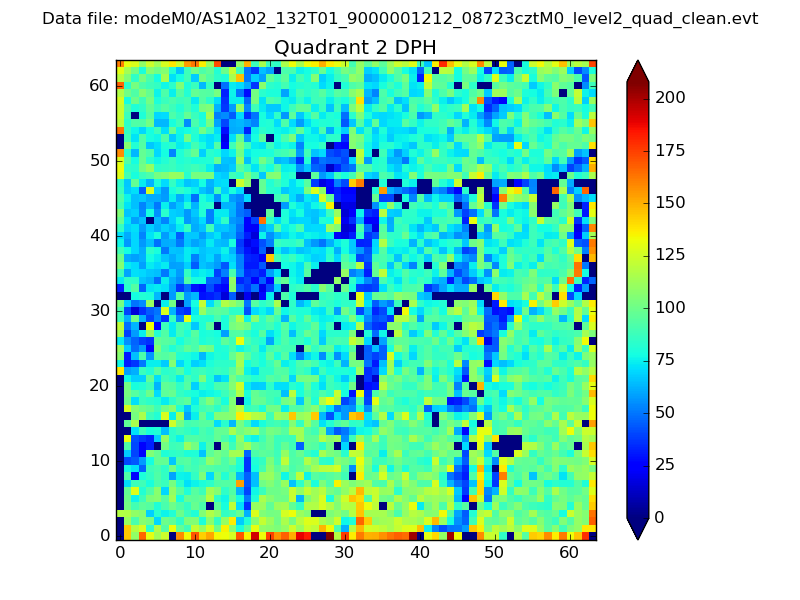 |
Quadrant C |
| Plot type | Count rate plots | Images |
|---|---|---|
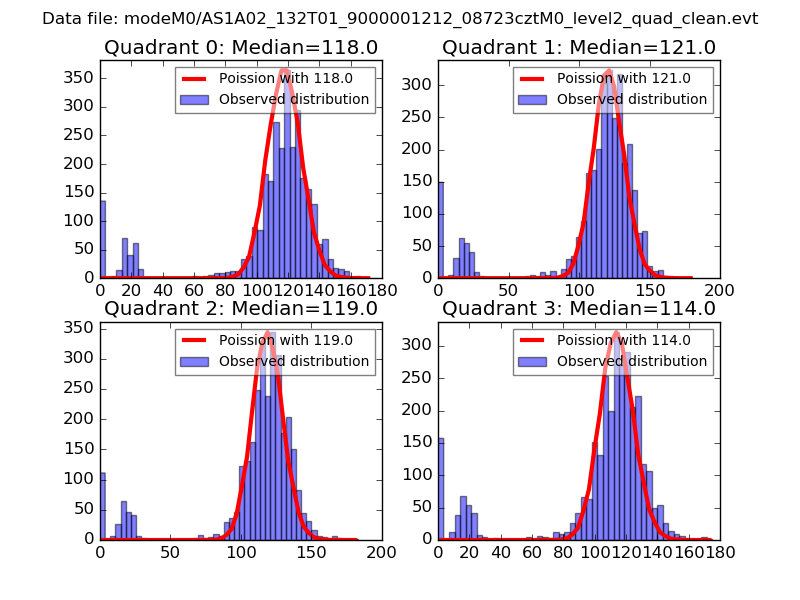
| Comparison with Poisson distribution Blue bars denote a histogram of data divided into 1 sec bins. Red curve is a Poisson curve with rate = median count rate of data. |
 |
 |
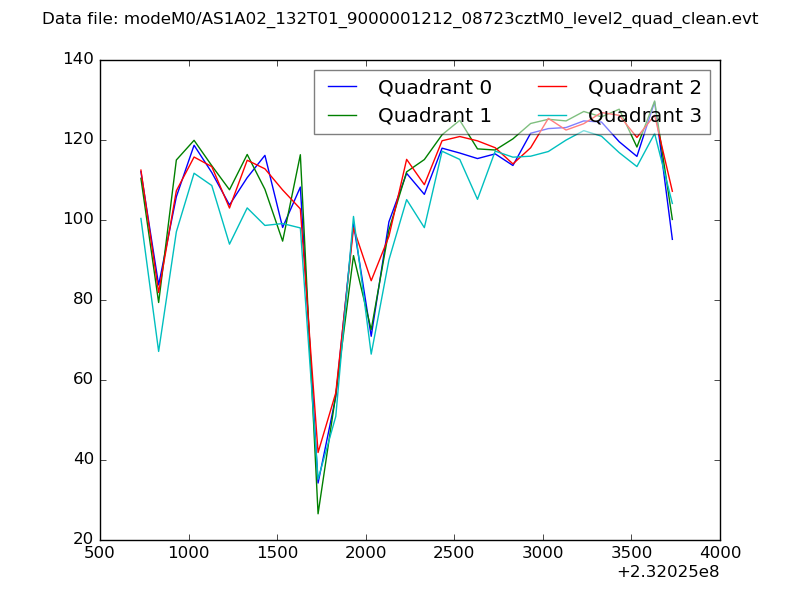
| Quadrant-wise count rates Data is divided into 100 sec bins |
 |
|
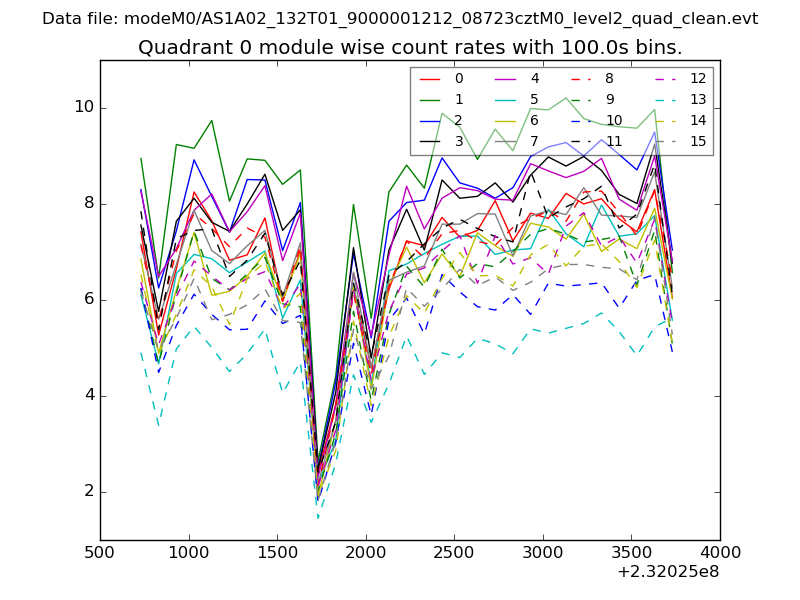
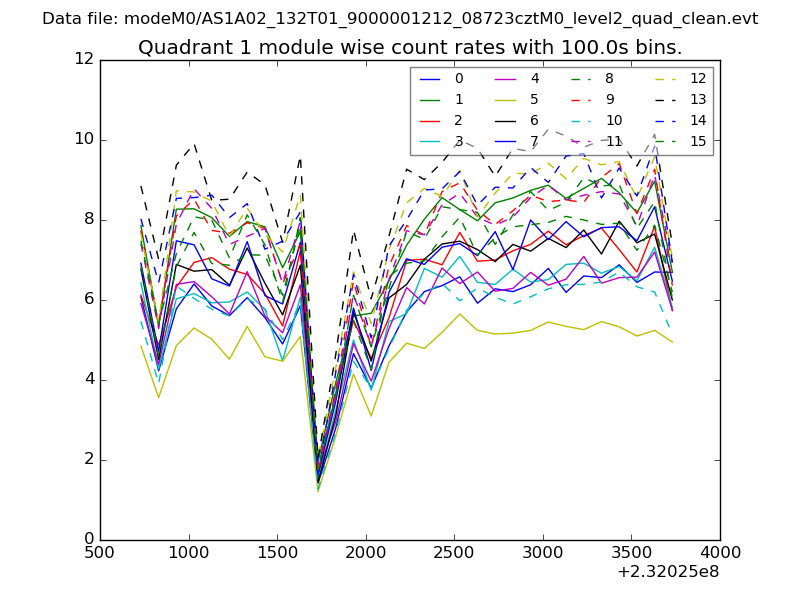
| Module-wise count rates for Quadrant A Data is divided into 100 sec bins |
 |
 |
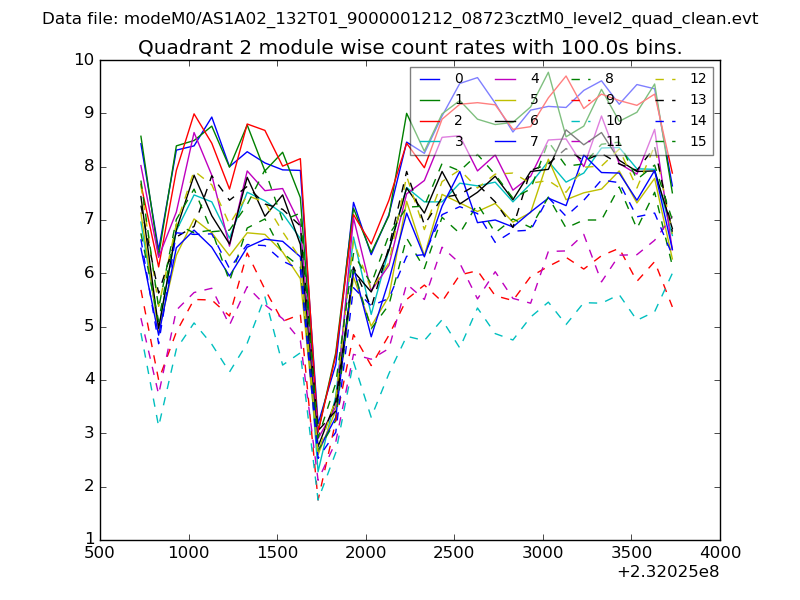
| Module-wise count rates for Quadrant B Data is divided into 100 sec bins |
 |
 |
| Module-wise count rates for Quadrant C Data is divided into 100 sec bins |
 |
 |
| Module-wise count rates for Quadrant D Data is divided into 100 sec bins |
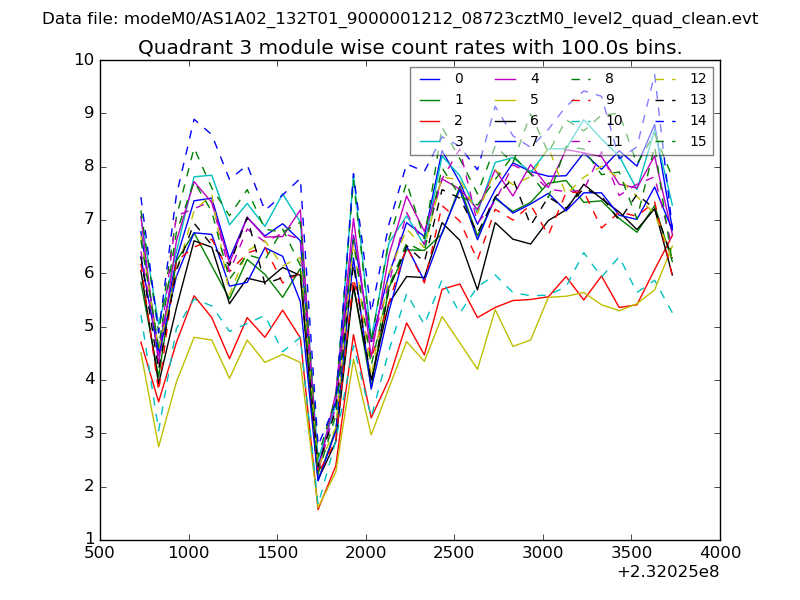 |
 |
| Parameter | Plot |
|---|---|
| CZT HV Monitor | 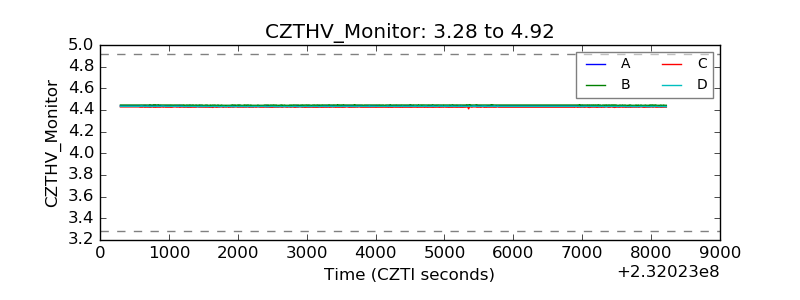 |
| D_VDD | 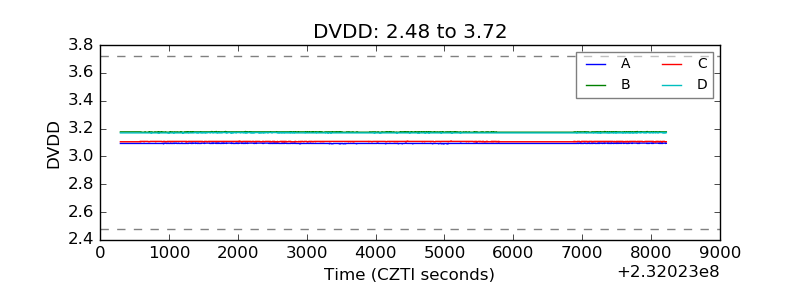 |
| Temperature 1 | 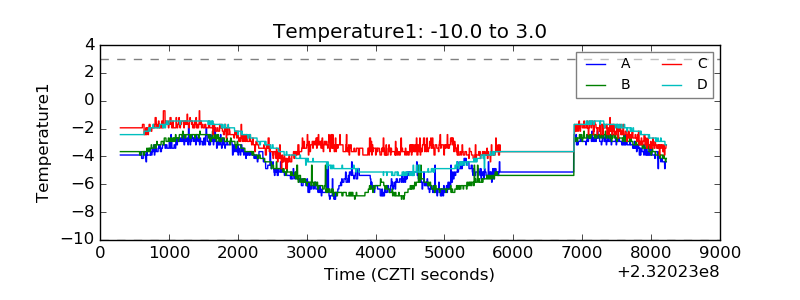 |
| Veto HV Monitor | 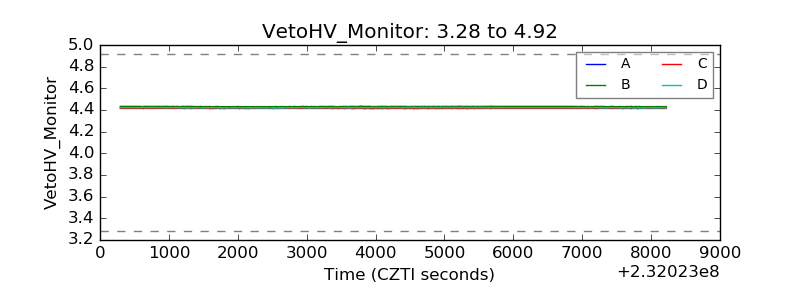 |
| Veto LLD | 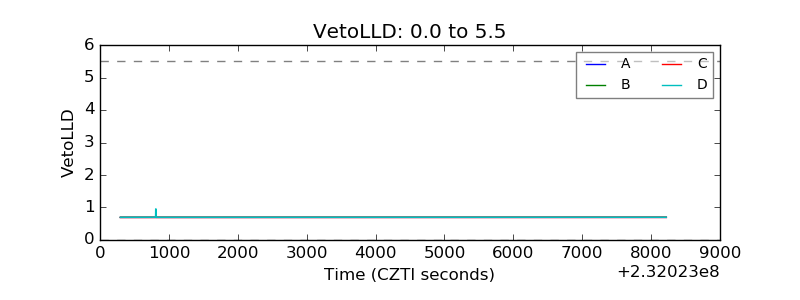 |
| Alpha Counter | 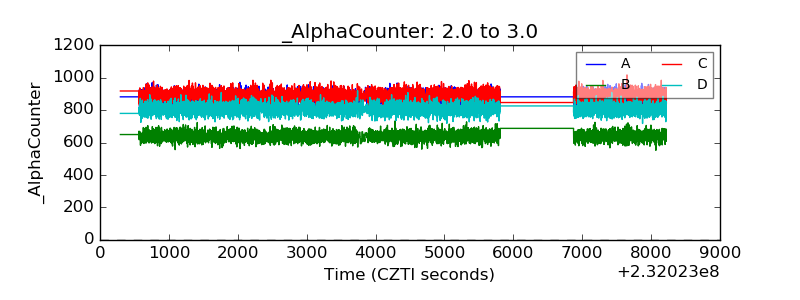 |
| _CPM_Rate | 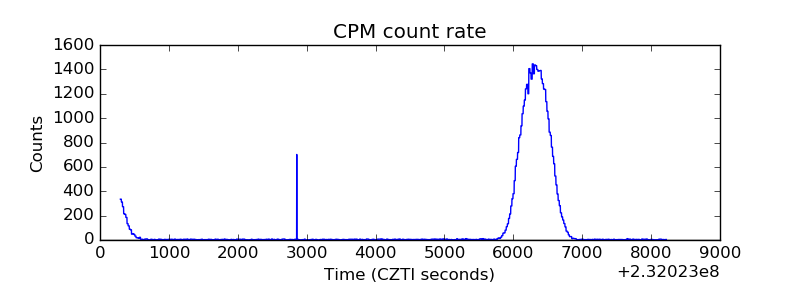 |
| CZT Counter | 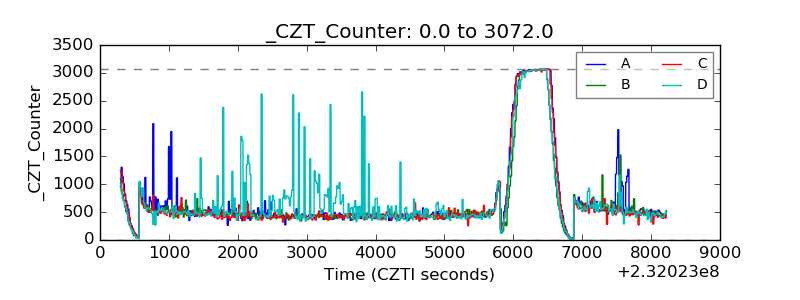 |
| +2.5 Volts monitor |  |
| +5 Volts monitor |  |
| _ROLL_ROT | 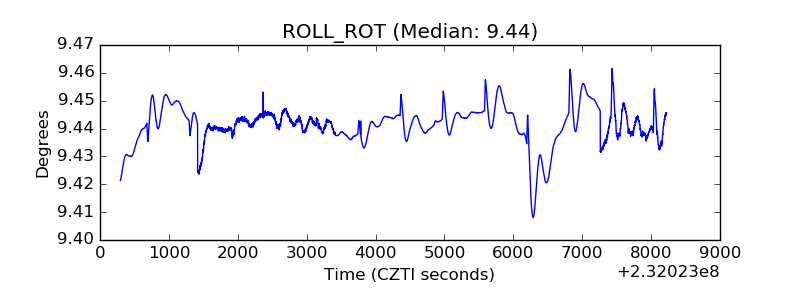 |
| _Roll_DEC | 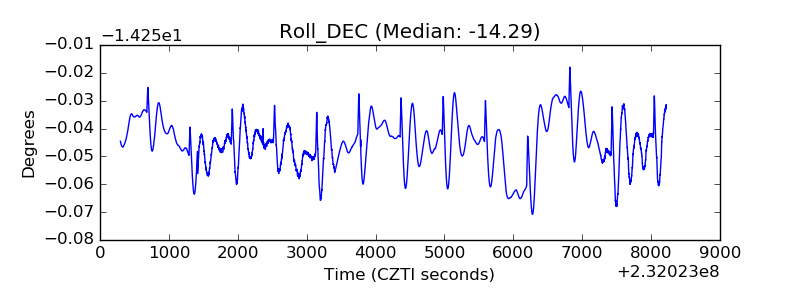 |
| _Roll_RA |  |
| Veto Counter | 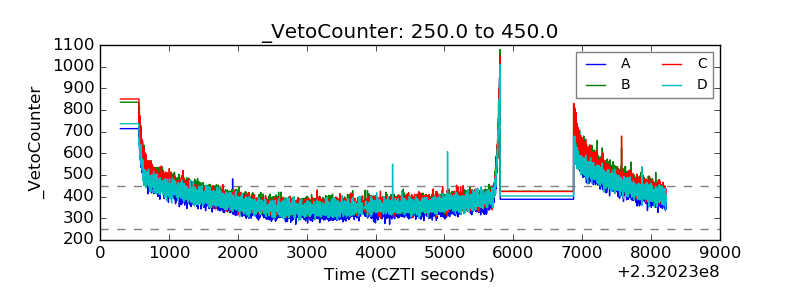 |