| Param | Original file | Final file |
|---|---|---|
| Filename | modeM0/AS1A02_132T01_9000001212_08725cztM0_level2.evt | modeM0/AS1A02_132T01_9000001212_08725cztM0_level2_quad_clean.evt |
| Size (bytes) | 438,448,320 | 70,810,560 |
| Size | 418.1 MB | 67.5 MB |
| Events in quadrant A | 3,332,523 | 422,393 |
| Events in quadrant B | 3,218,407 | 434,000 |
| Events in quadrant C | 3,082,086 | 428,287 |
| Events in quadrant D | 3,210,290 | 412,840 |
| Mode M0 | |||
|---|---|---|---|
| Quadrant | BADHDUFLAG | Total packets | Discarded packets |
| A | 0 | 14092 | 3 |
| B | 0 | 13766 | 2 |
| C | 0 | 13314 | 2 |
| D | 0 | 13861 | 2 |
| Mode M9 | |||
|---|---|---|---|
| Quadrant | BADHDUFLAG | Total packets | Discarded packets |
| A | 0 | 20 | 0 |
| B | 0 | 20 | 0 |
| C | 0 | 20 | 0 |
| D | 0 | 21 | 0 |
| Mode SS | |||
|---|---|---|---|
| Quadrant | BADHDUFLAG | Total packets | Discarded packets |
| A | 0 | 130 | 0 |
| B | 0 | 130 | 0 |
| C | 0 | 130 | 0 |
| D | 0 | 130 | 0 |
| Quadrant | Total seconds | Saturated seconds | Saturation percentage |
|---|---|---|---|
| A | 6400 | 82 | 1.281250% |
| B | 6400 | 74 | 1.156250% |
| C | 6400 | 44 | 0.687500% |
| D | 6400 | 58 | 0.906250% |
Noise dominated data is calculated using 1-second bins in cleaned event files. If a bin has >2000 counts, and if more than 50% of those come from <1% of pixels, then it is considered to be noise-dominated and hence unusable.
| Quadrant | # 1 sec bins | Bins with >0 counts | Bins with >2000 counts | High rate bins dominated by noise | Noise dominated (total time) | Noise dominated (detector-on time) | Marked lightcurve |
|---|---|---|---|---|---|---|---|
| A | 7580 | 6400 | 13 | 13 | 0.17% | 0.20% | 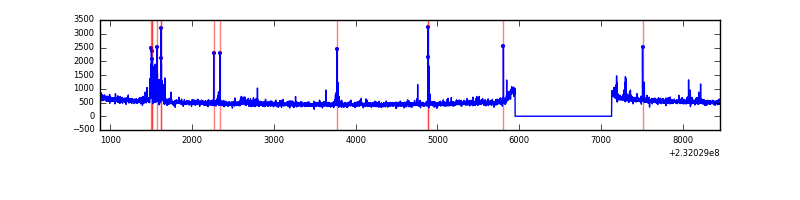 |
| B | 7580 | 6400 | 2 | 2 | 0.03% | 0.03% | 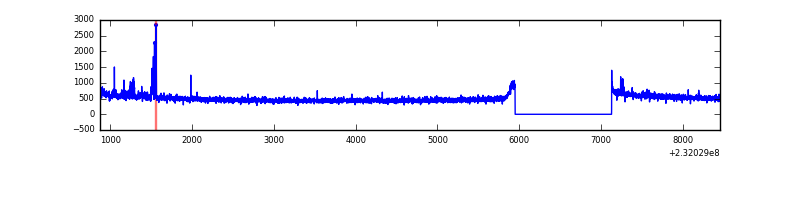 |
| C | 7580 | 6400 | 2 | 2 | 0.03% | 0.03% | 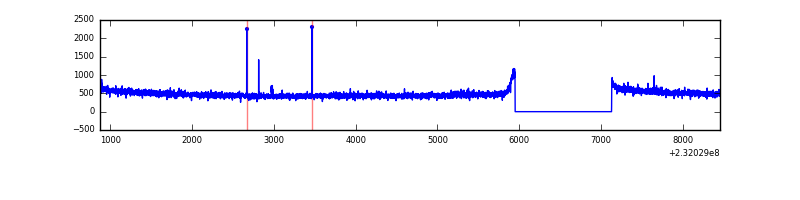 |
| D | 7580 | 6400 | 17 | 17 | 0.22% | 0.27% | 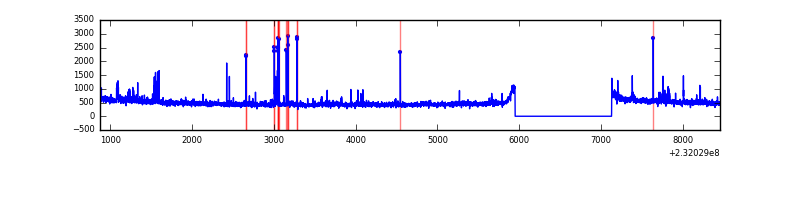 |
Top three noisy pixels from each quadrant. If the there are fewer than three noisy pixels in the level2.evt file, extra rows are filled as -1
| Pixel properties | Quadrant properties | ||||||
|---|---|---|---|---|---|---|---|
| Quadrant | DetID | PixID | Counts | Sigma | Mean | Median | Sigma |
| A | 13 | 251 | 242217 | 1489.6 | 802 | 783 | 162.1 |
| A | 0 | 226 | 7692 | 42.63 | 802 | 783 | 162.1 |
| A | 12 | 194 | 6815 | 37.22 | 802 | 783 | 162.1 |
| B | 15 | 255 | 45873 | 295.36 | 810 | 793 | 152.6 |
| B | 4 | 173 | 28929 | 184.34 | 810 | 793 | 152.6 |
| B | 12 | 111 | 16001 | 99.64 | 810 | 793 | 152.6 |
| C | 12 | 4 | 6845 | 33.41 | 786 | 790 | 181.2 |
| C | 13 | 61 | 5892 | 28.15 | 786 | 790 | 181.2 |
| C | 14 | 234 | 4626 | 21.17 | 786 | 790 | 181.2 |
| D | 1 | 52 | 116477 | 603.58 | 778 | 759 | 191.7 |
| D | 2 | 14 | 60562 | 311.93 | 778 | 759 | 191.7 |
| D | 7 | 71 | 34208 | 174.47 | 778 | 759 | 191.7 |
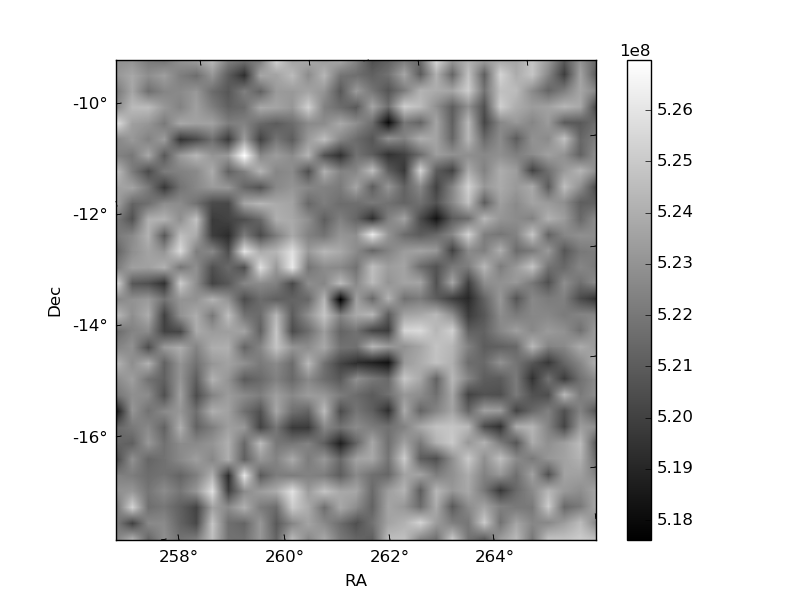
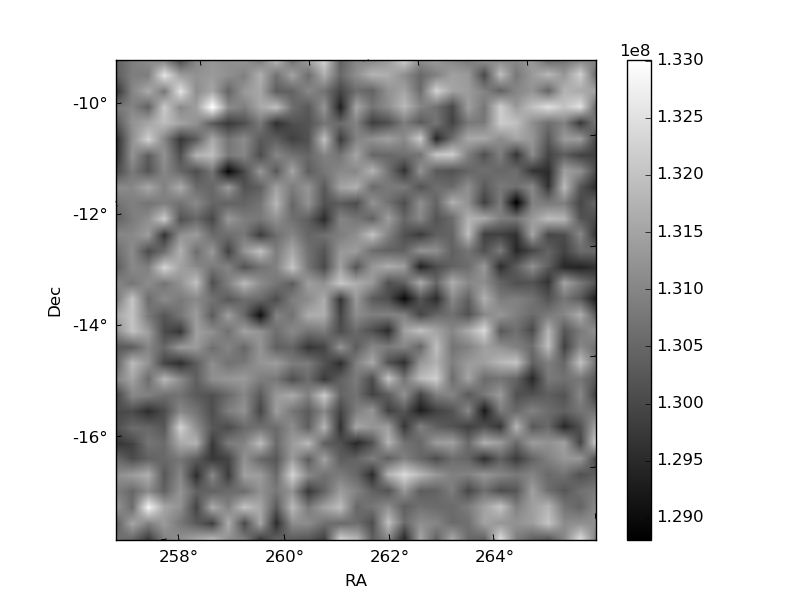
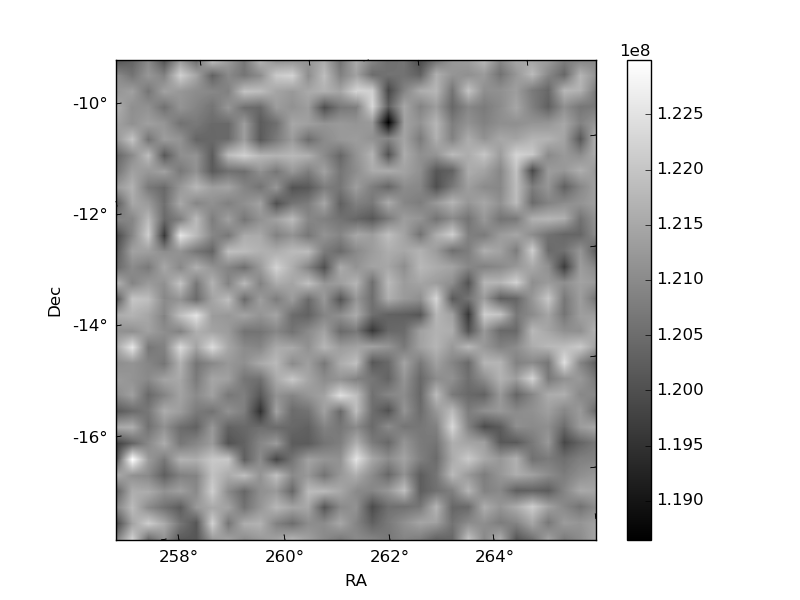
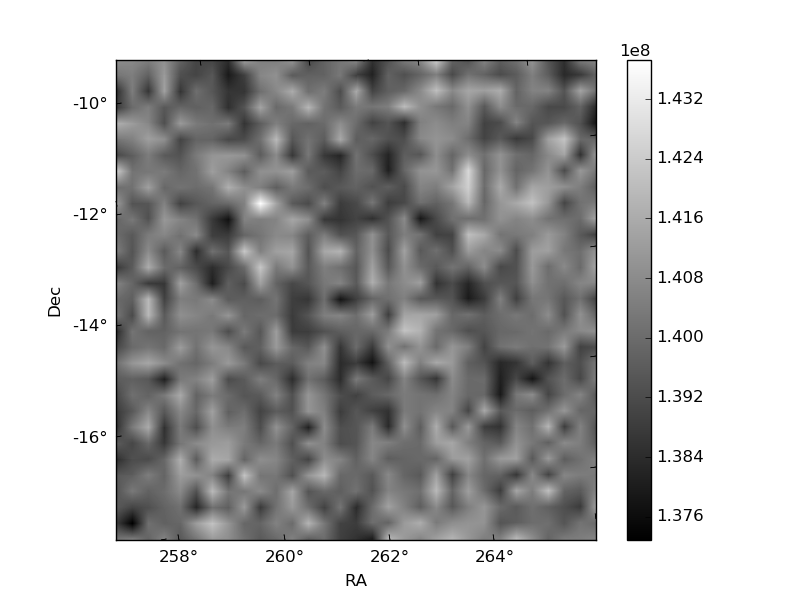
Histogram calculated using DETX and DETY for each event in the final _common_clean file
| Quadrant A | 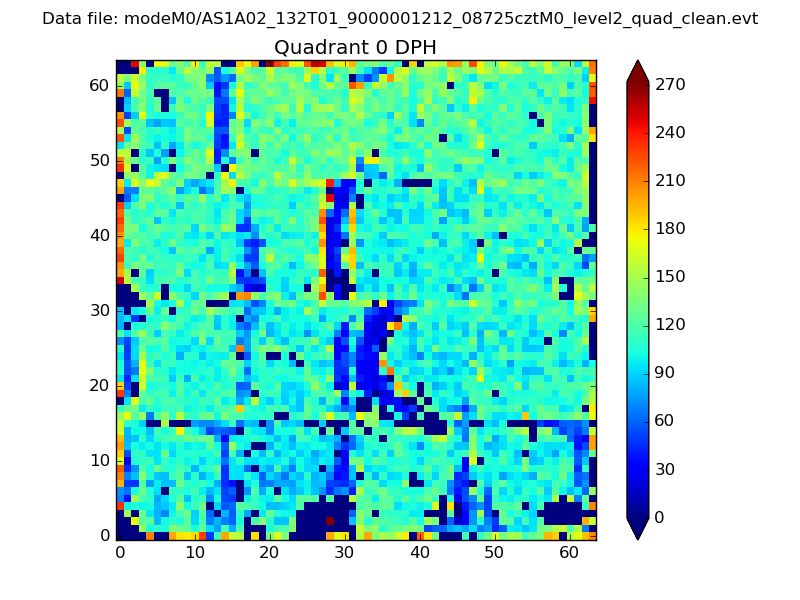 |
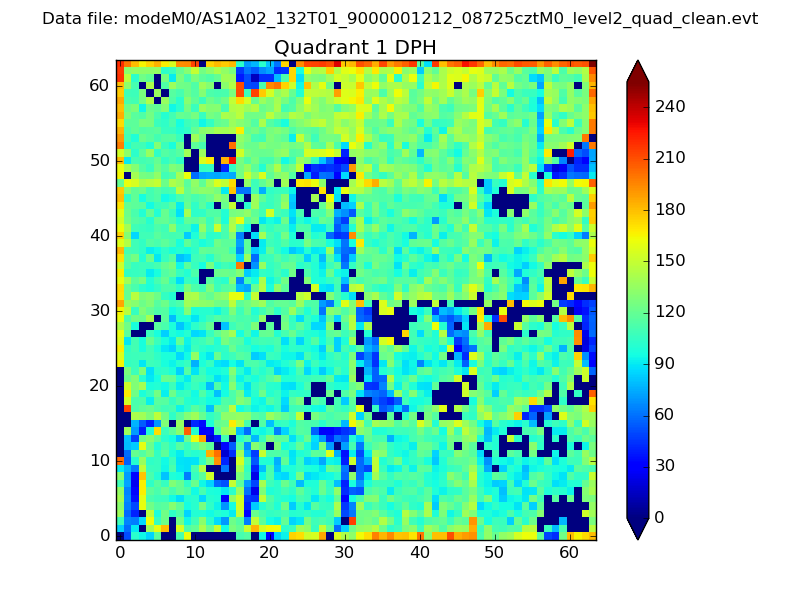 |
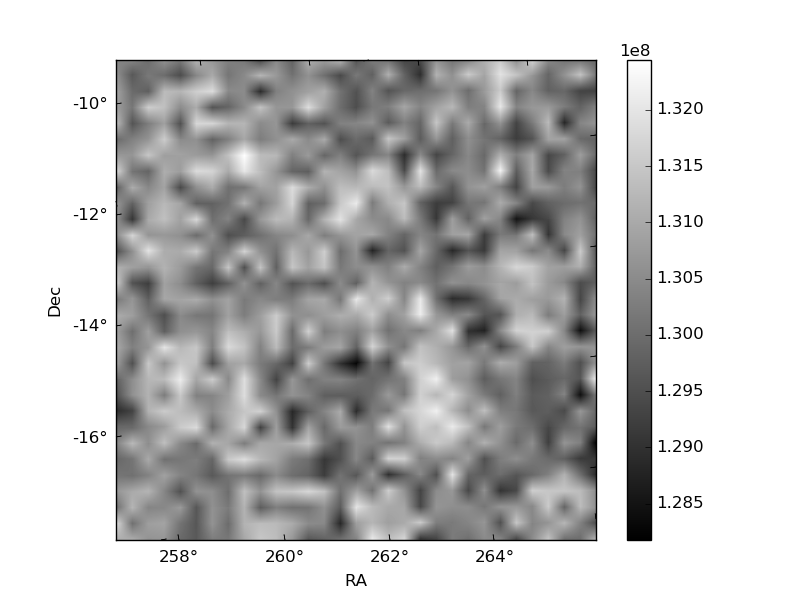
Quadrant B |
|---|---|---|---|
| Quadrant D | 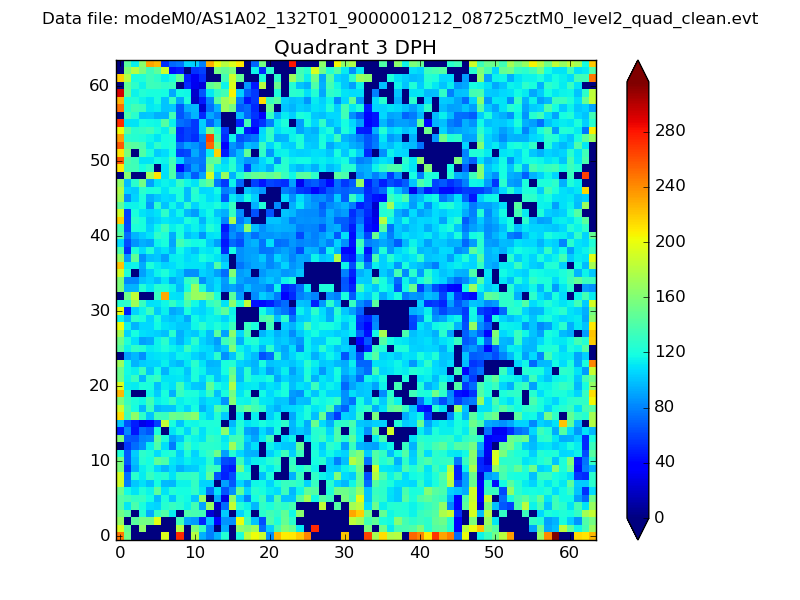 |
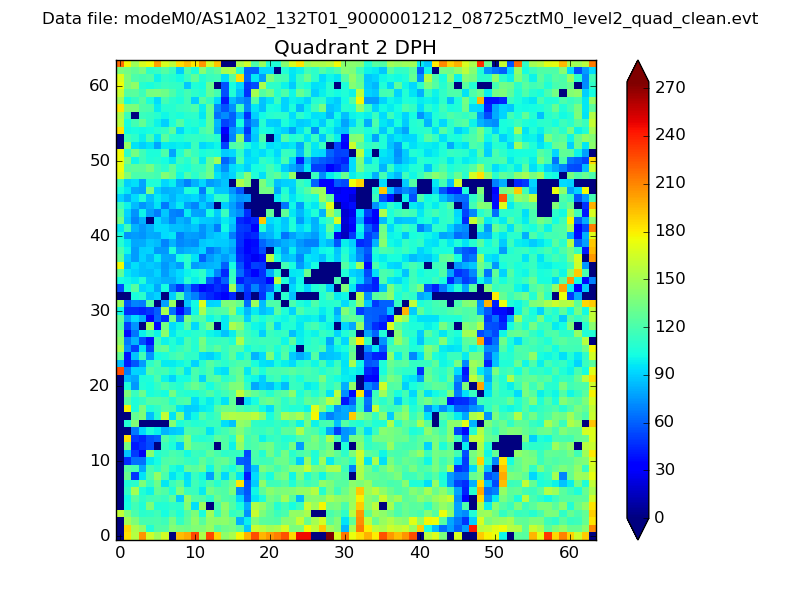 |
Quadrant C |
| Plot type | Count rate plots | Images |
|---|---|---|
| Comparison with Poisson distribution Blue bars denote a histogram of data divided into 1 sec bins. Red curve is a Poisson curve with rate = median count rate of data. |
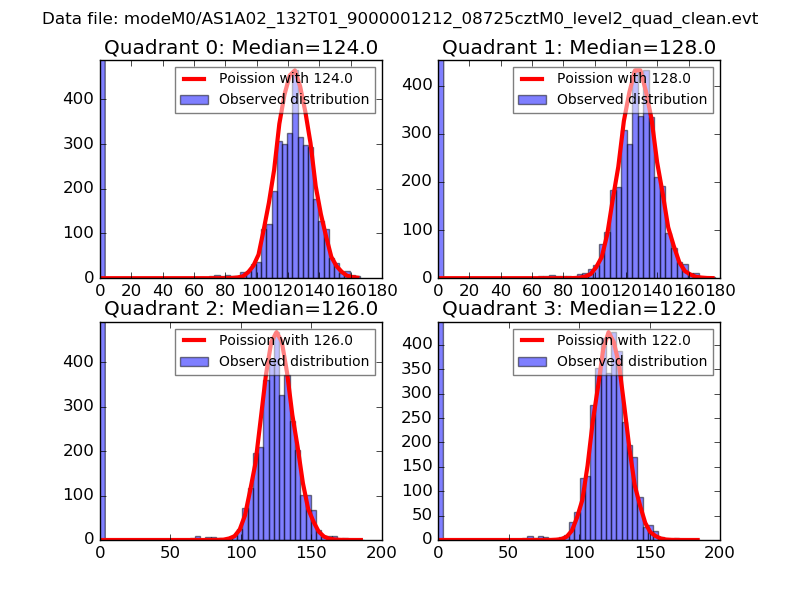 |
 |
| Quadrant-wise count rates Data is divided into 100 sec bins |
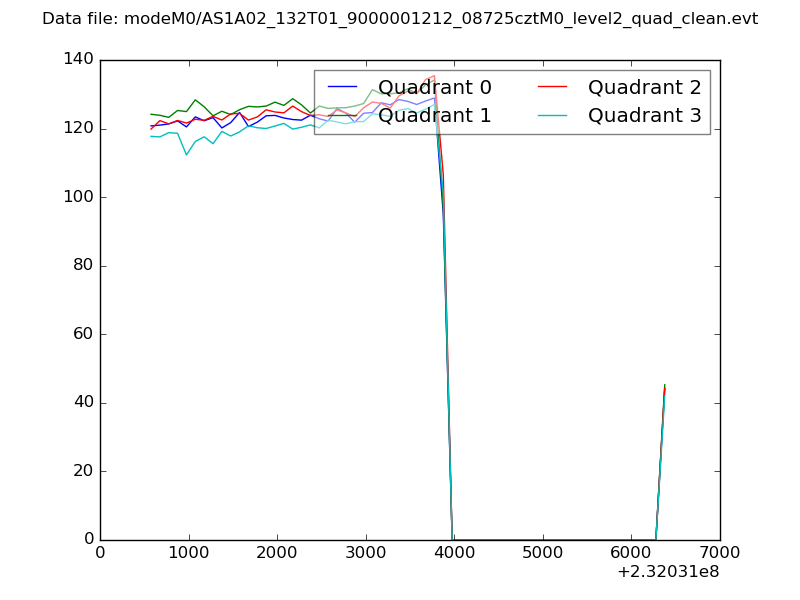 |
|
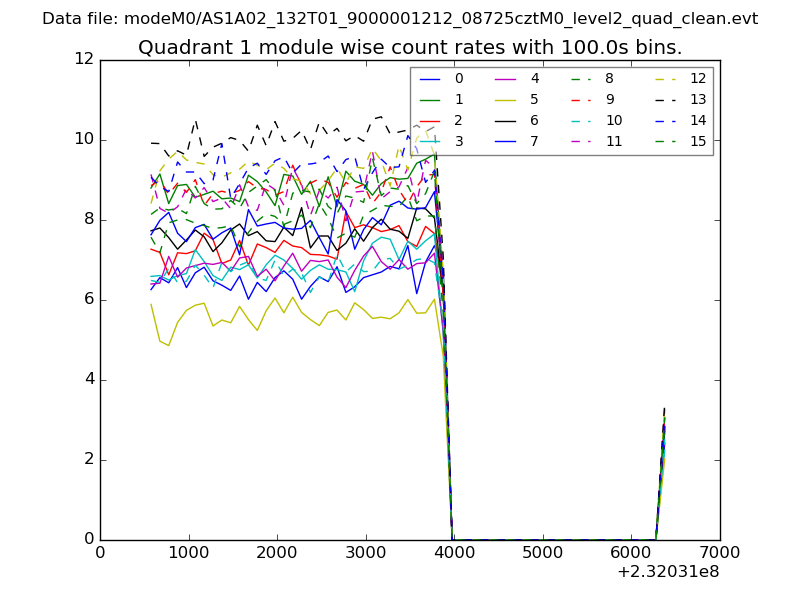
| Module-wise count rates for Quadrant A Data is divided into 100 sec bins |
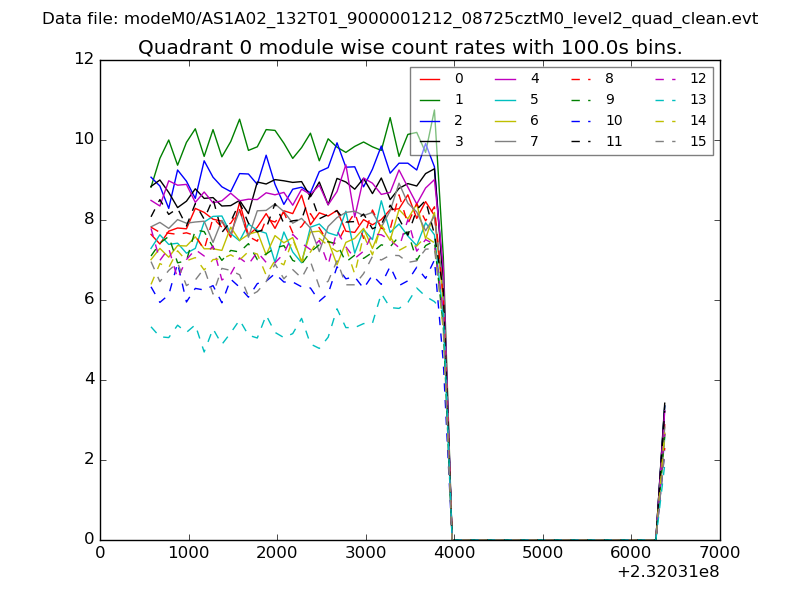 |
 |
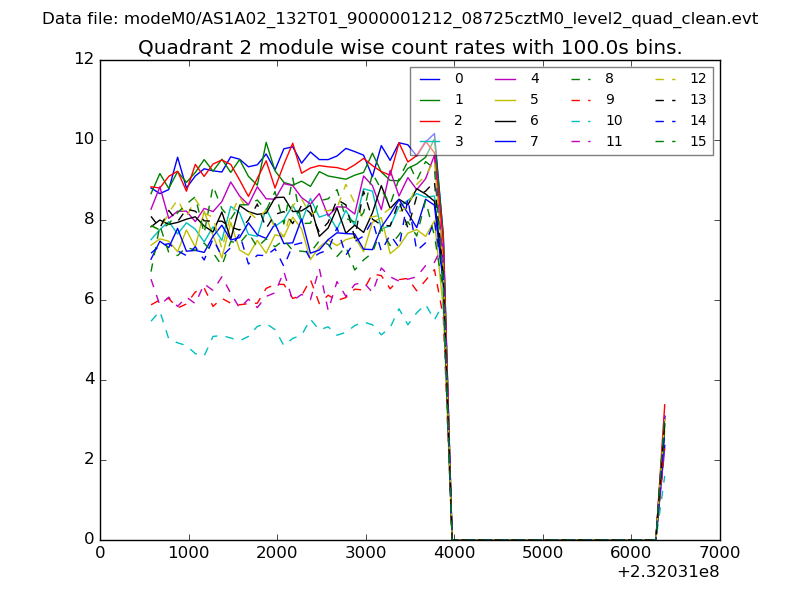
| Module-wise count rates for Quadrant B Data is divided into 100 sec bins |
 |
 |
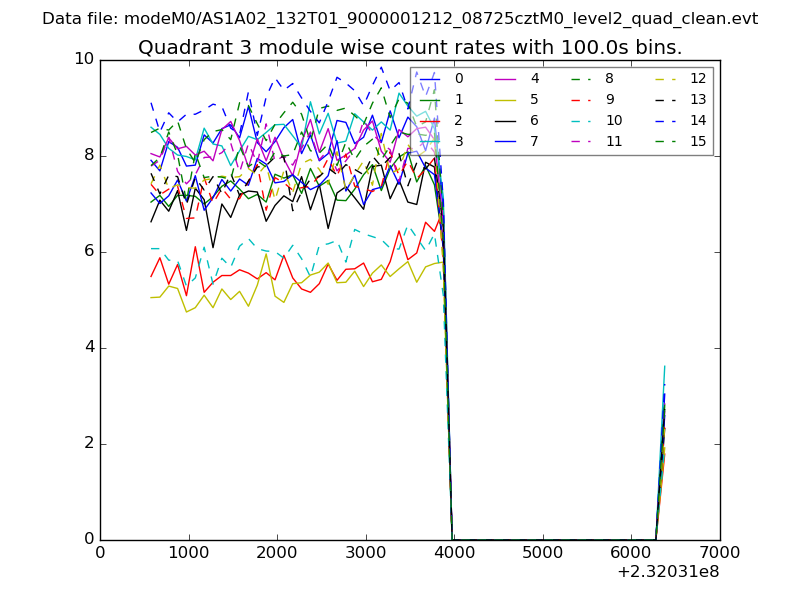
| Module-wise count rates for Quadrant C Data is divided into 100 sec bins |
 |
 |
| Module-wise count rates for Quadrant D Data is divided into 100 sec bins |
 |
 |
| Parameter | Plot |
|---|---|
| CZT HV Monitor | 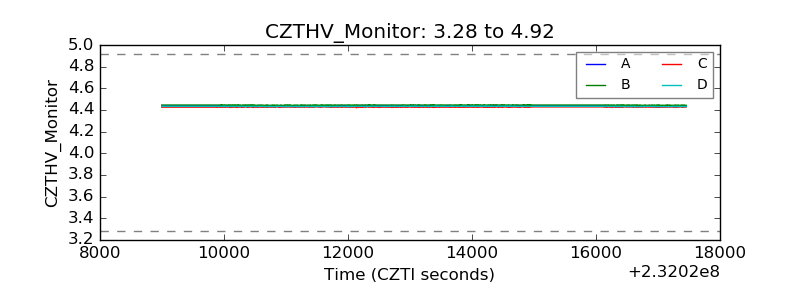 |
| D_VDD | 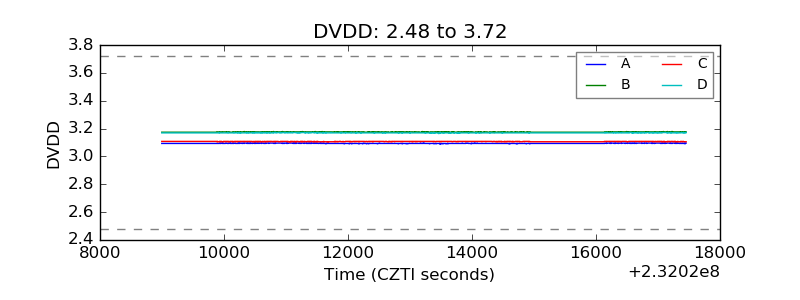 |
| Temperature 1 | 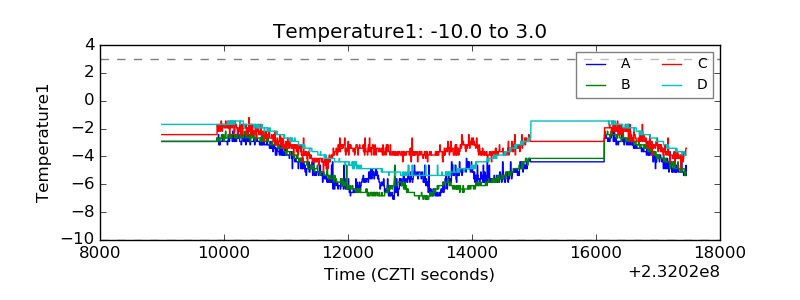 |
| Veto HV Monitor | 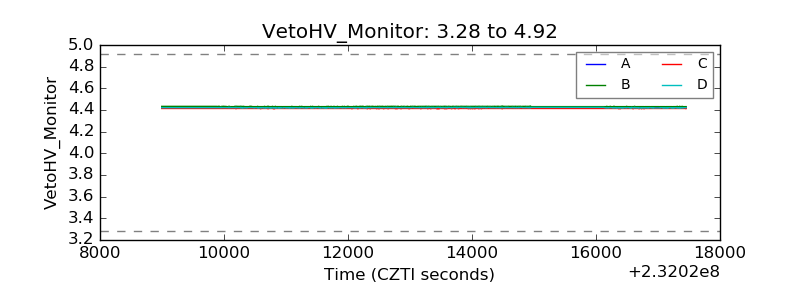 |
| Veto LLD | 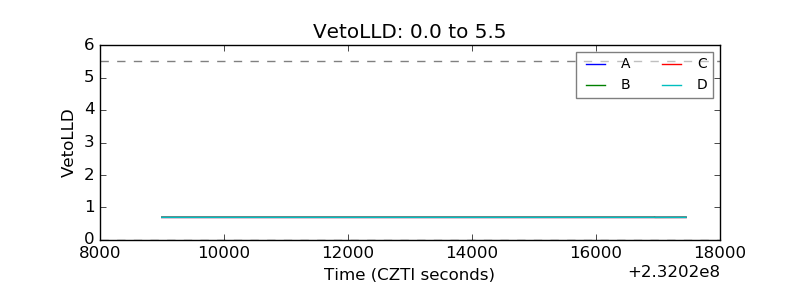 |
| Alpha Counter | 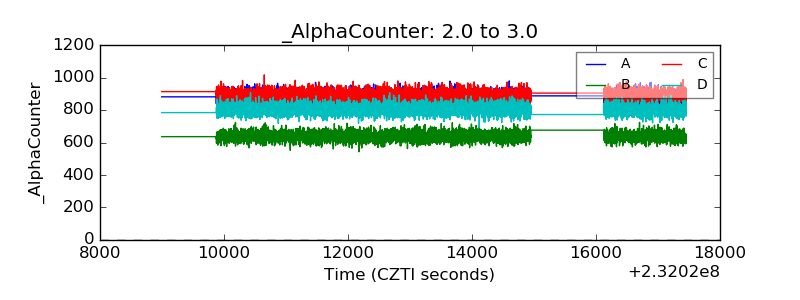 |
| _CPM_Rate | 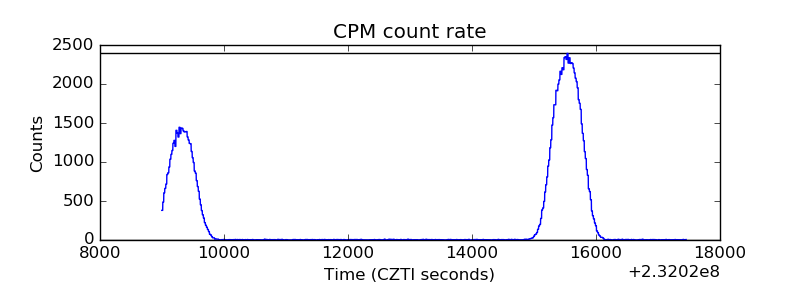 |
| CZT Counter | 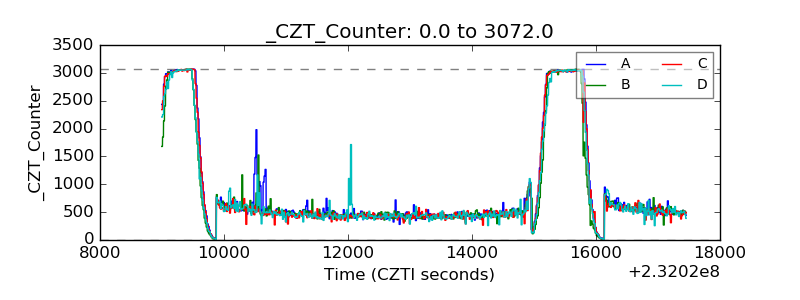 |
| +2.5 Volts monitor |  |
| +5 Volts monitor |  |
| _ROLL_ROT | 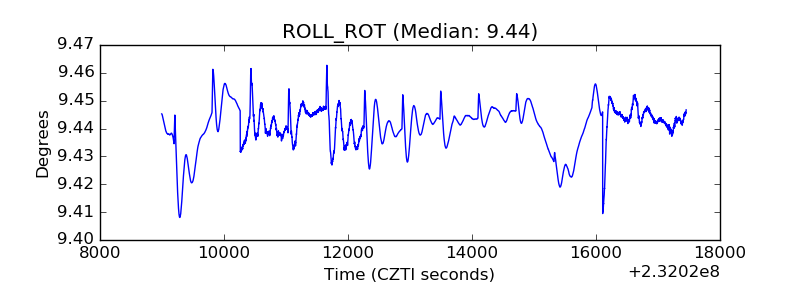 |
| _Roll_DEC |  |
| _Roll_RA | 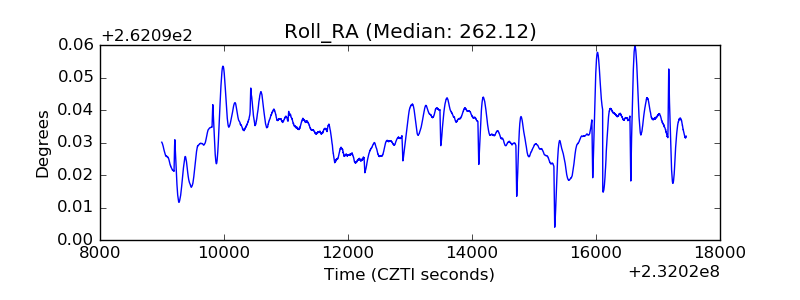 |
| Veto Counter | 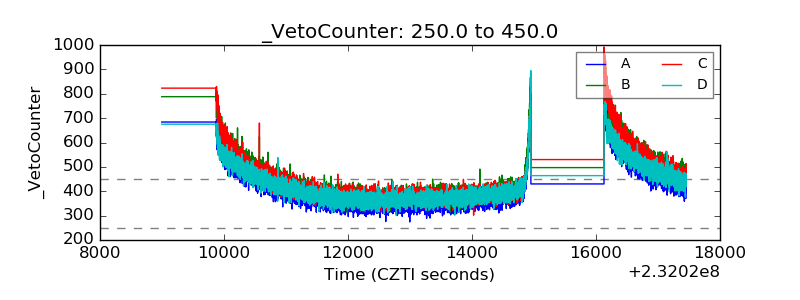 |