| Param | Original file | Final file |
|---|---|---|
| Filename | modeM0/AS1A02_132T01_9000001212_08728cztM0_level2.evt | modeM0/AS1A02_132T01_9000001212_08728cztM0_level2_quad_clean.evt |
| Size (bytes) | 433,146,240 | 101,082,240 |
| Size | 413.1 MB | 96.4 MB |
| Events in quadrant A | 3,166,014 | 649,379 |
| Events in quadrant B | 3,247,462 | 675,211 |
| Events in quadrant C | 3,134,833 | 666,719 |
| Events in quadrant D | 3,147,697 | 636,895 |
| Mode M0 | |||
|---|---|---|---|
| Quadrant | BADHDUFLAG | Total packets | Discarded packets |
| A | 0 | 13400 | 3 |
| B | 0 | 13615 | 2 |
| C | 0 | 13147 | 2 |
| D | 0 | 13467 | 2 |
| Mode M9 | |||
|---|---|---|---|
| Quadrant | BADHDUFLAG | Total packets | Discarded packets |
| A | 0 | 14 | 0 |
| B | 0 | 14 | 0 |
| C | 0 | 14 | 0 |
| D | 0 | 15 | 0 |
| Mode SS | |||
|---|---|---|---|
| Quadrant | BADHDUFLAG | Total packets | Discarded packets |
| A | 0 | 126 | 0 |
| B | 0 | 126 | 0 |
| C | 0 | 126 | 0 |
| D | 0 | 126 | 0 |
| Quadrant | Total seconds | Saturated seconds | Saturation percentage |
|---|---|---|---|
| A | 6207 | 63 | 1.014983% |
| B | 6207 | 60 | 0.966651% |
| C | 6207 | 31 | 0.499436% |
| D | 6207 | 46 | 0.741099% |
Noise dominated data is calculated using 1-second bins in cleaned event files. If a bin has >2000 counts, and if more than 50% of those come from <1% of pixels, then it is considered to be noise-dominated and hence unusable.
| Quadrant | # 1 sec bins | Bins with >0 counts | Bins with >2000 counts | High rate bins dominated by noise | Noise dominated (total time) | Noise dominated (detector-on time) | Marked lightcurve |
|---|---|---|---|---|---|---|---|
| A | 7537 | 6207 | 10 | 10 | 0.13% | 0.16% | 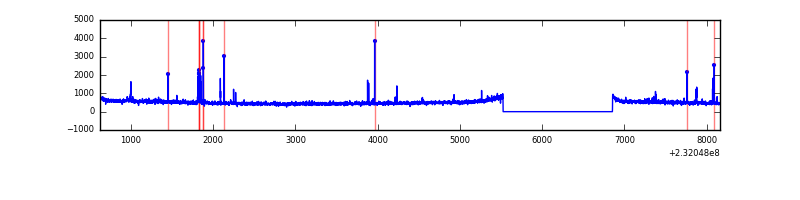 |
| B | 7537 | 6207 | 1 | 1 | 0.01% | 0.02% | 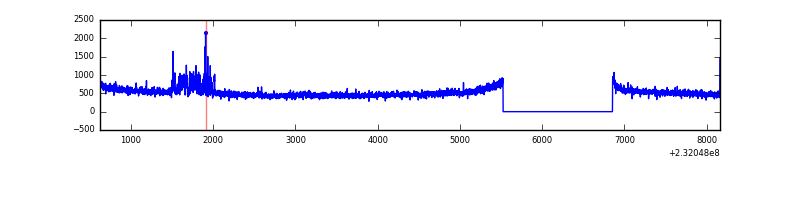 |
| C | 7537 | 6208 | 14 | 14 | 0.19% | 0.23% | 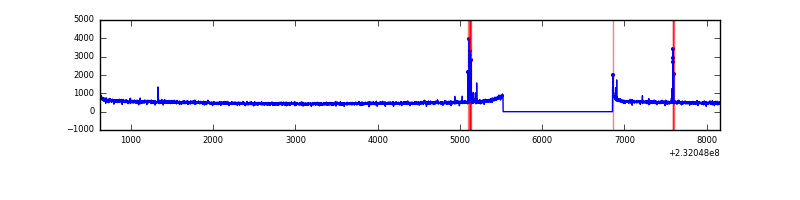 |
| D | 7537 | 6208 | 19 | 19 | 0.25% | 0.31% | 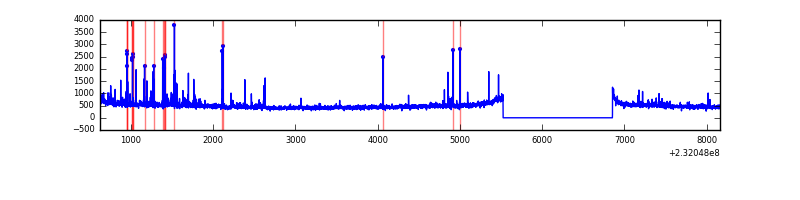 |
Top three noisy pixels from each quadrant. If the there are fewer than three noisy pixels in the level2.evt file, extra rows are filled as -1
| Pixel properties | Quadrant properties | ||||||
|---|---|---|---|---|---|---|---|
| Quadrant | DetID | PixID | Counts | Sigma | Mean | Median | Sigma |
| A | 5 | 16 | 83917 | 524.33 | 785 | 770 | 158.6 |
| A | 13 | 251 | 49363 | 306.43 | 785 | 770 | 158.6 |
| A | 15 | 174 | 15475 | 92.73 | 785 | 770 | 158.6 |
| B | 5 | 255 | 121879 | 808.63 | 802 | 785 | 149.8 |
| B | 12 | 111 | 15846 | 100.57 | 802 | 785 | 149.8 |
| B | 11 | 111 | 12755 | 79.93 | 802 | 785 | 149.8 |
| C | 14 | 234 | 69429 | 378.83 | 781 | 787 | 181.2 |
| C | 14 | 67 | 9503 | 48.1 | 781 | 787 | 181.2 |
| C | 8 | 208 | 7709 | 38.2 | 781 | 787 | 181.2 |
| D | 1 | 52 | 68318 | 363.87 | 767 | 754 | 185.7 |
| D | 2 | 14 | 63425 | 337.51 | 767 | 754 | 185.7 |
| D | 2 | 152 | 39870 | 210.66 | 767 | 754 | 185.7 |
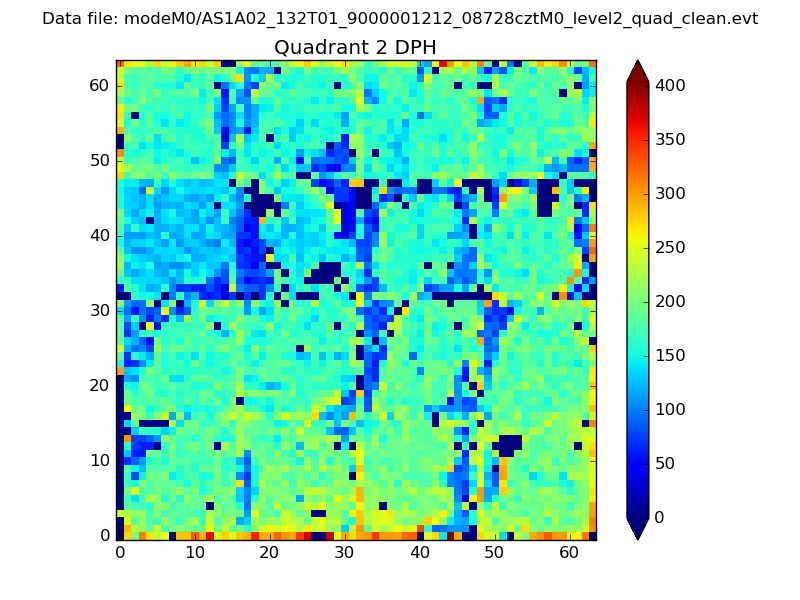
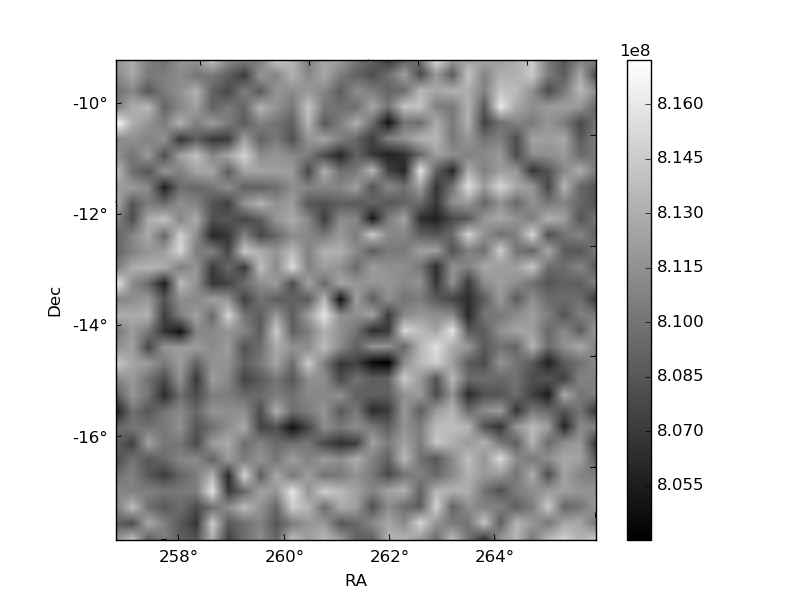
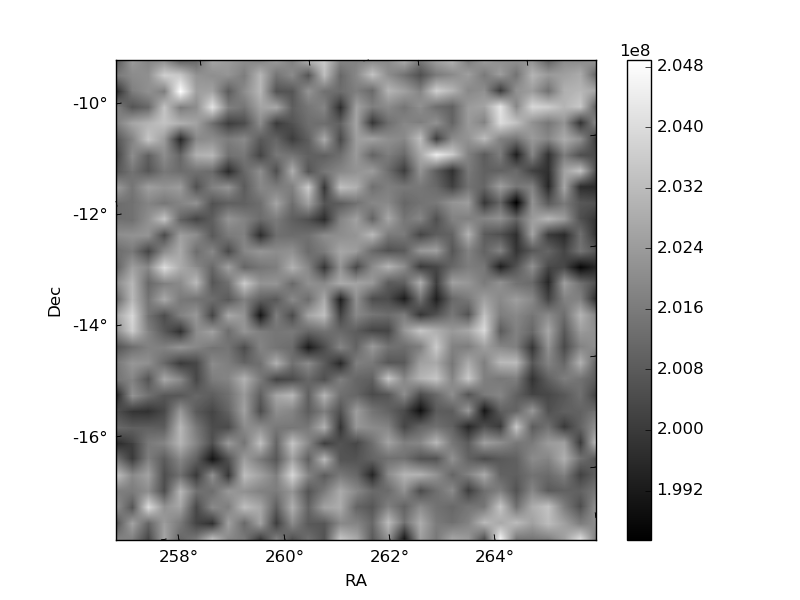
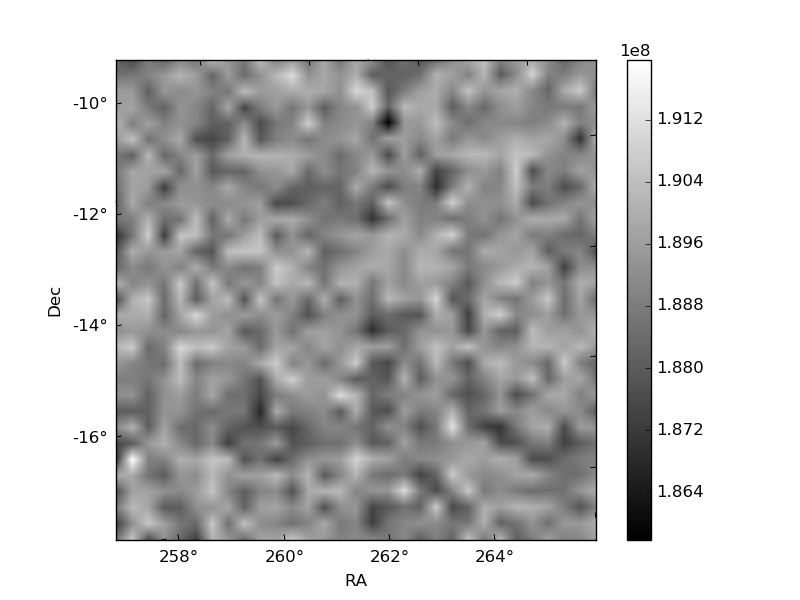
Histogram calculated using DETX and DETY for each event in the final _common_clean file
| Quadrant A | 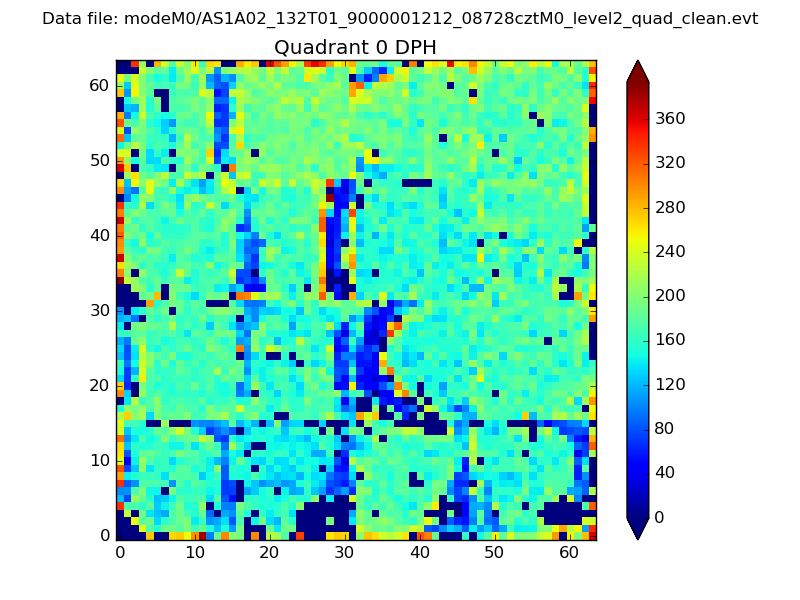 |
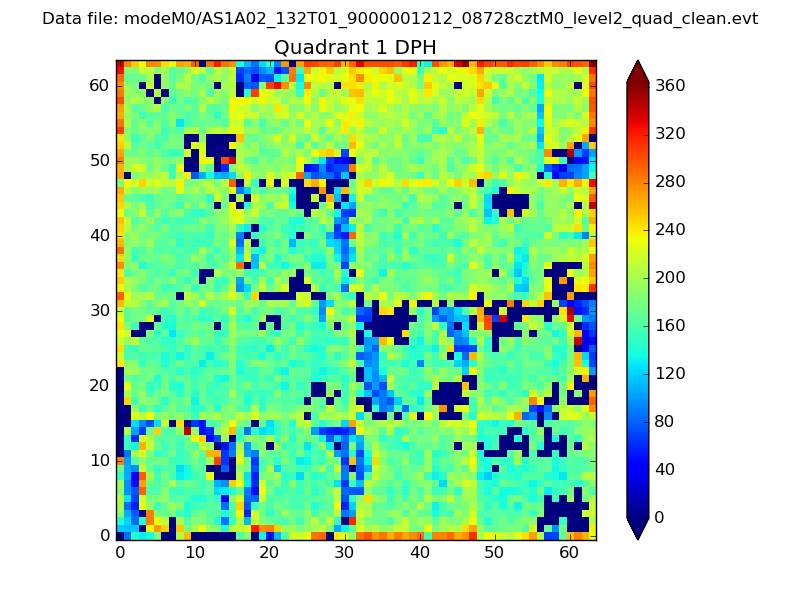 |
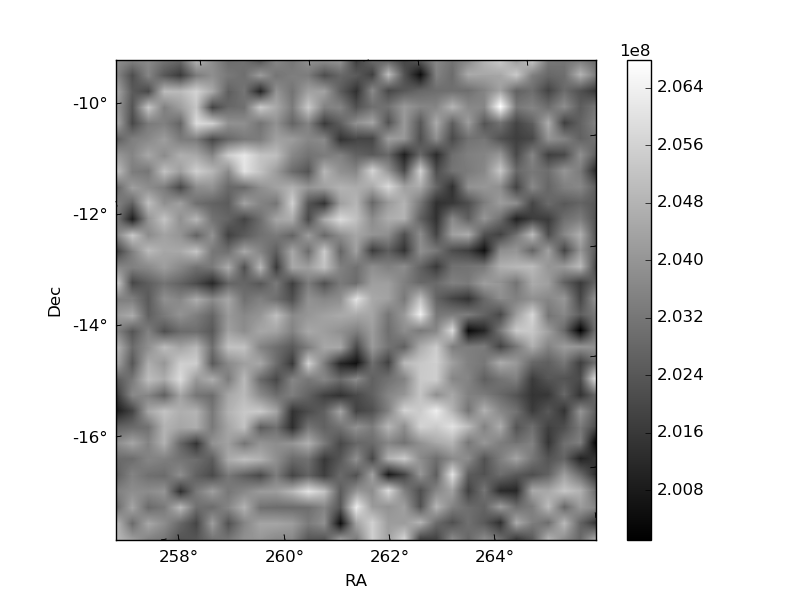
Quadrant B |
|---|---|---|---|
| Quadrant D | 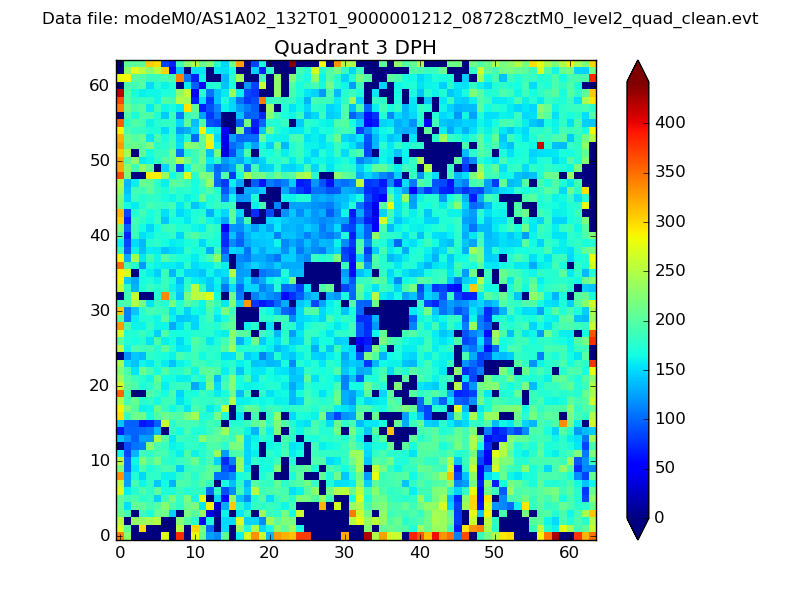 |
 |
Quadrant C |
| Plot type | Count rate plots | Images |
|---|---|---|
| Comparison with Poisson distribution Blue bars denote a histogram of data divided into 1 sec bins. Red curve is a Poisson curve with rate = median count rate of data. |
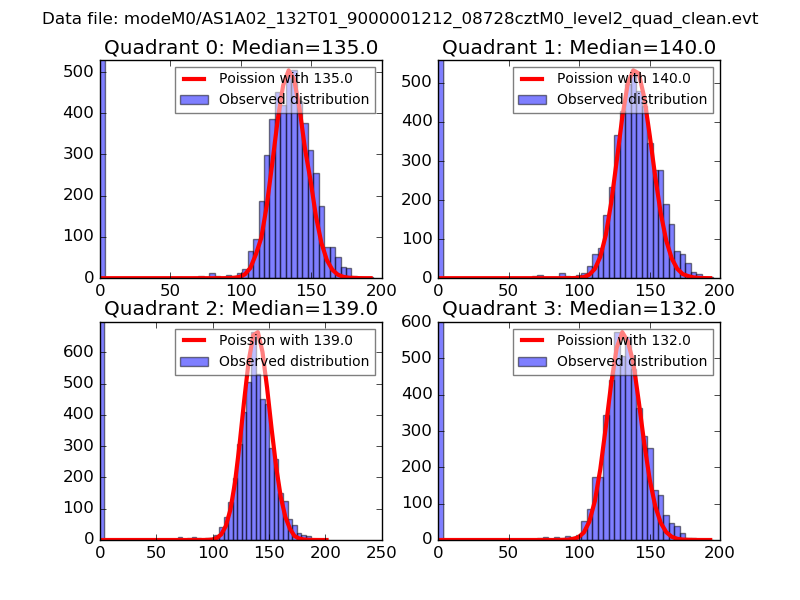 |
 |
| Quadrant-wise count rates Data is divided into 100 sec bins |
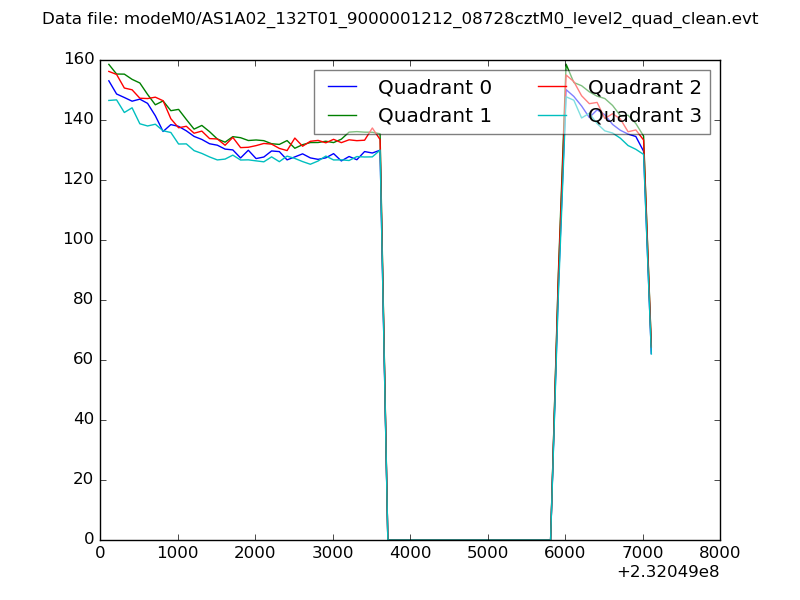 |
|
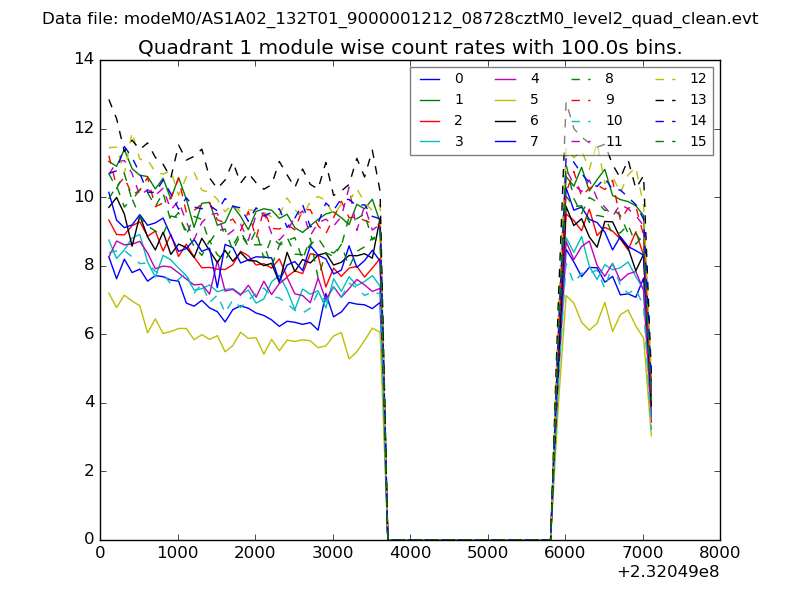
| Module-wise count rates for Quadrant A Data is divided into 100 sec bins |
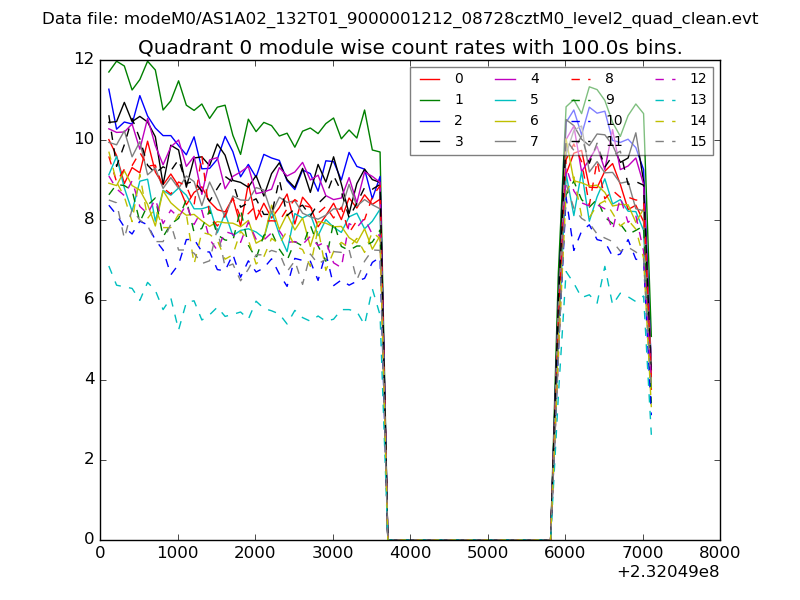 |
 |
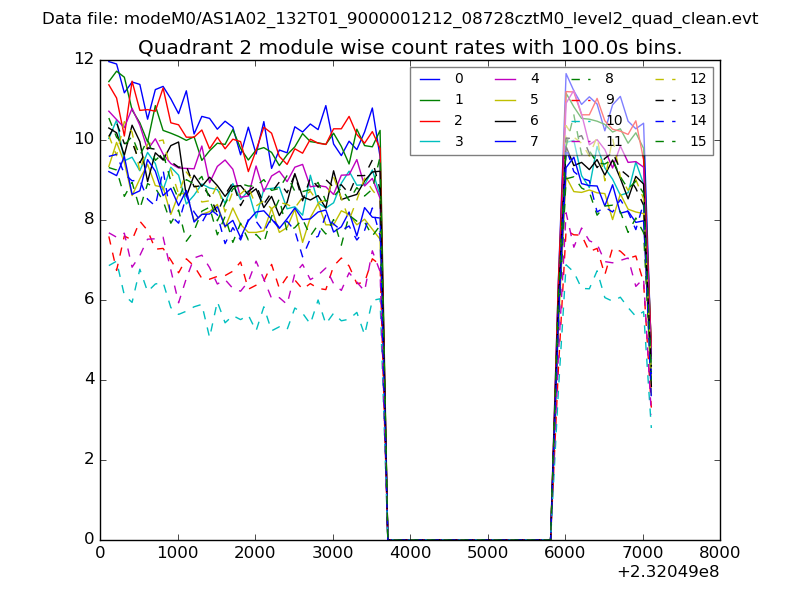
| Module-wise count rates for Quadrant B Data is divided into 100 sec bins |
 |
 |
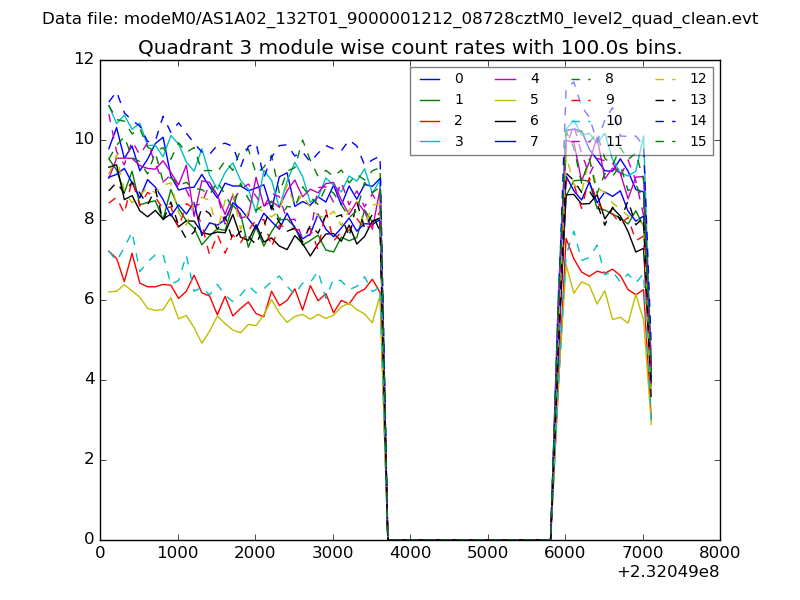
| Module-wise count rates for Quadrant C Data is divided into 100 sec bins |
 |
 |
| Module-wise count rates for Quadrant D Data is divided into 100 sec bins |
 |
 |
| Parameter | Plot |
|---|---|
| CZT HV Monitor | 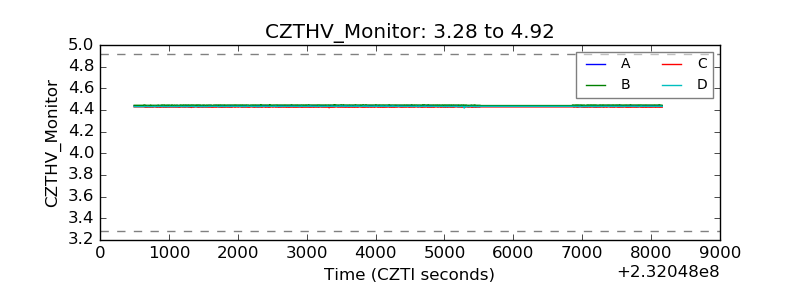 |
| D_VDD | 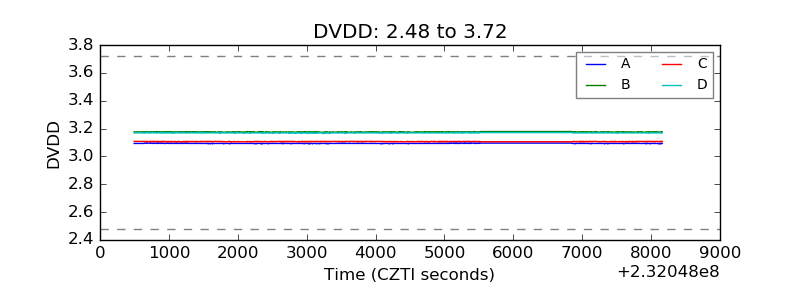 |
| Temperature 1 | 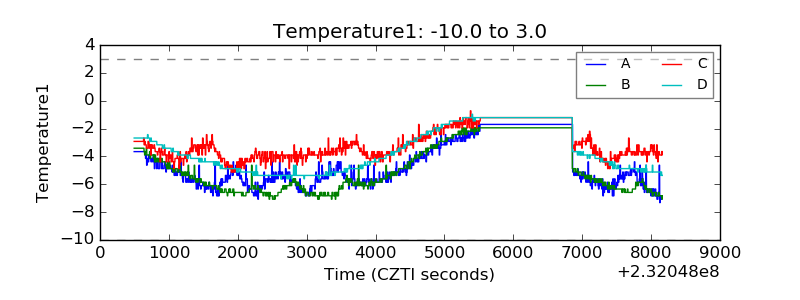 |
| Veto HV Monitor | 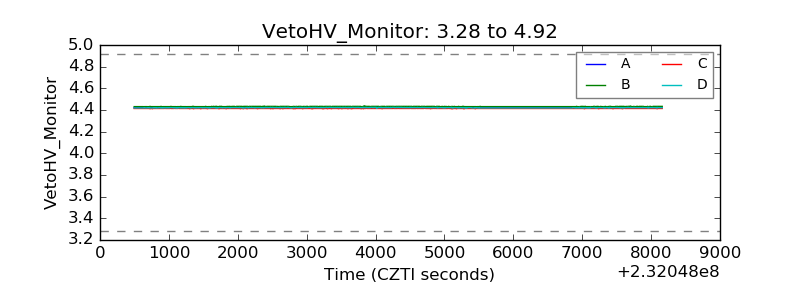 |
| Veto LLD | 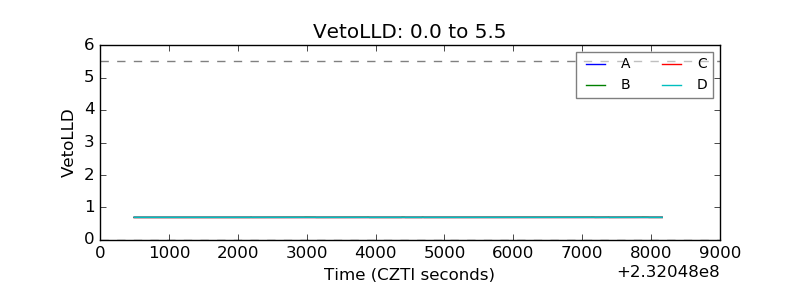 |
| Alpha Counter | 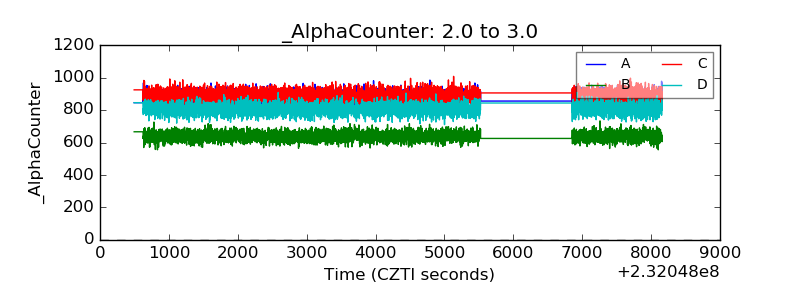 |
| _CPM_Rate | 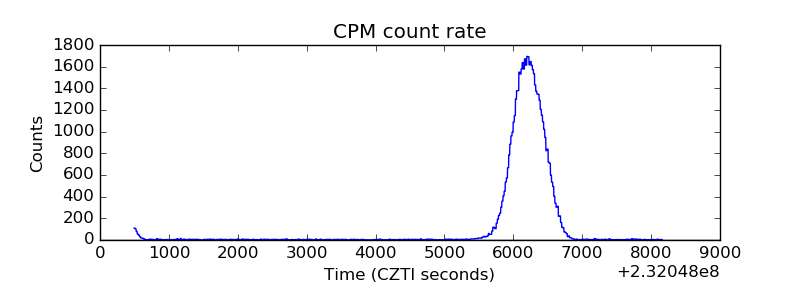 |
| CZT Counter | 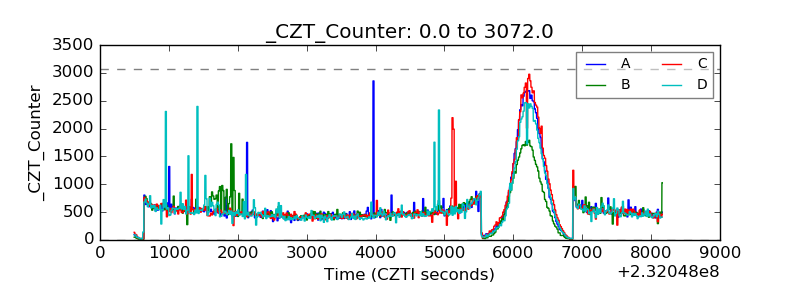 |
| +2.5 Volts monitor |  |
| +5 Volts monitor |  |
| _ROLL_ROT | 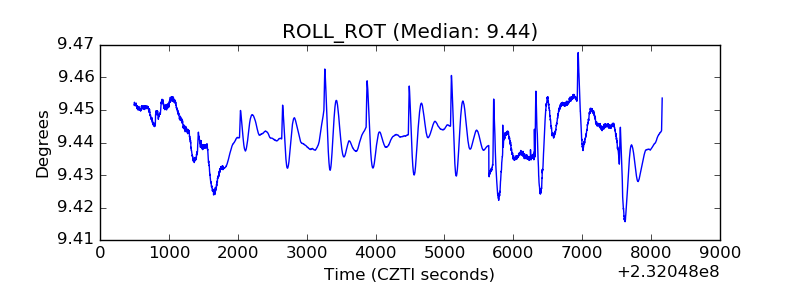 |
| _Roll_DEC | 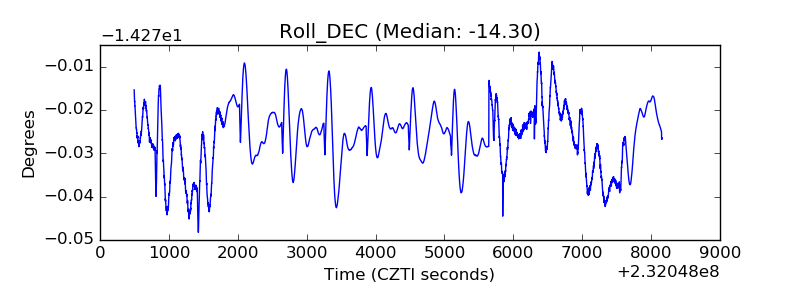 |
| _Roll_RA | 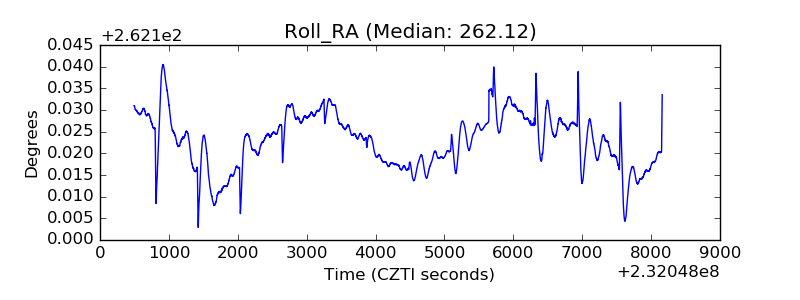 |
| Veto Counter | 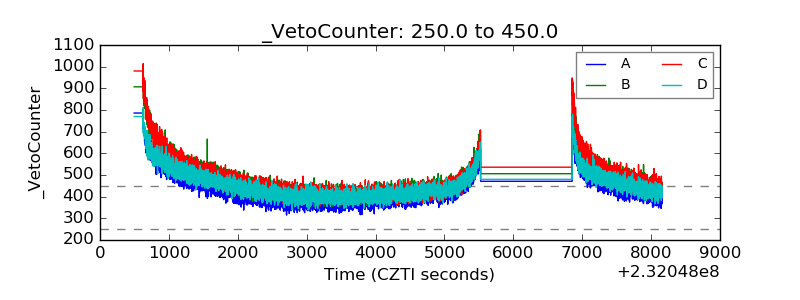 |